Quantitative finance research software
A visual research platform for assembling and testing tactical asset allocation and signal based strategies over 20 years.


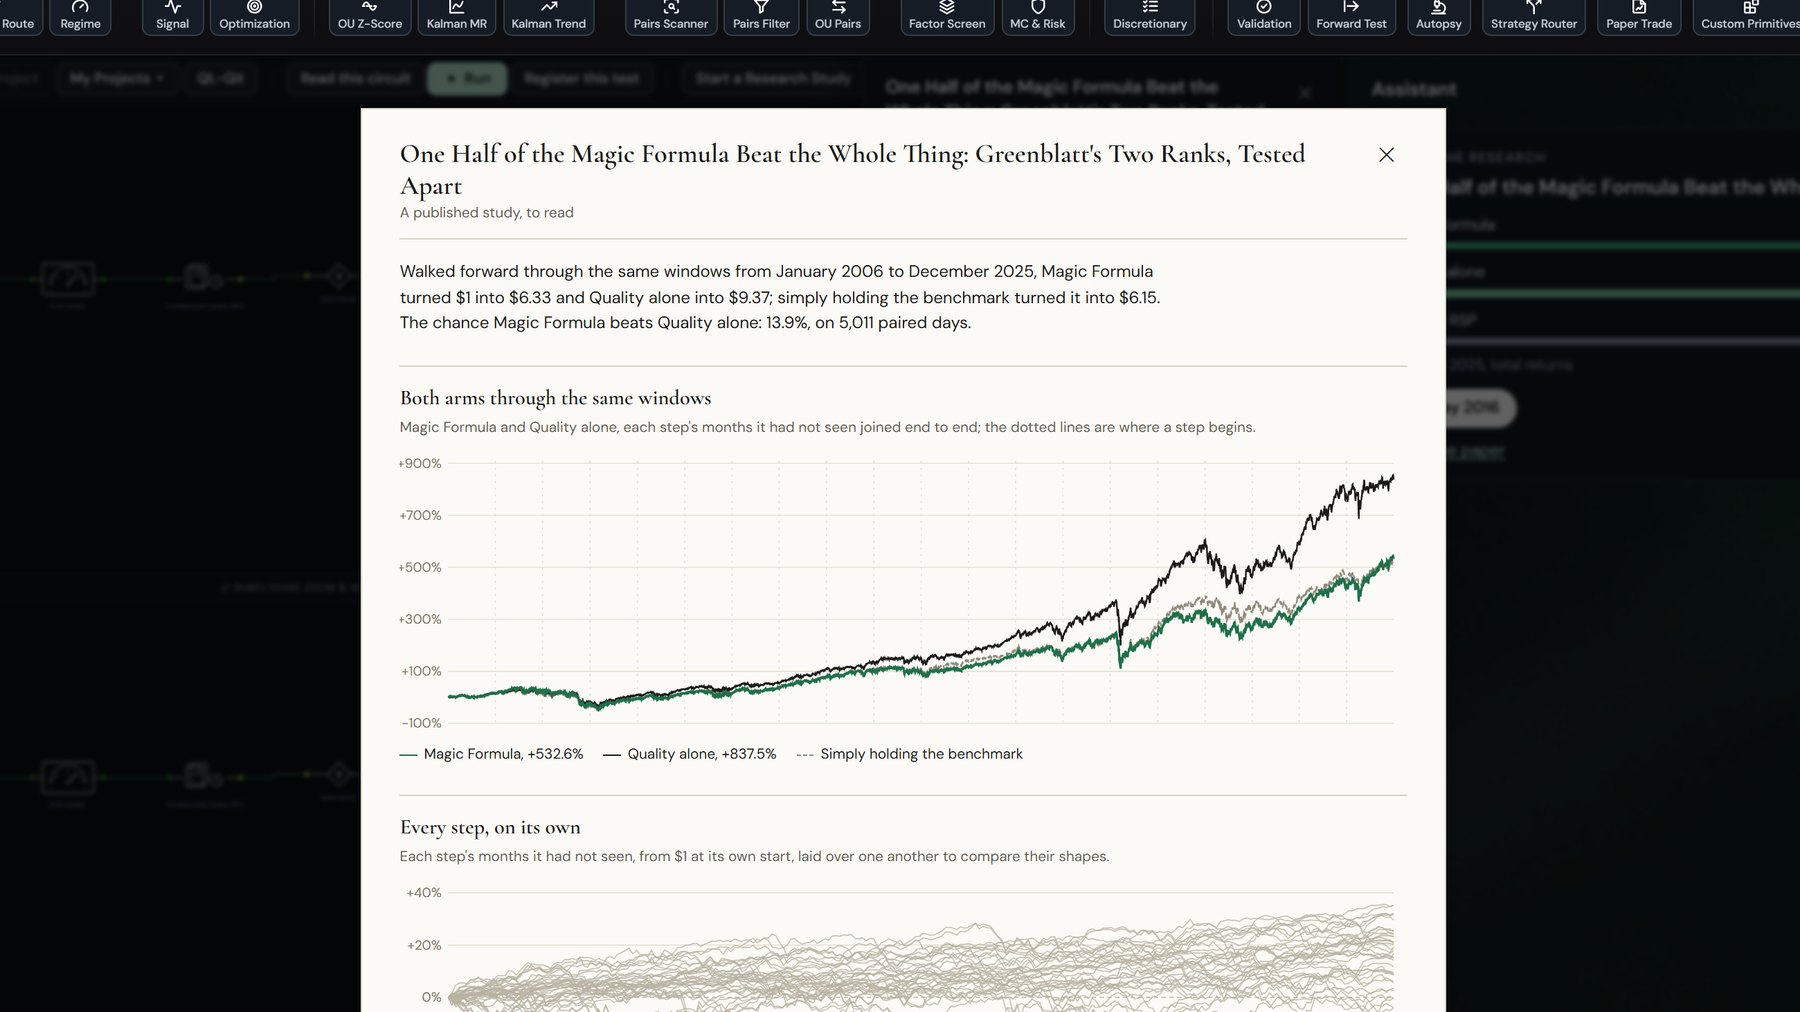
Latest published research
113 explainers on the methods QuanterLab implements: mean reversion, stochastic models, factor portfolios, walk-forward validation, and the math behind every backtest.
QuanterLab is software built for quantitative research. Nothing here was written up after the fact. The platform produced it under the same discipline it applies to your own work: a hypothesis is registered before any result can be scored, every date sees only what was knowable on that date, and a study has to clear the platform’s checks before it can publish. Free to read.
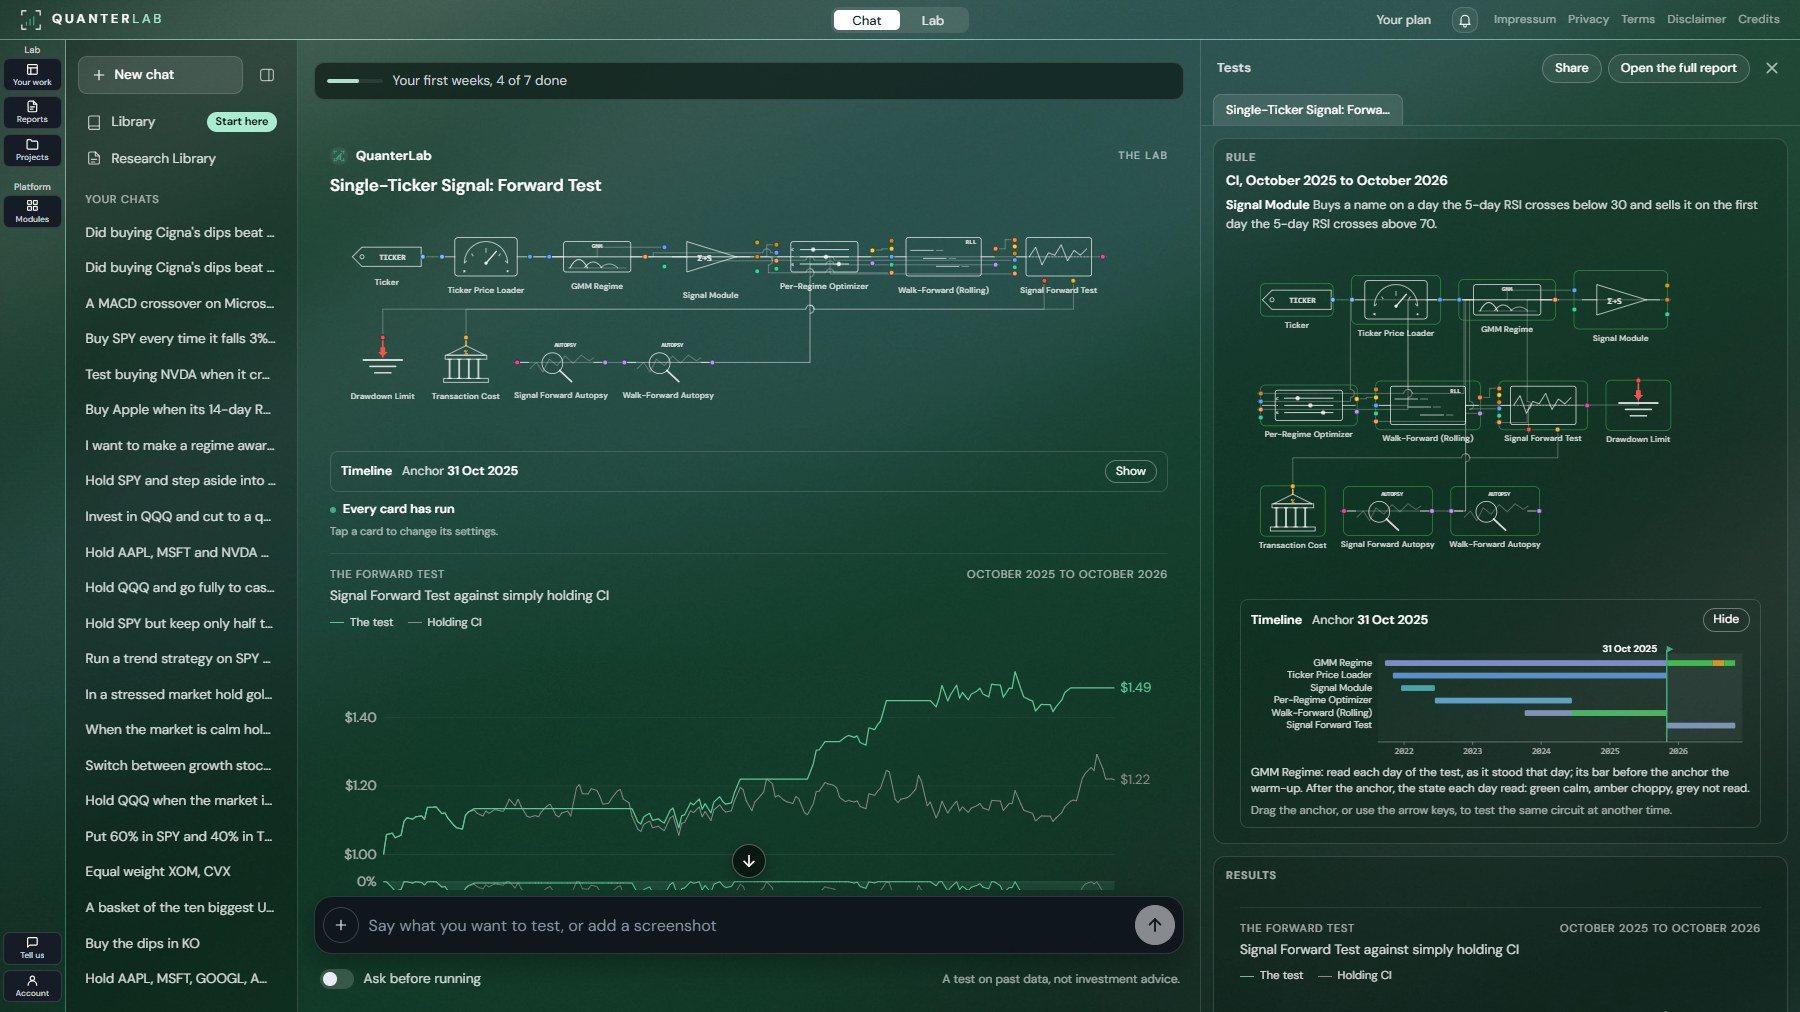
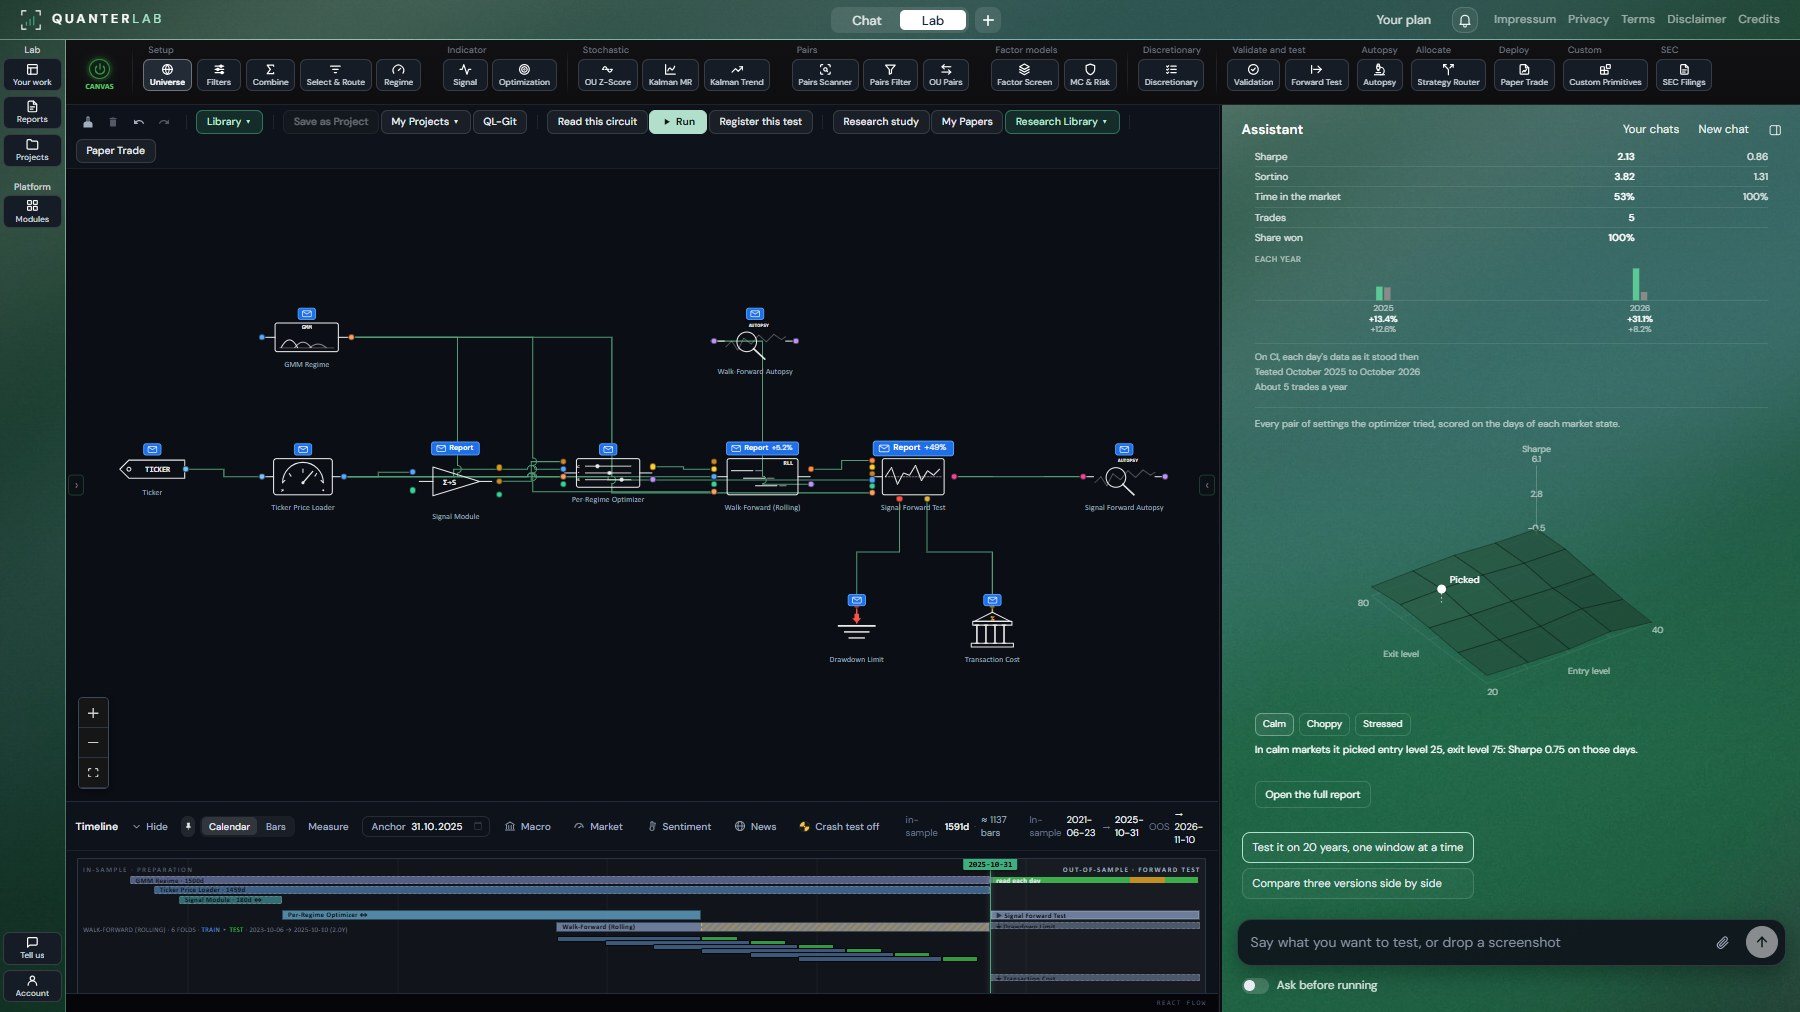
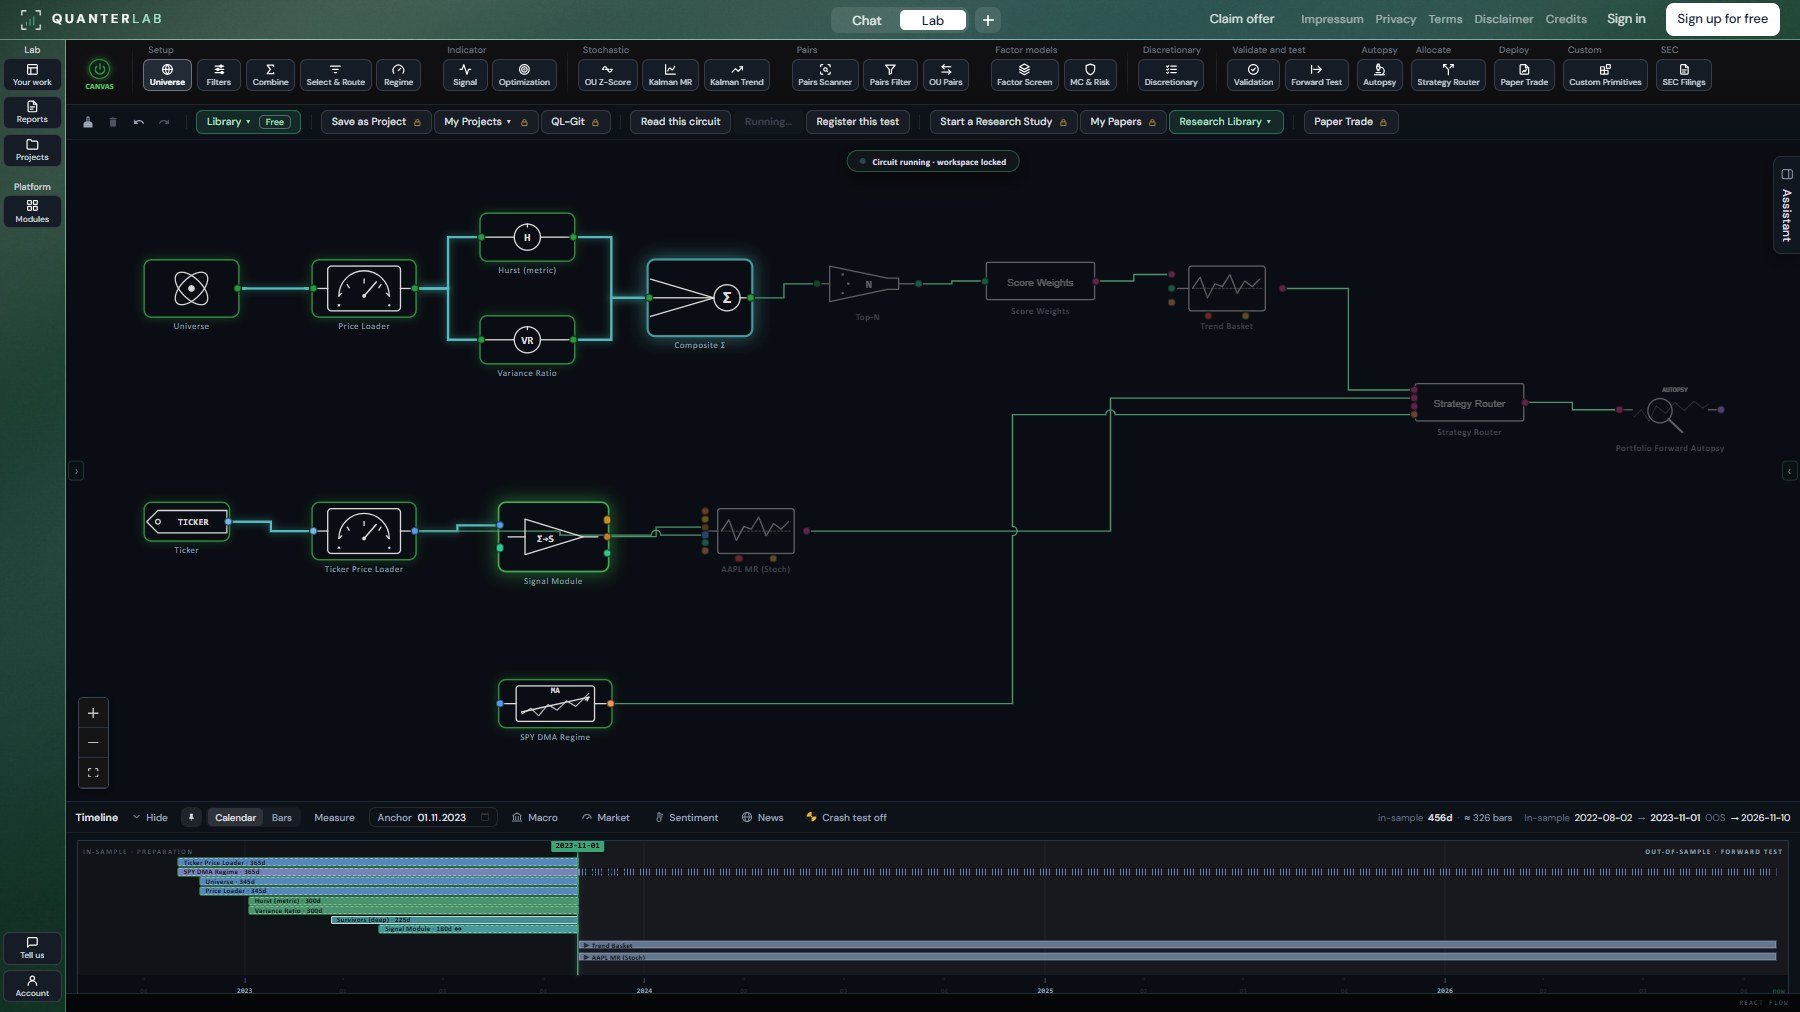
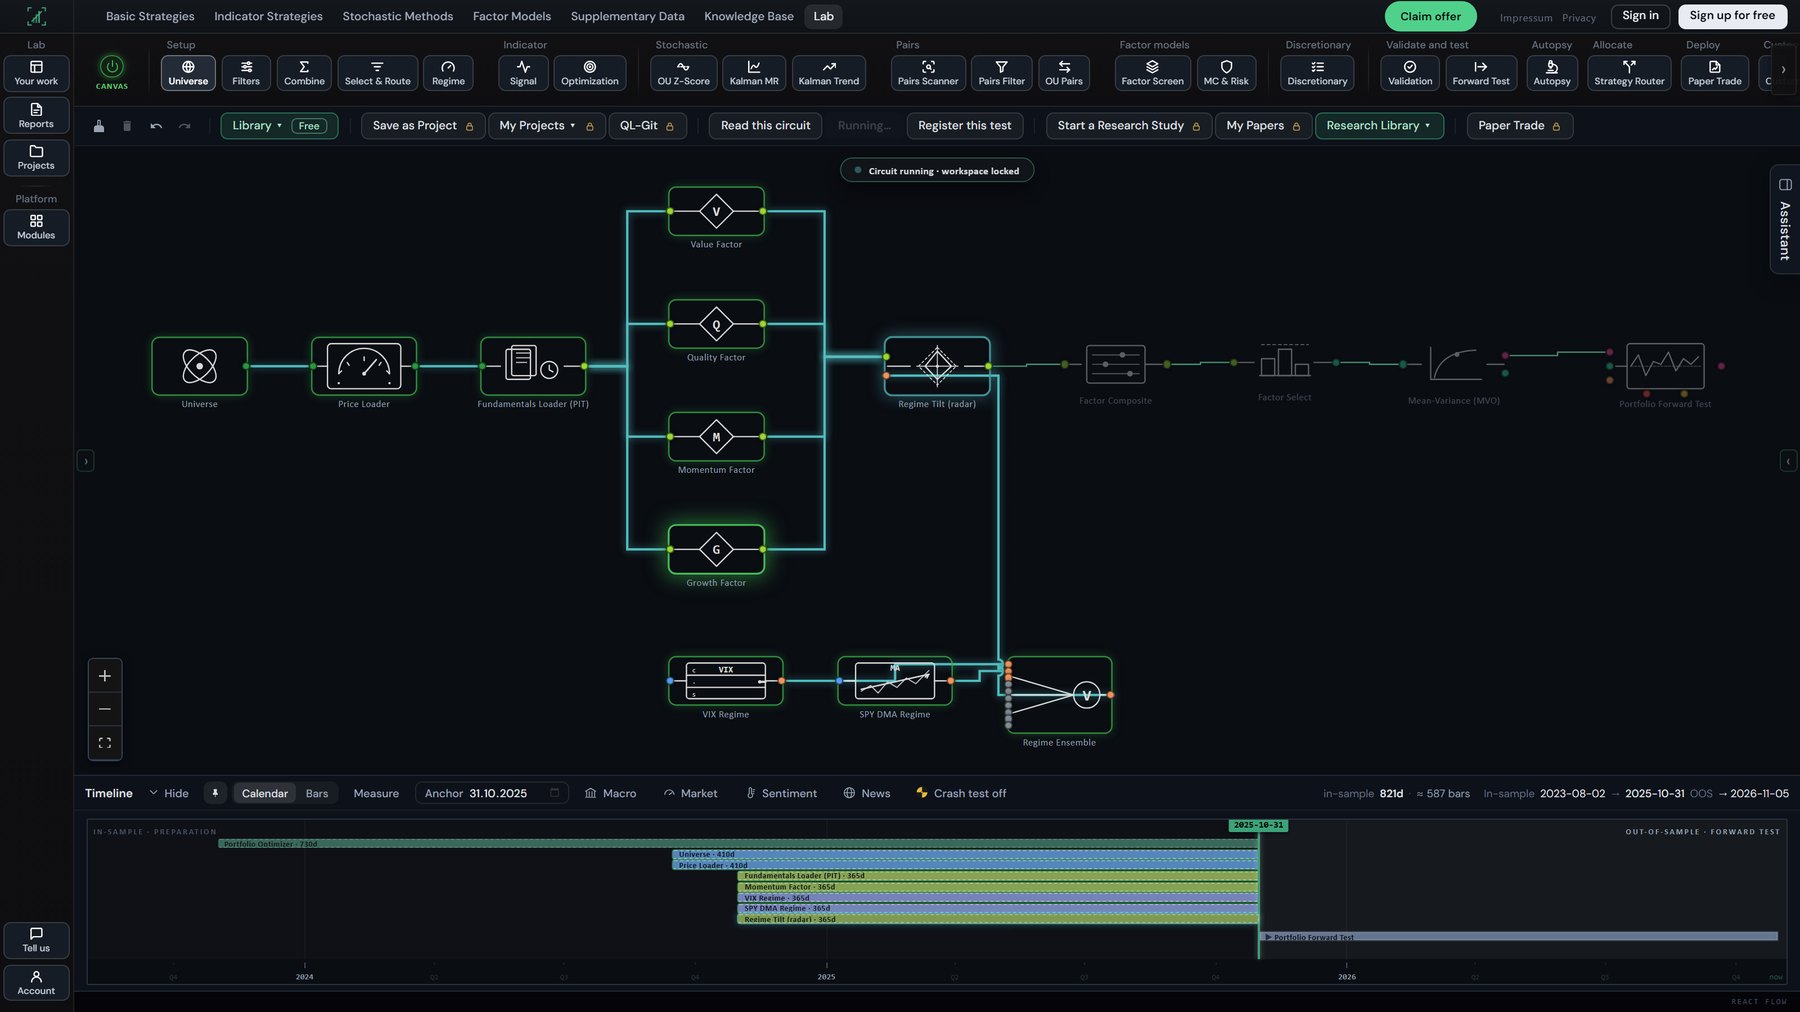
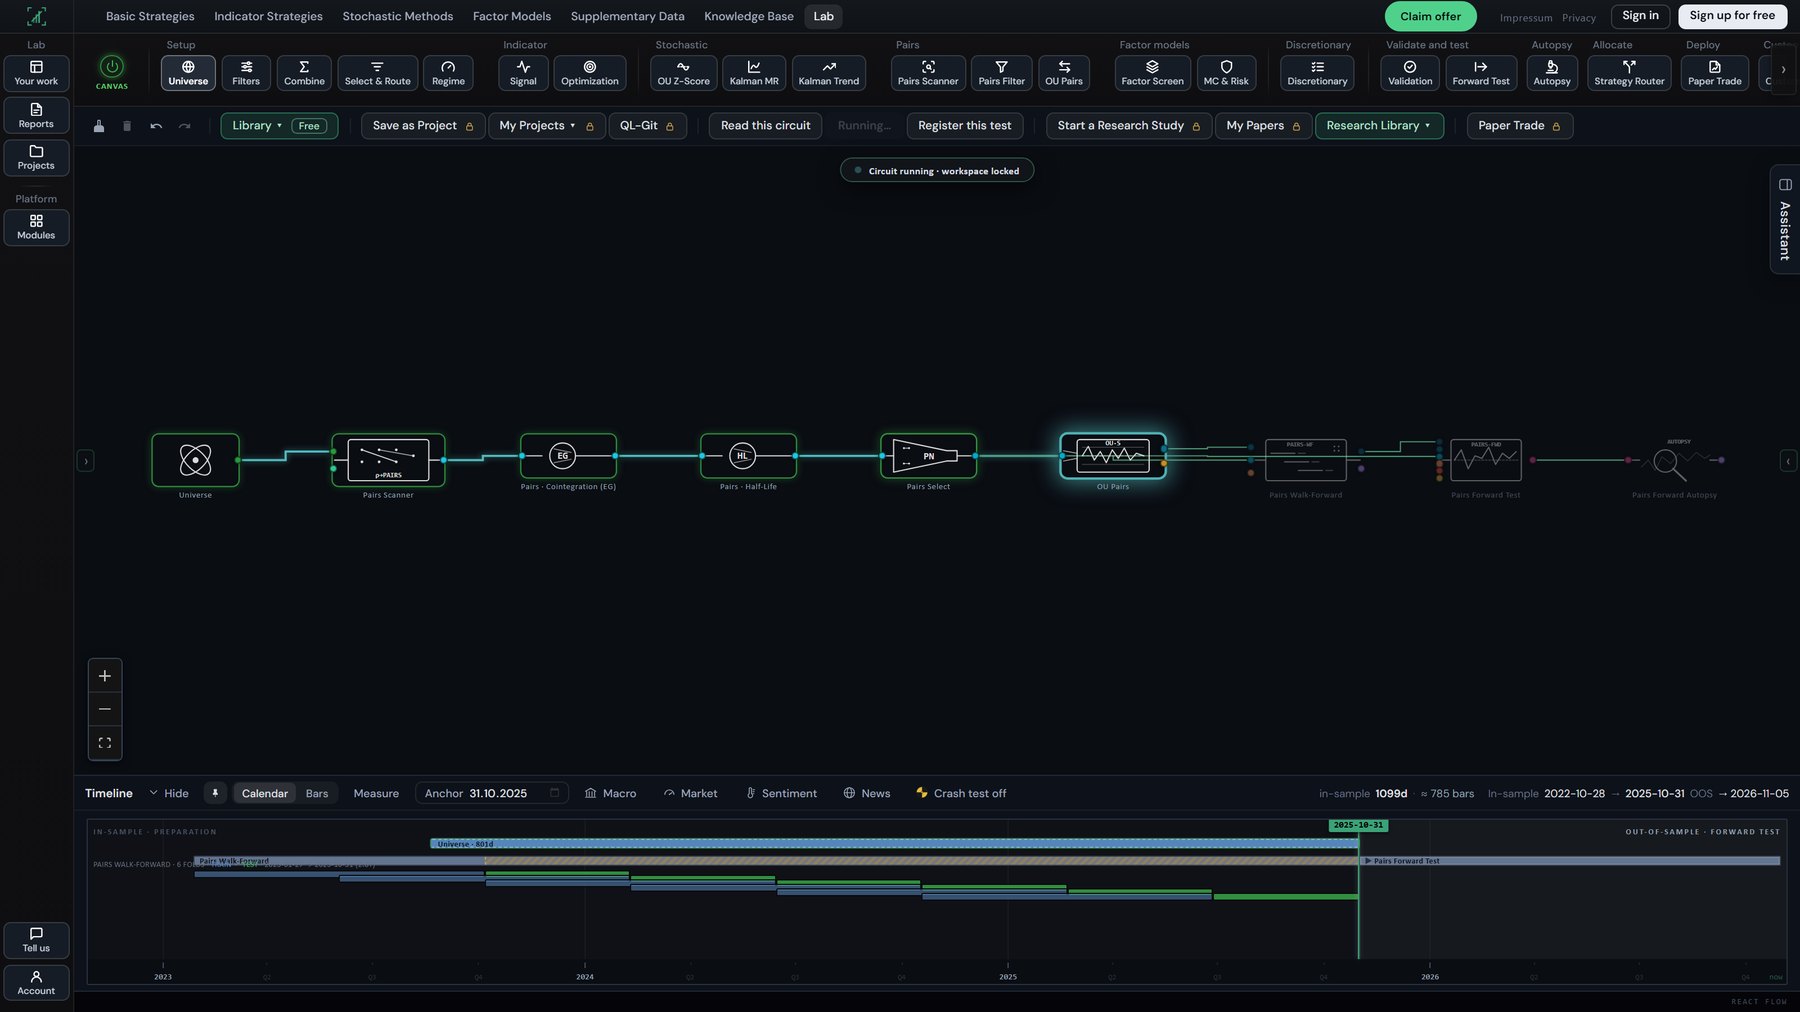
Wire cards on a canvas into a strategy, then test it on the past, using only what was known on each day.
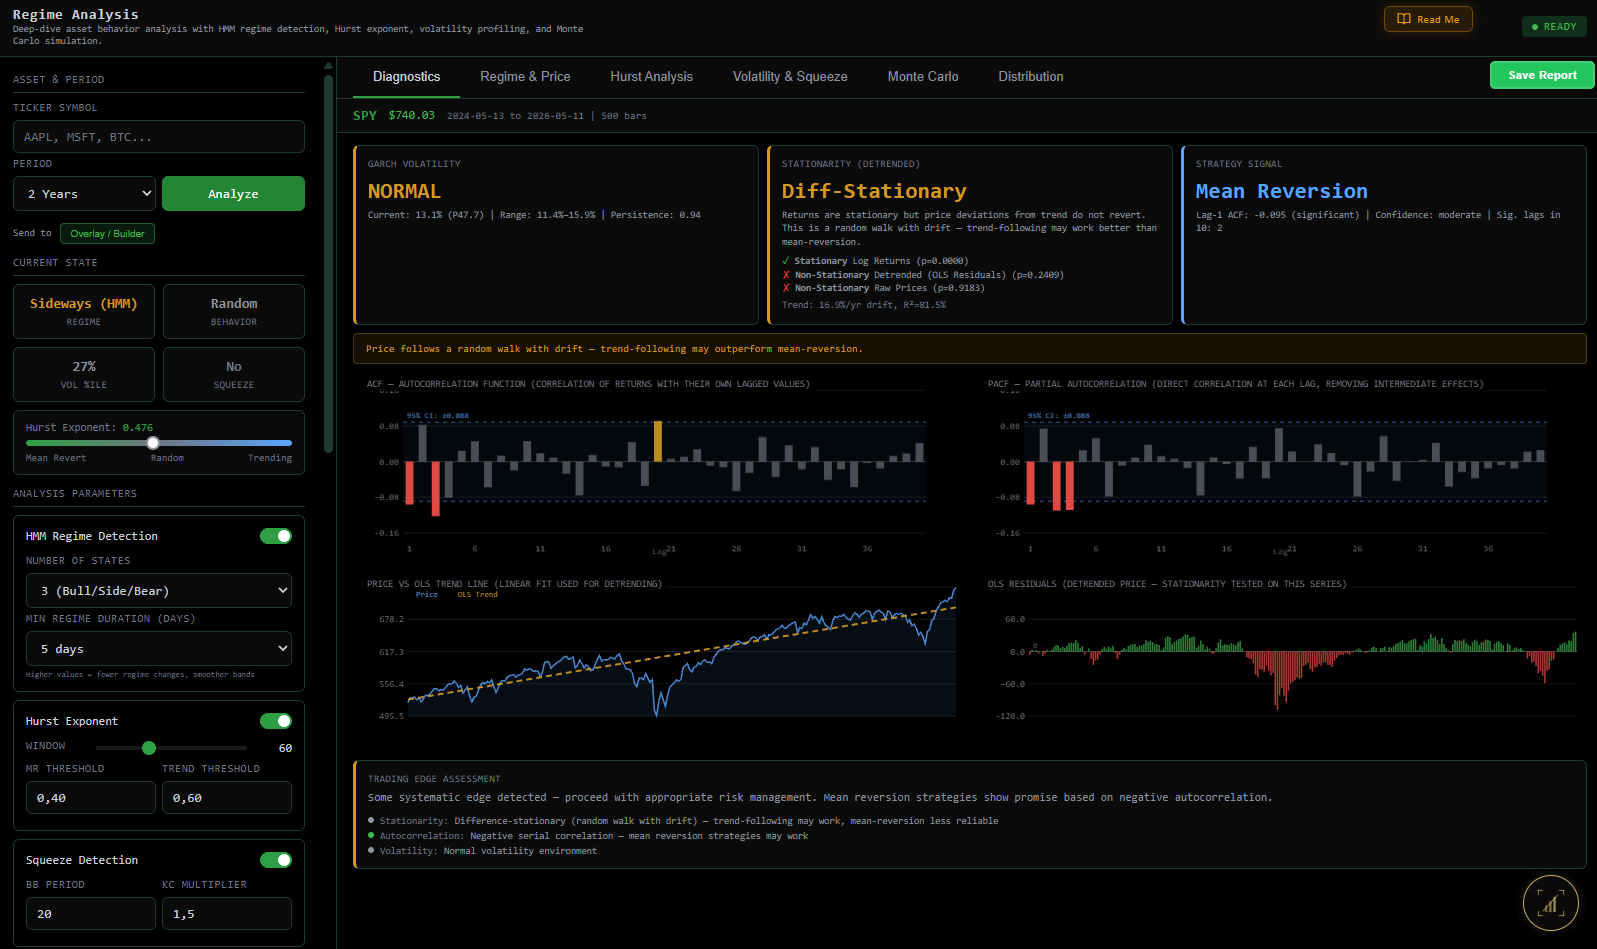
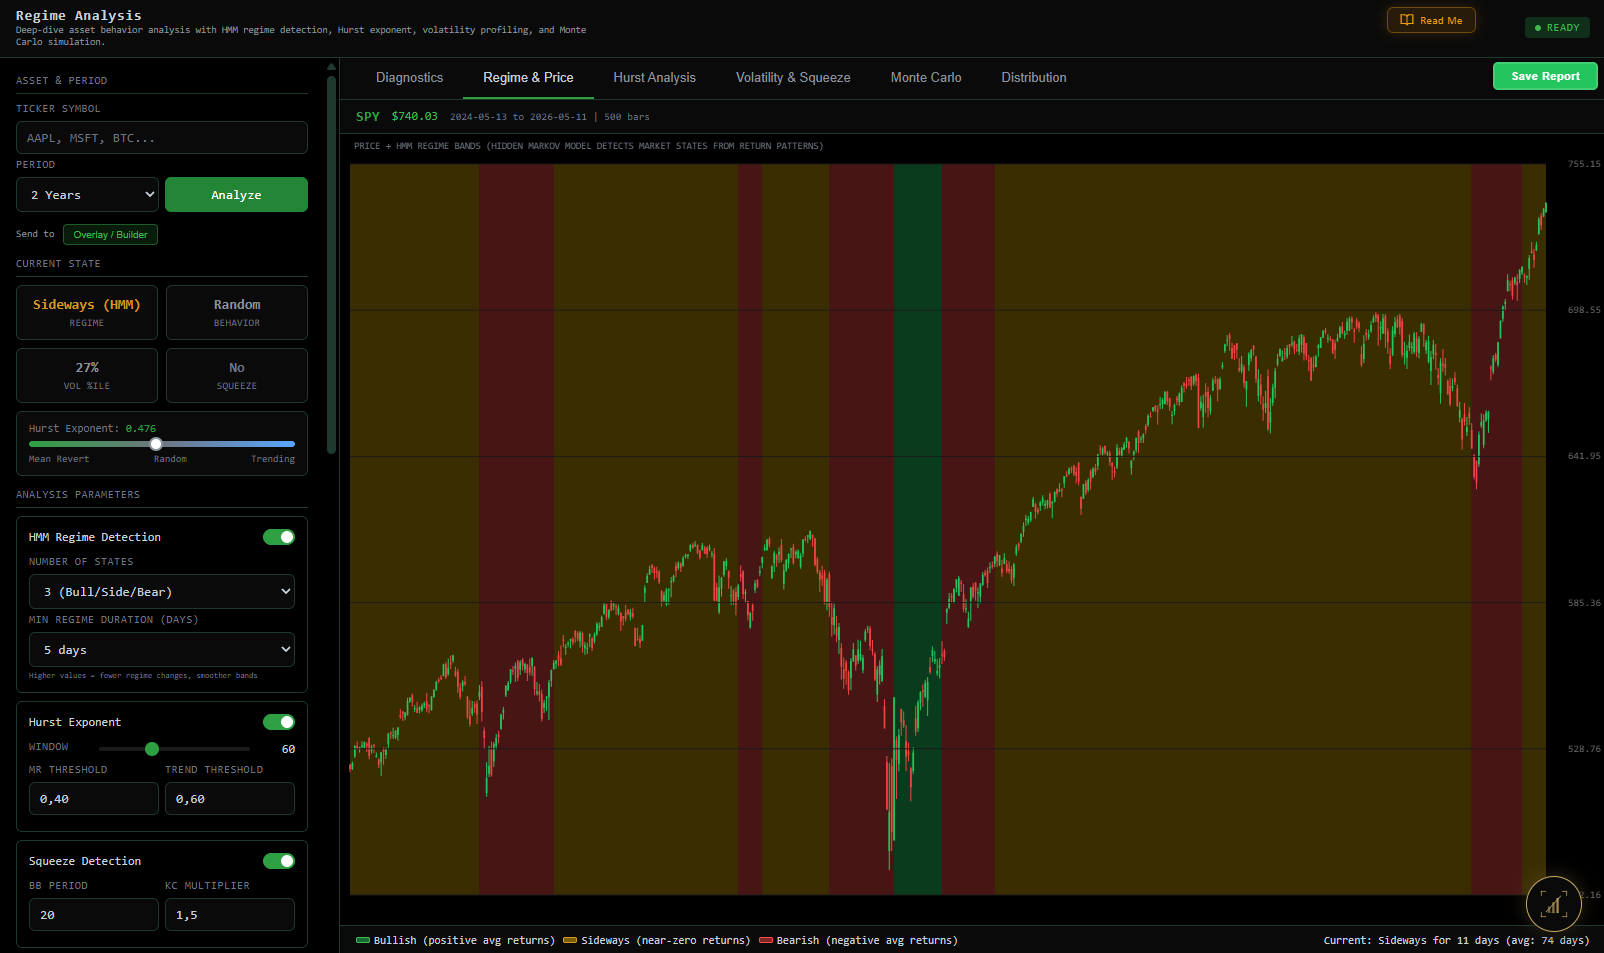
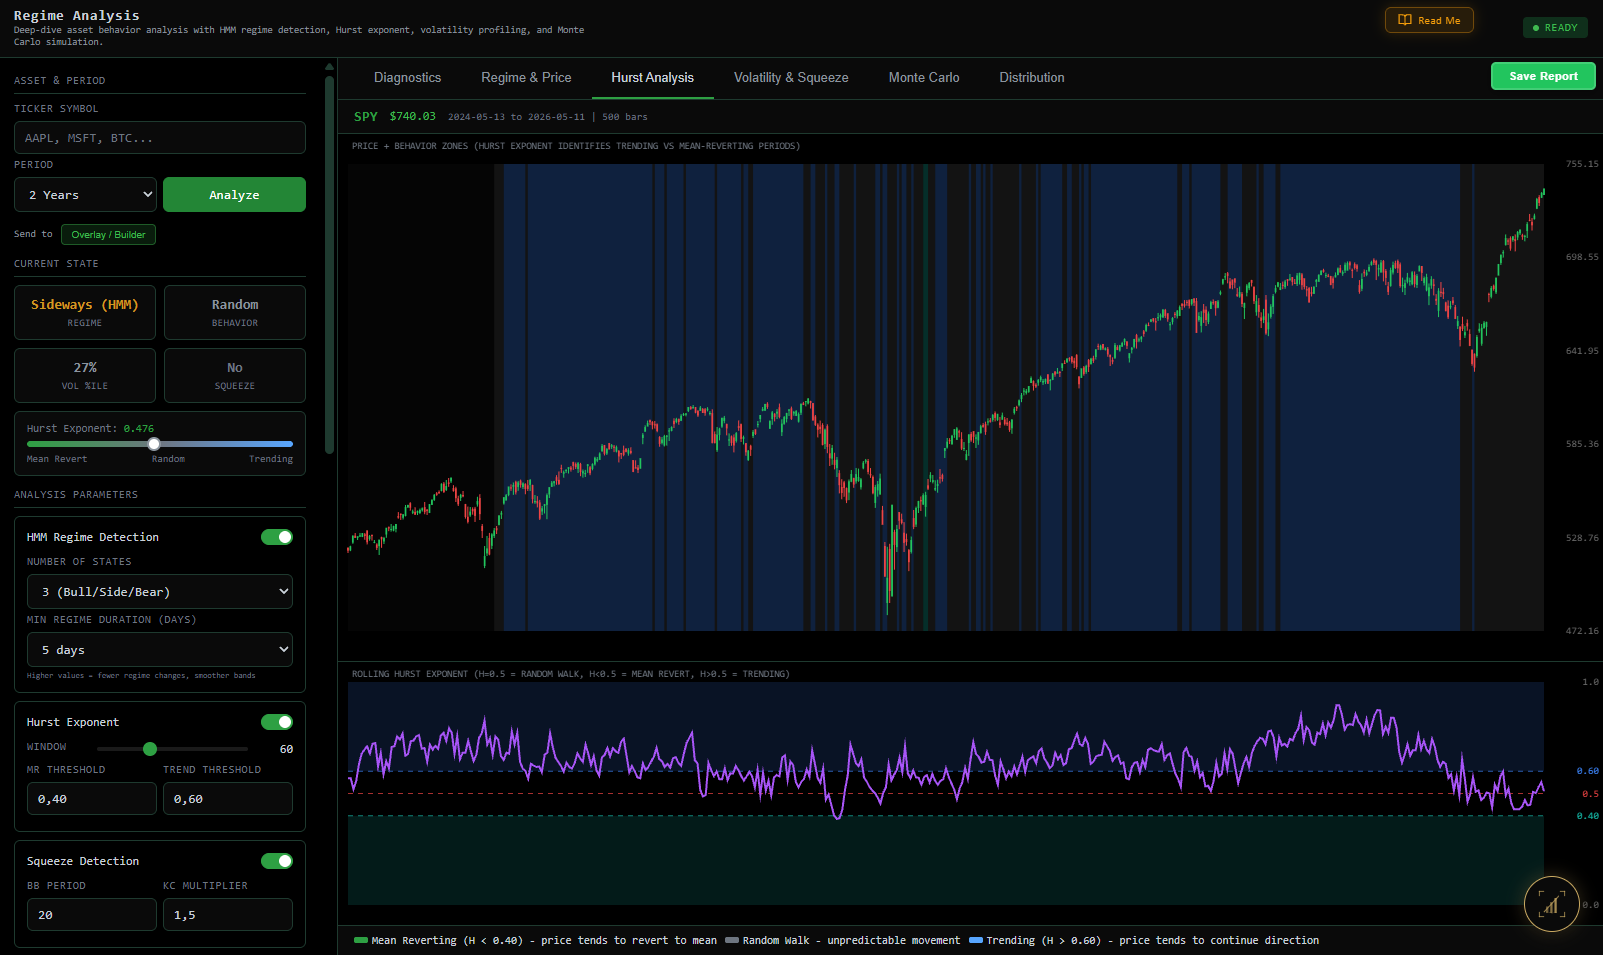
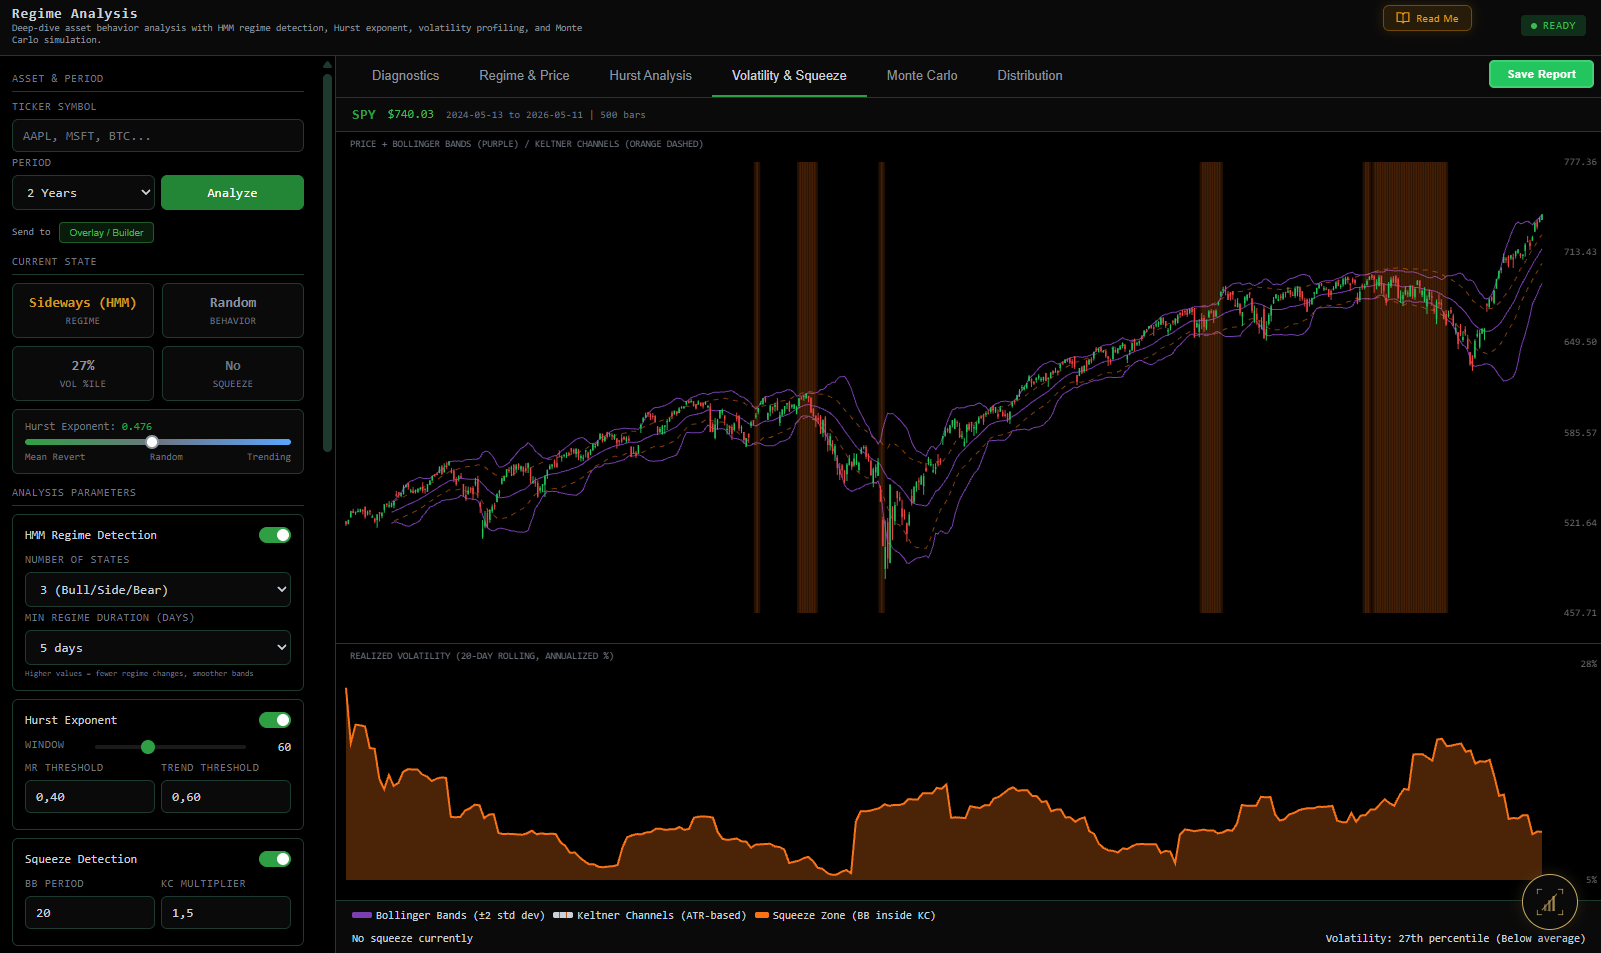
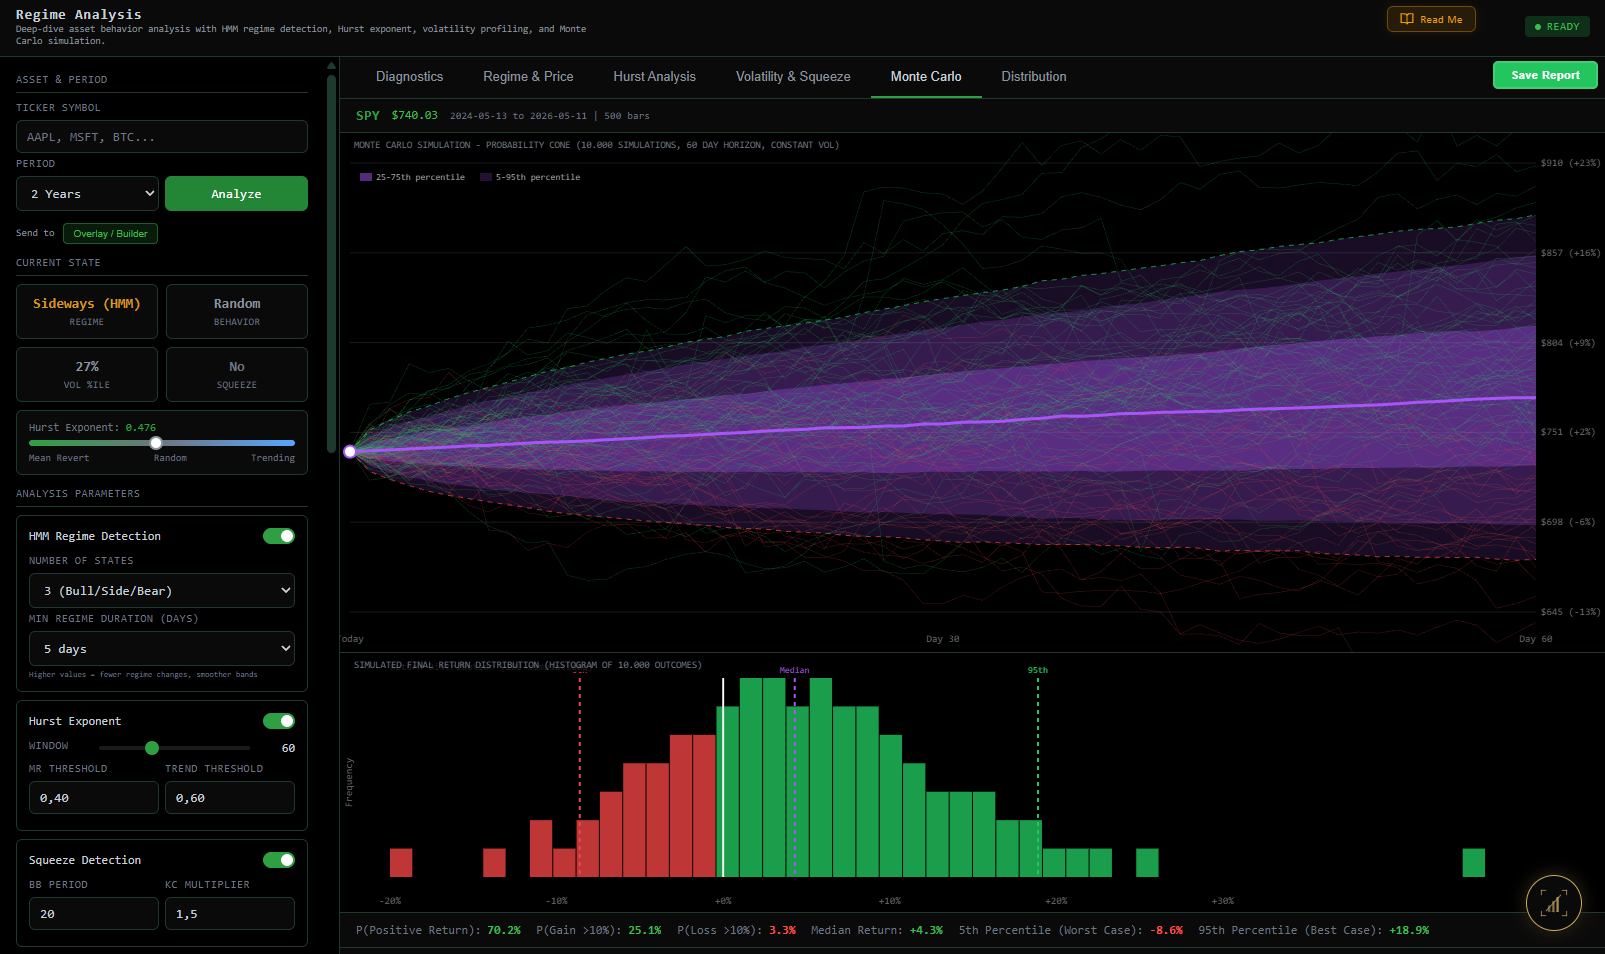
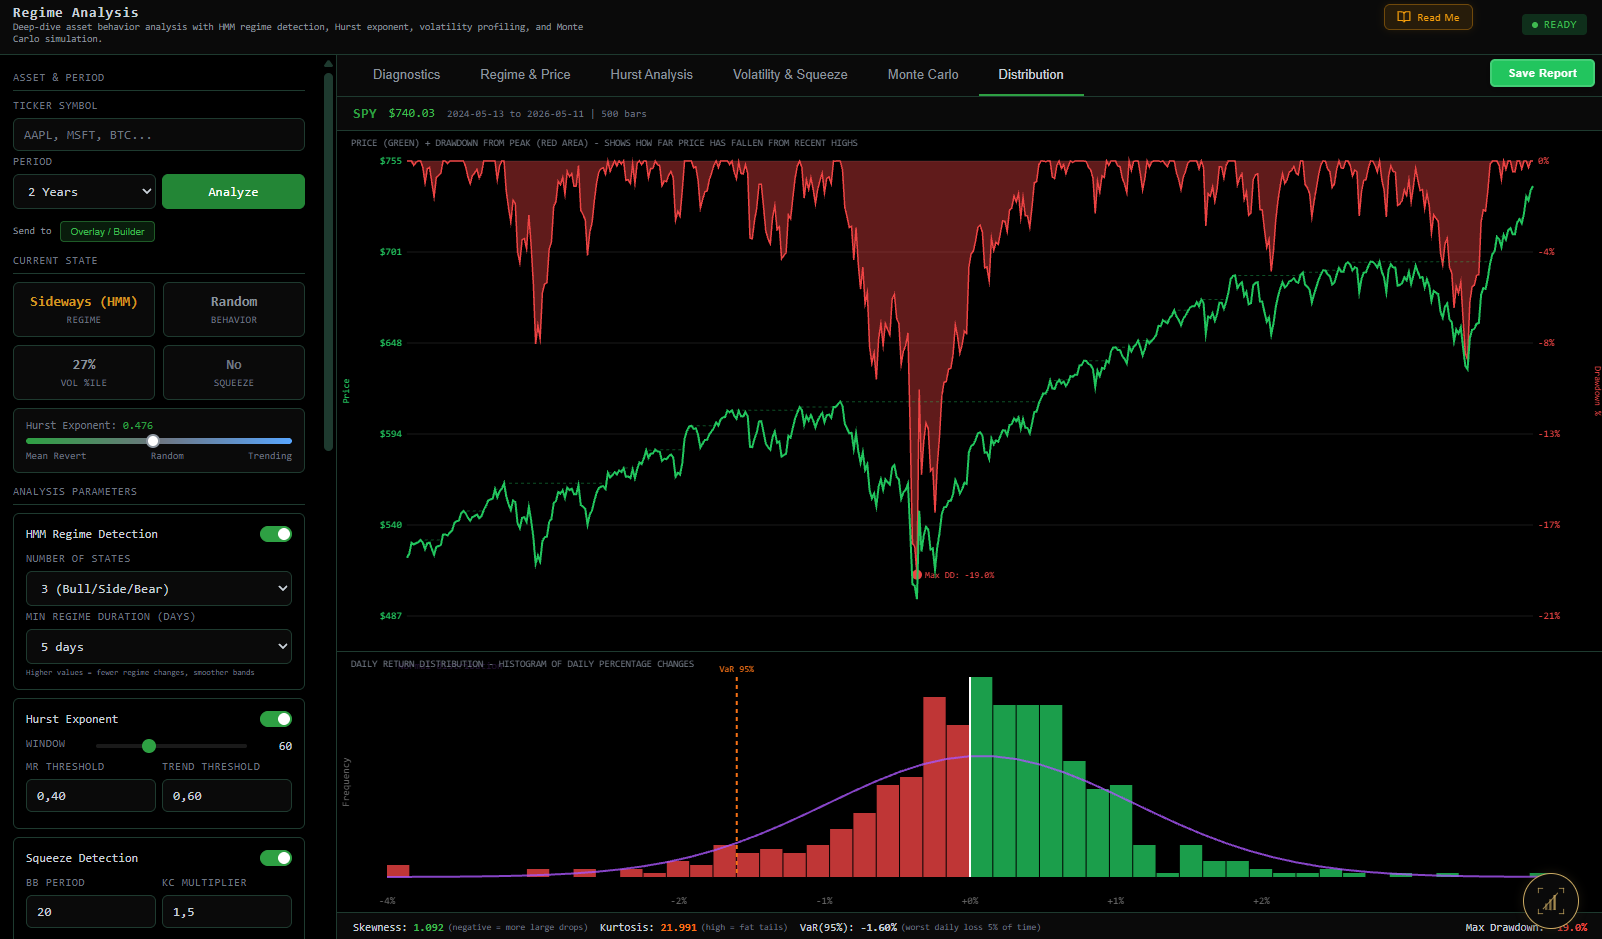
See how a stock behaves before you write a rule for it: whether it trends or drifts back, how calm or wild it is, and how deep its falls have been.
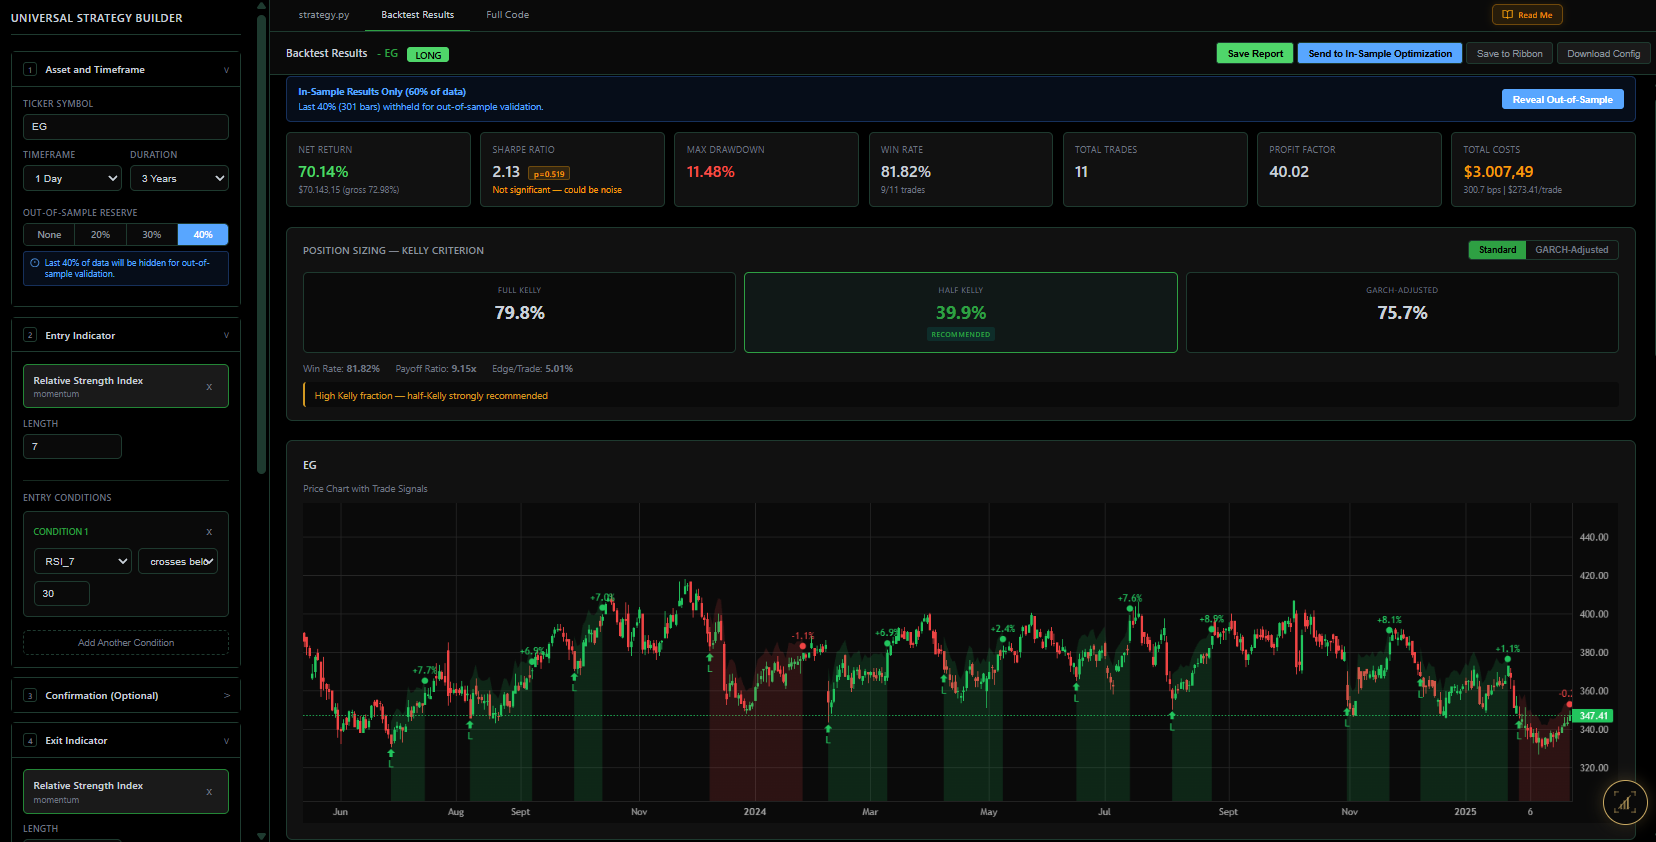
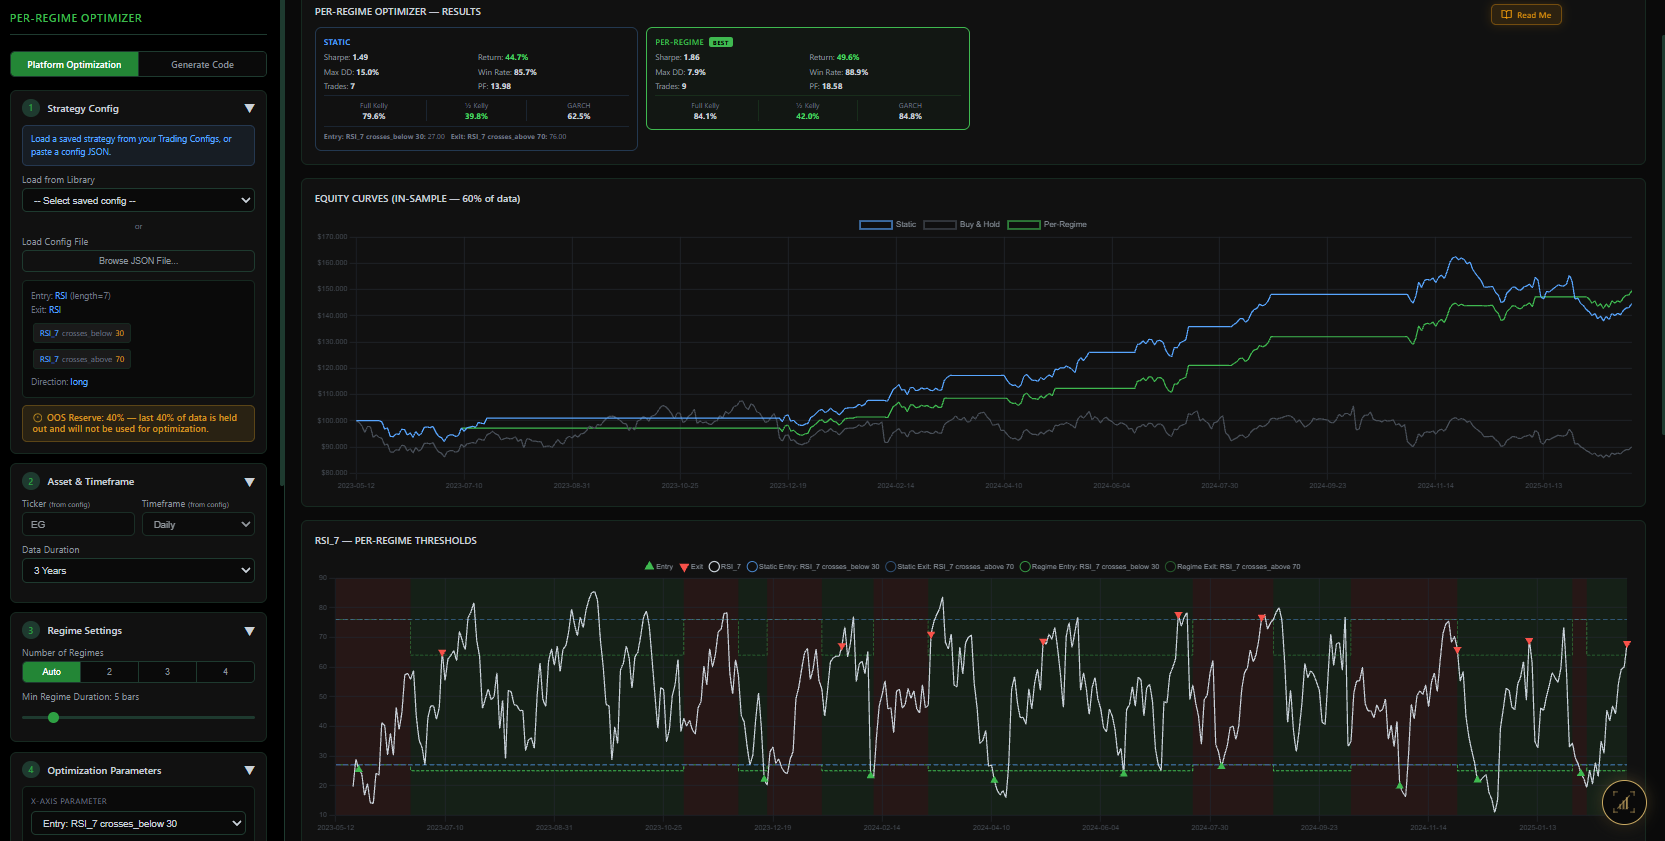
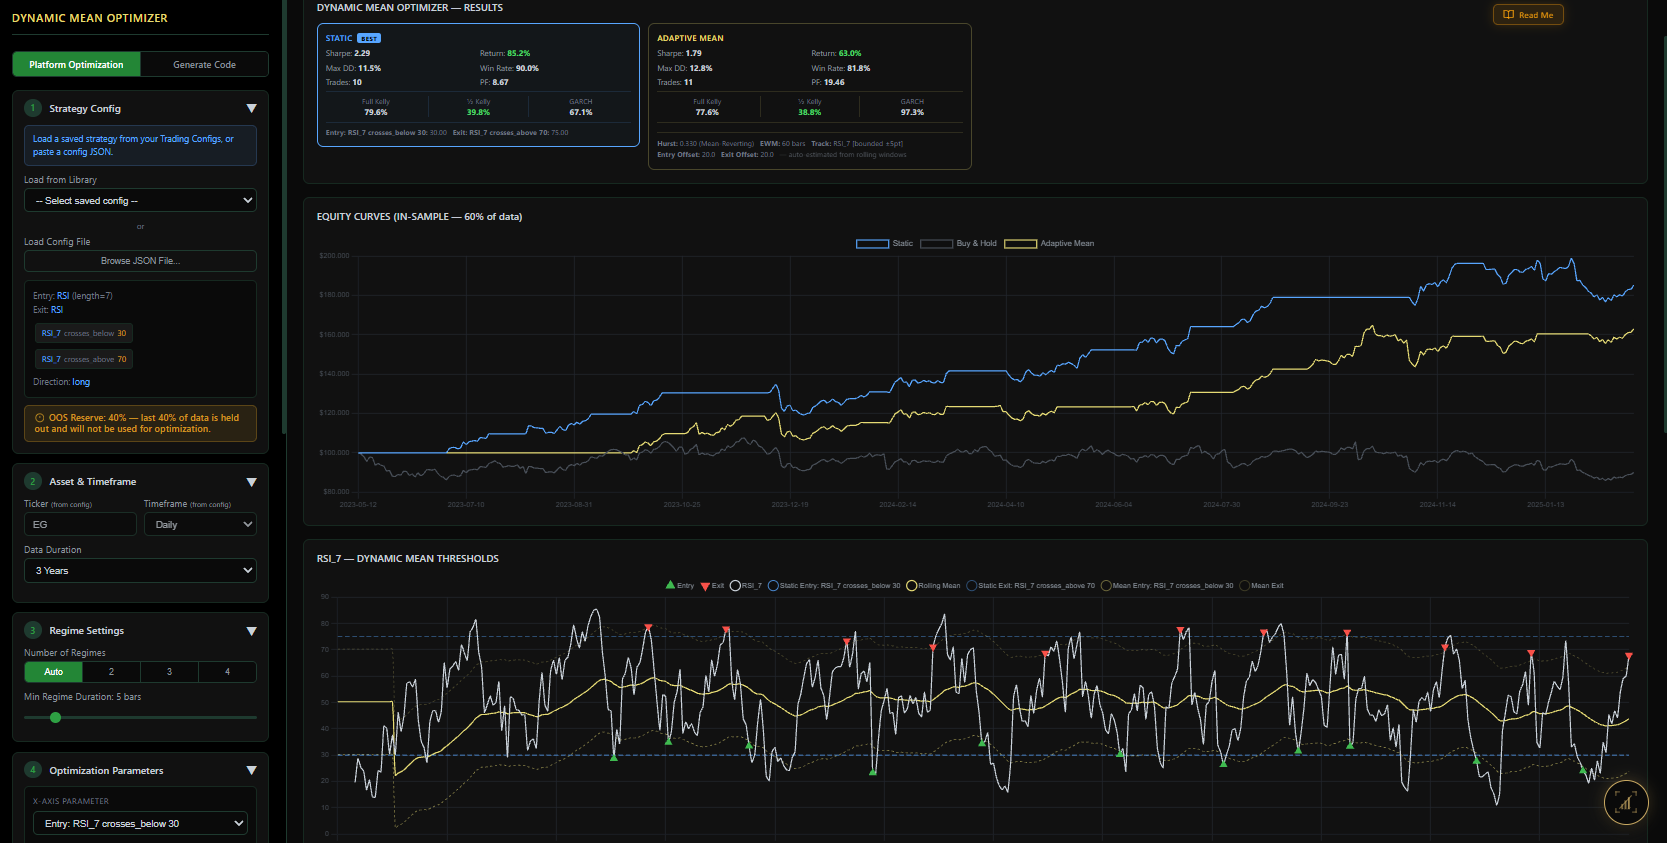
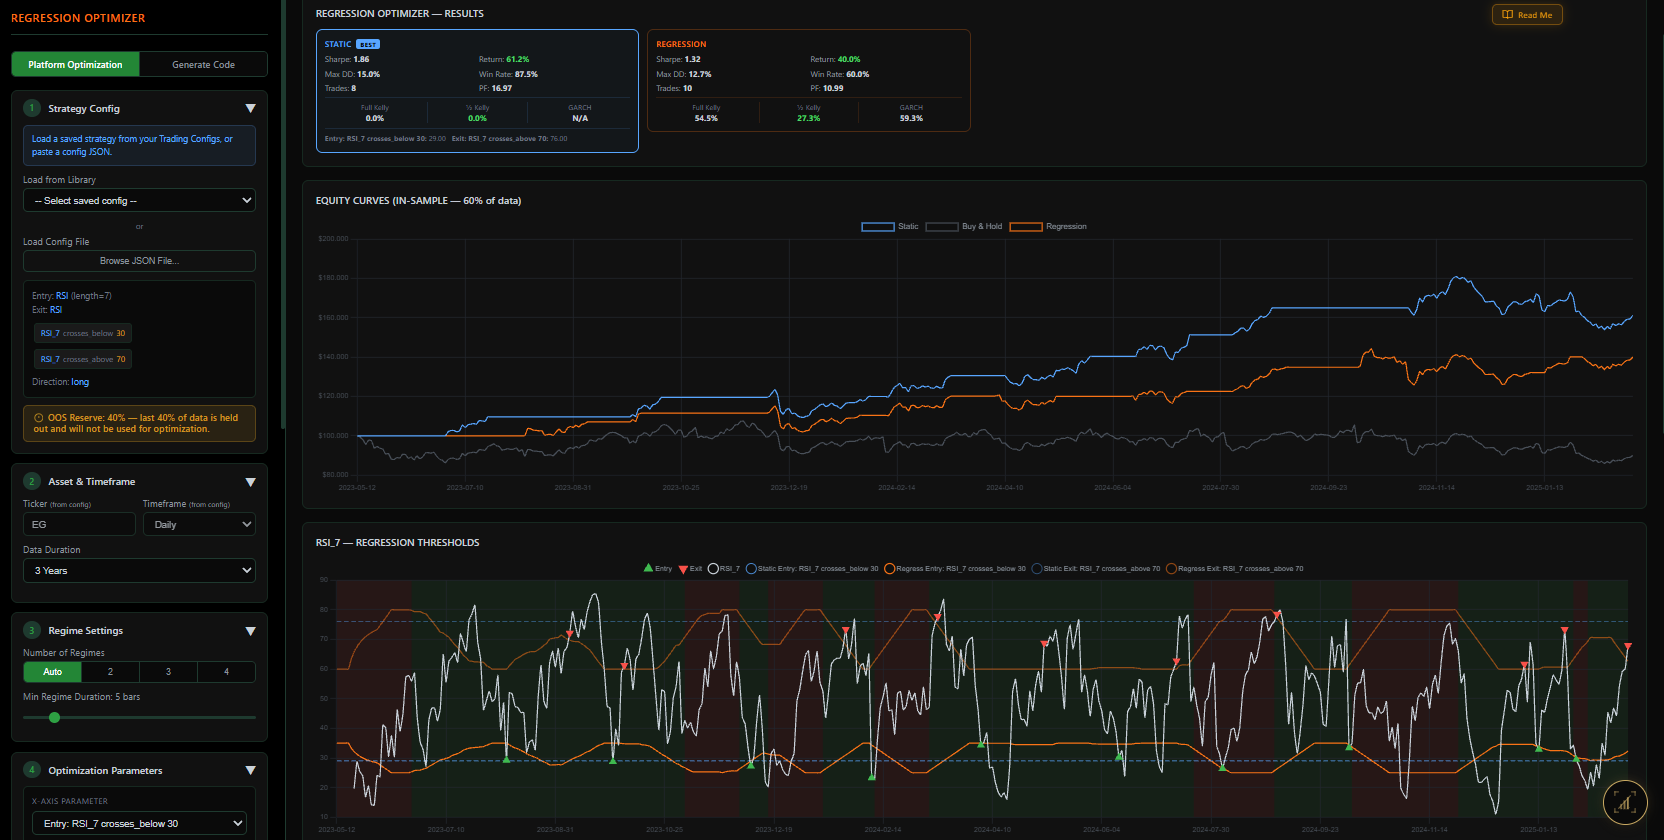
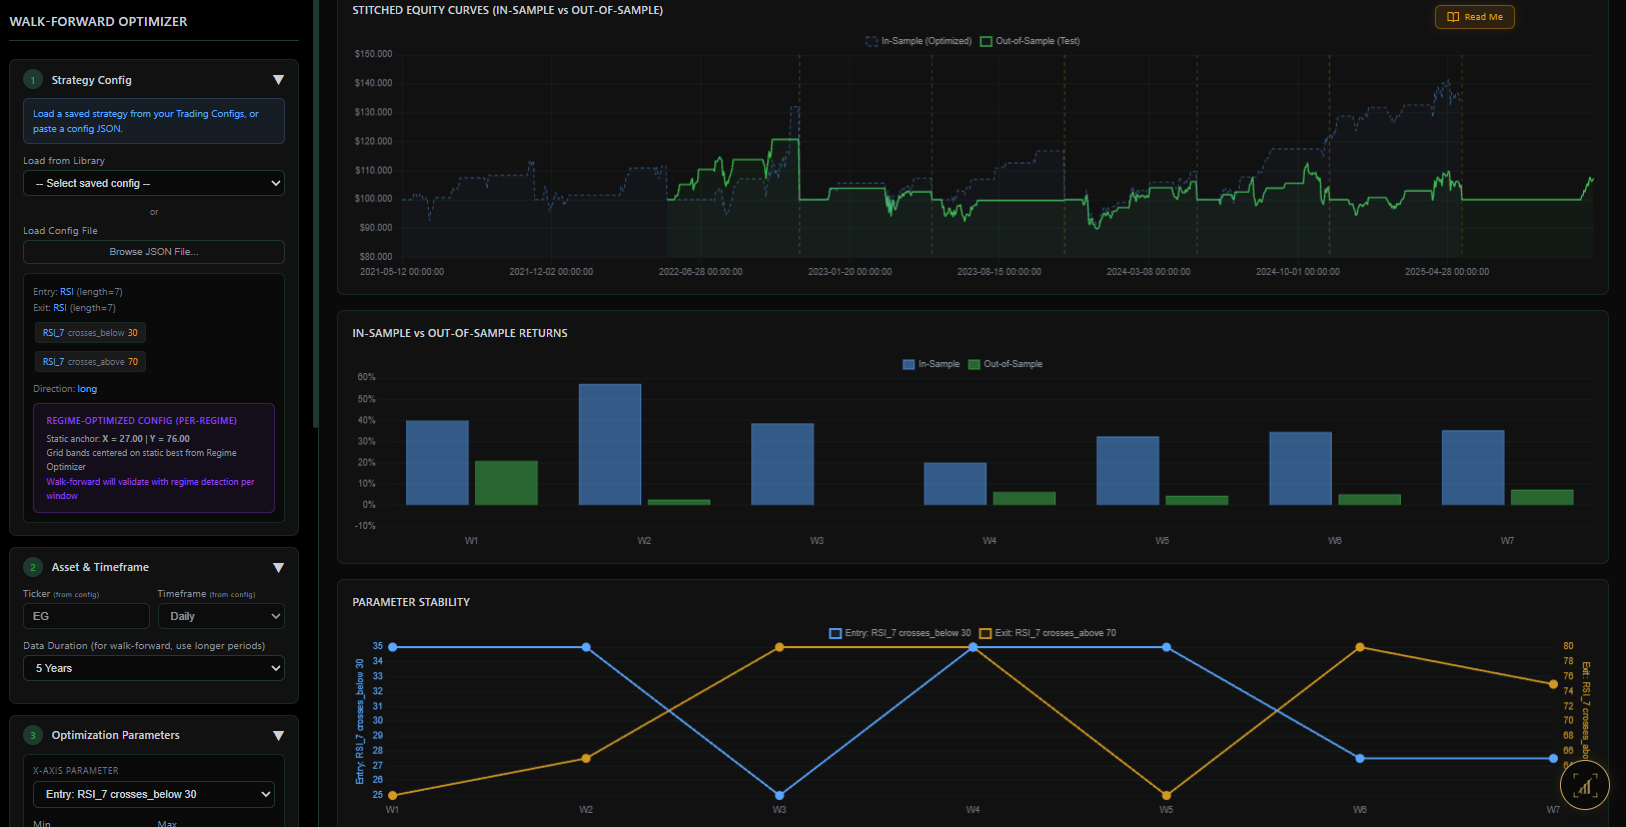
Write a trading rule from indicators such as RSI or a moving average, tune its levels, and check them on years they were not tuned on.
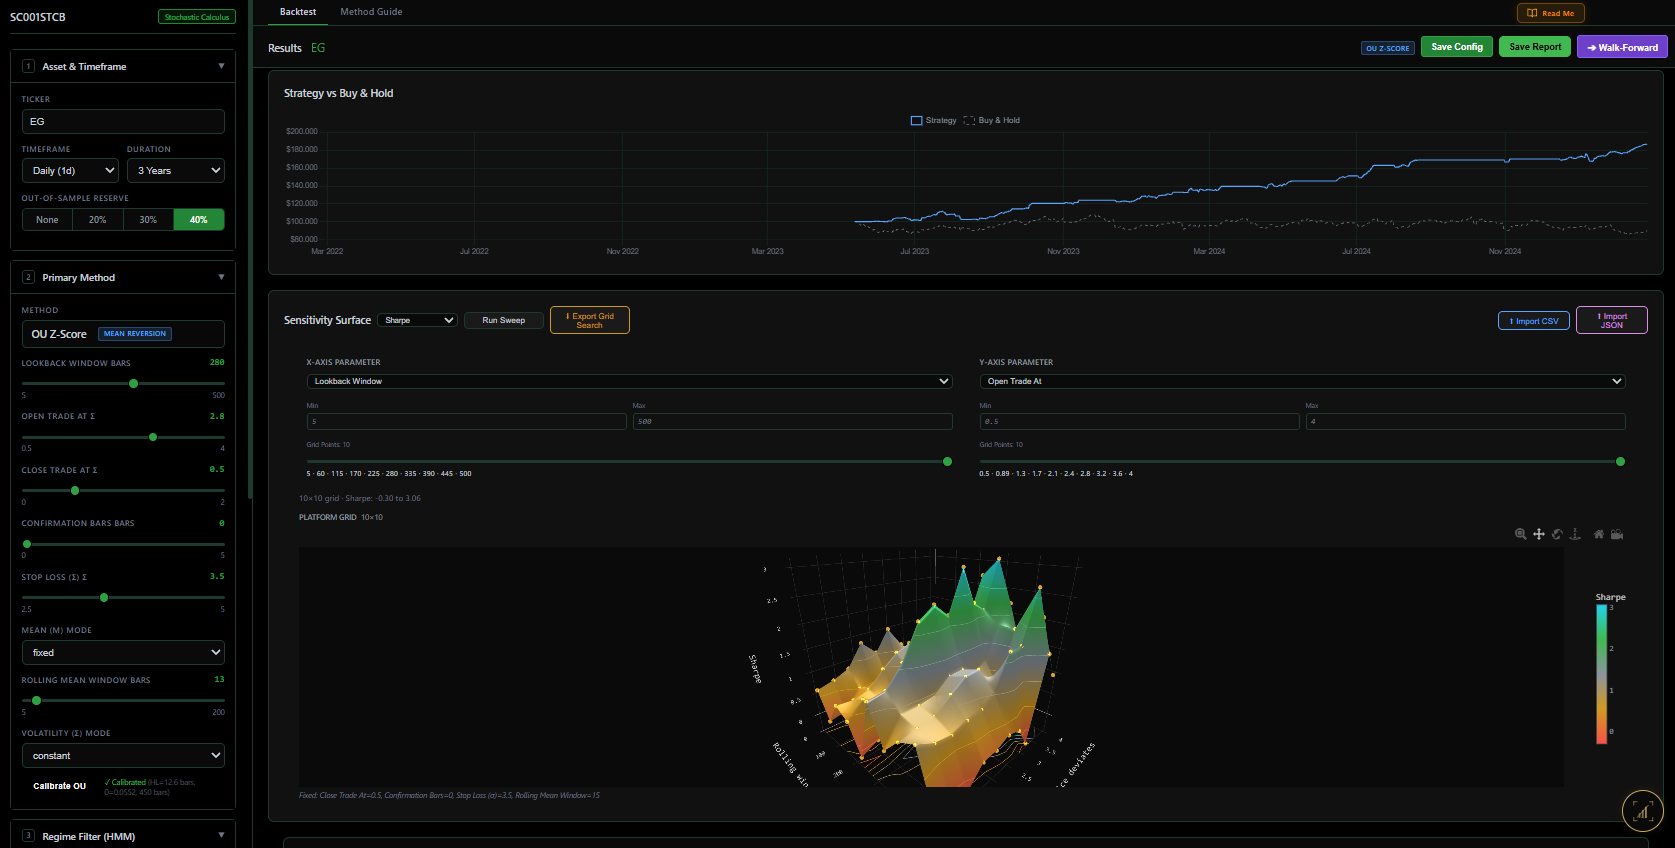
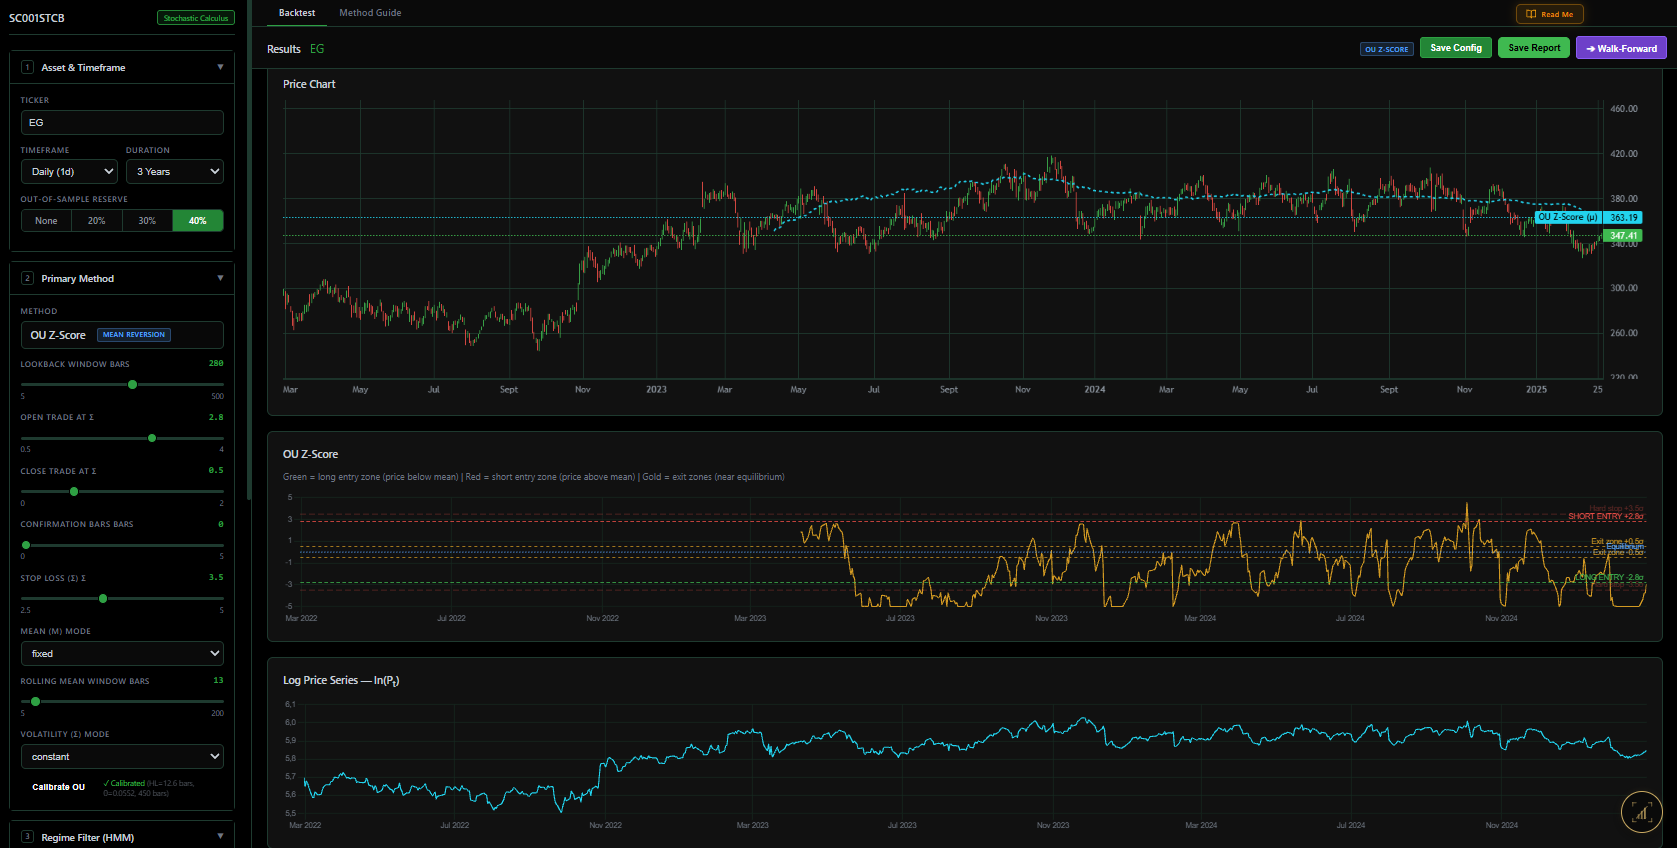
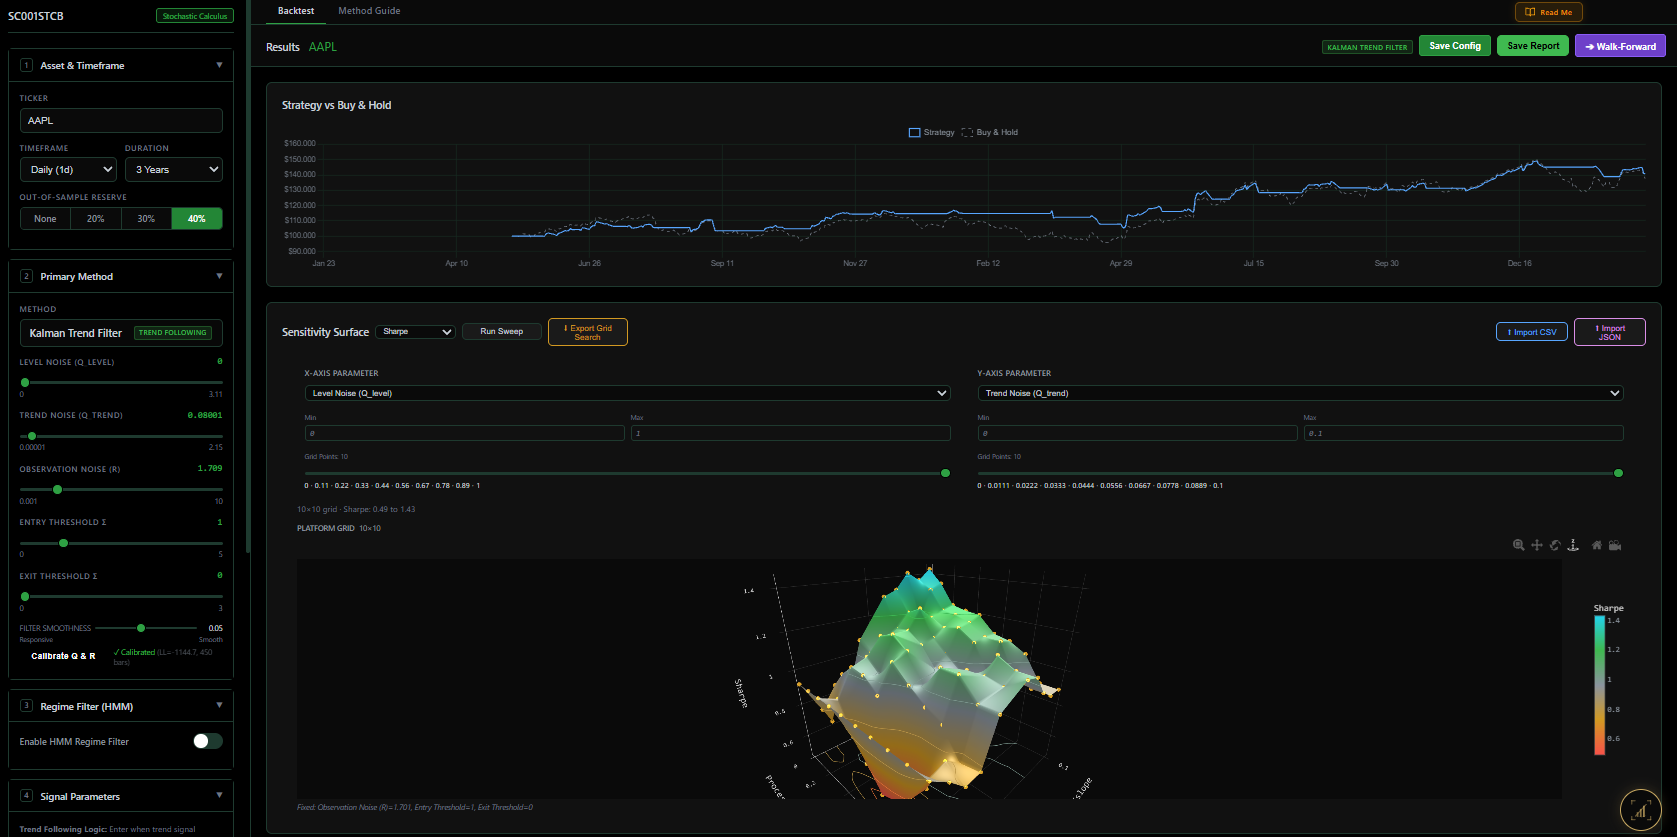
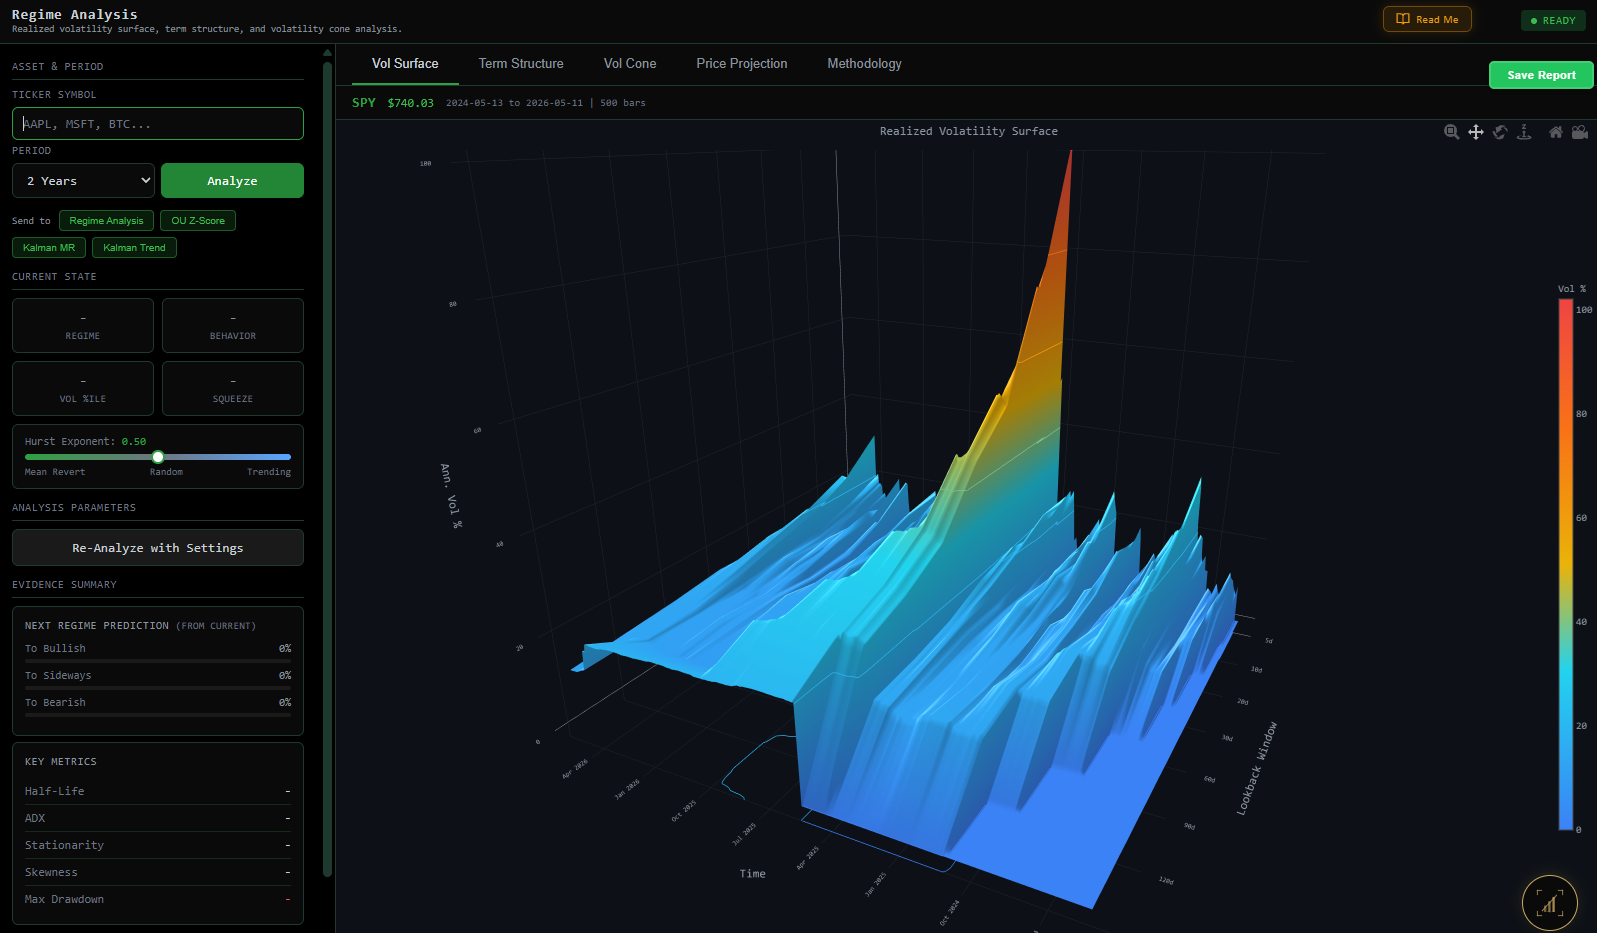
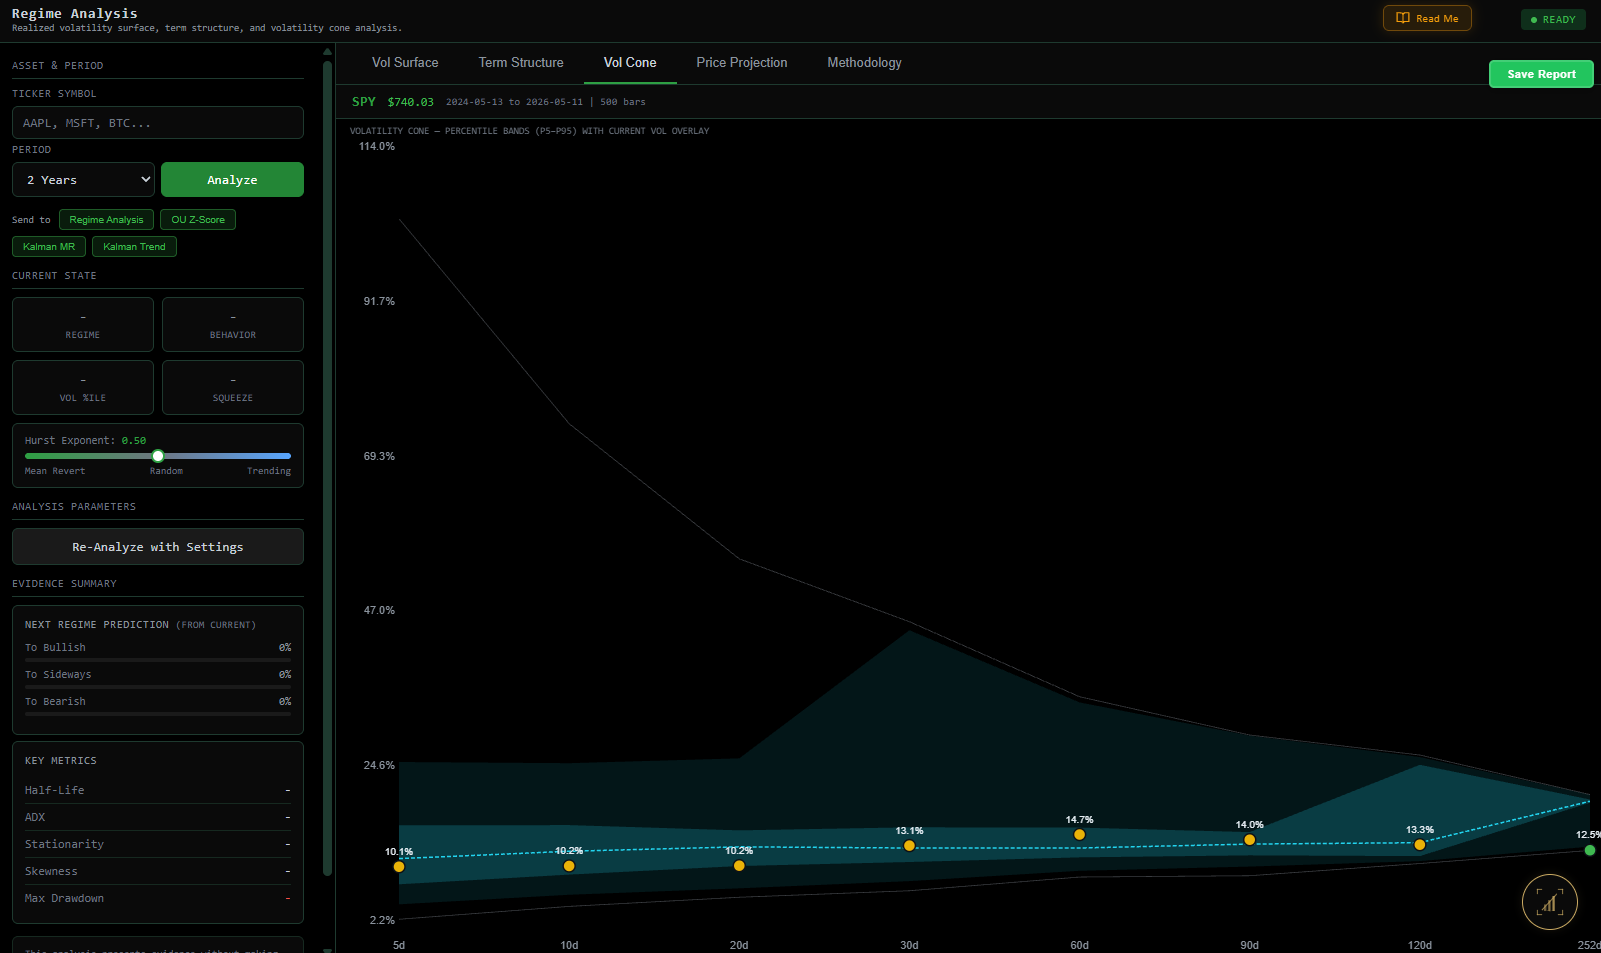
Fit a model to how a price, or the gap between two prices, moves, and trade when it strays far from what the model expects.
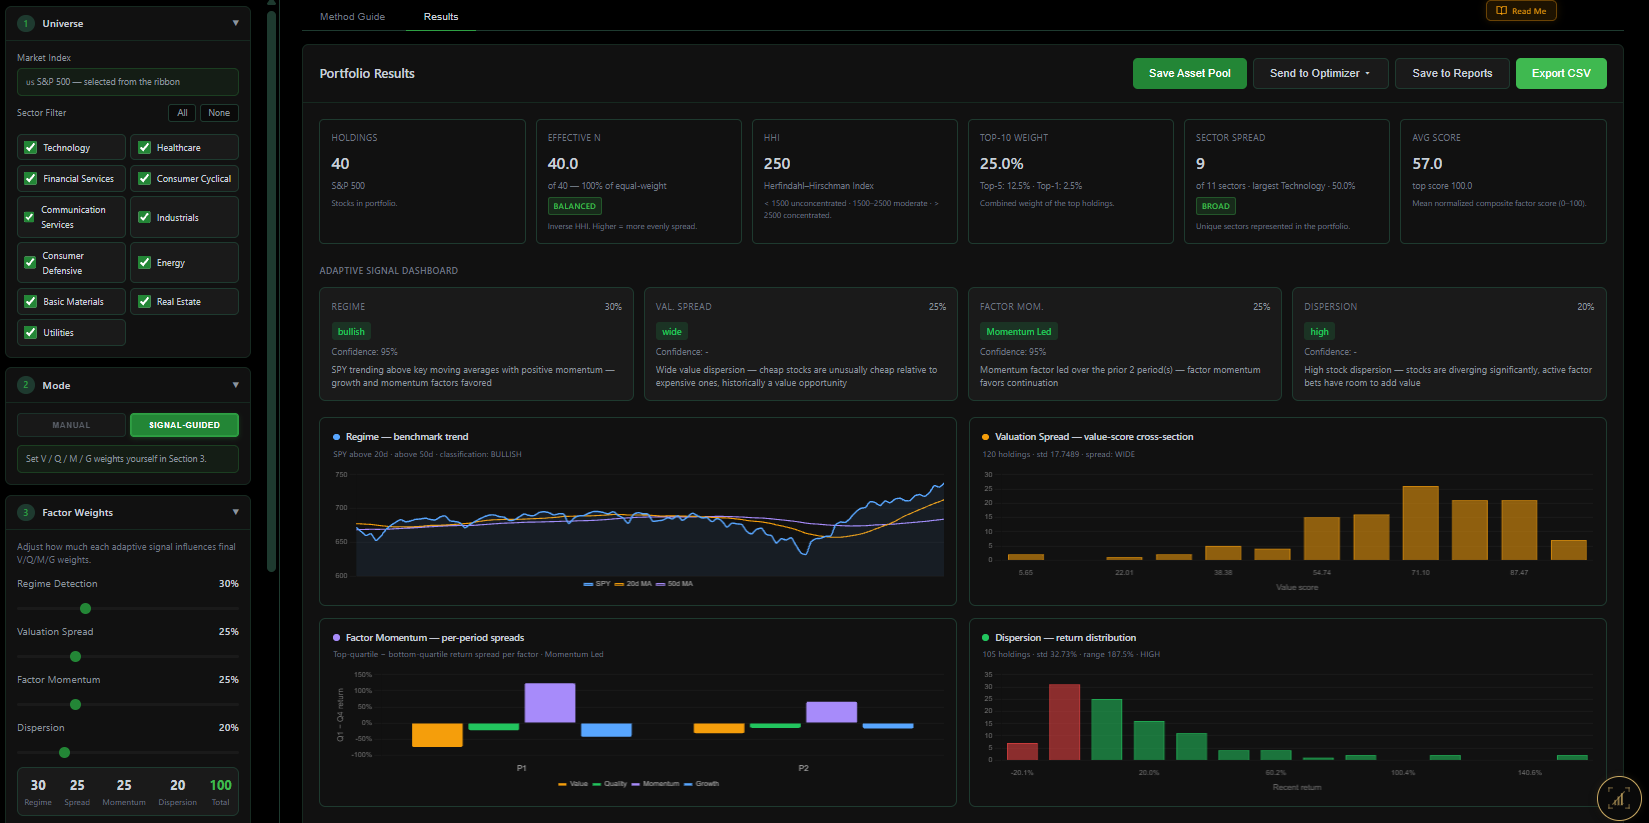
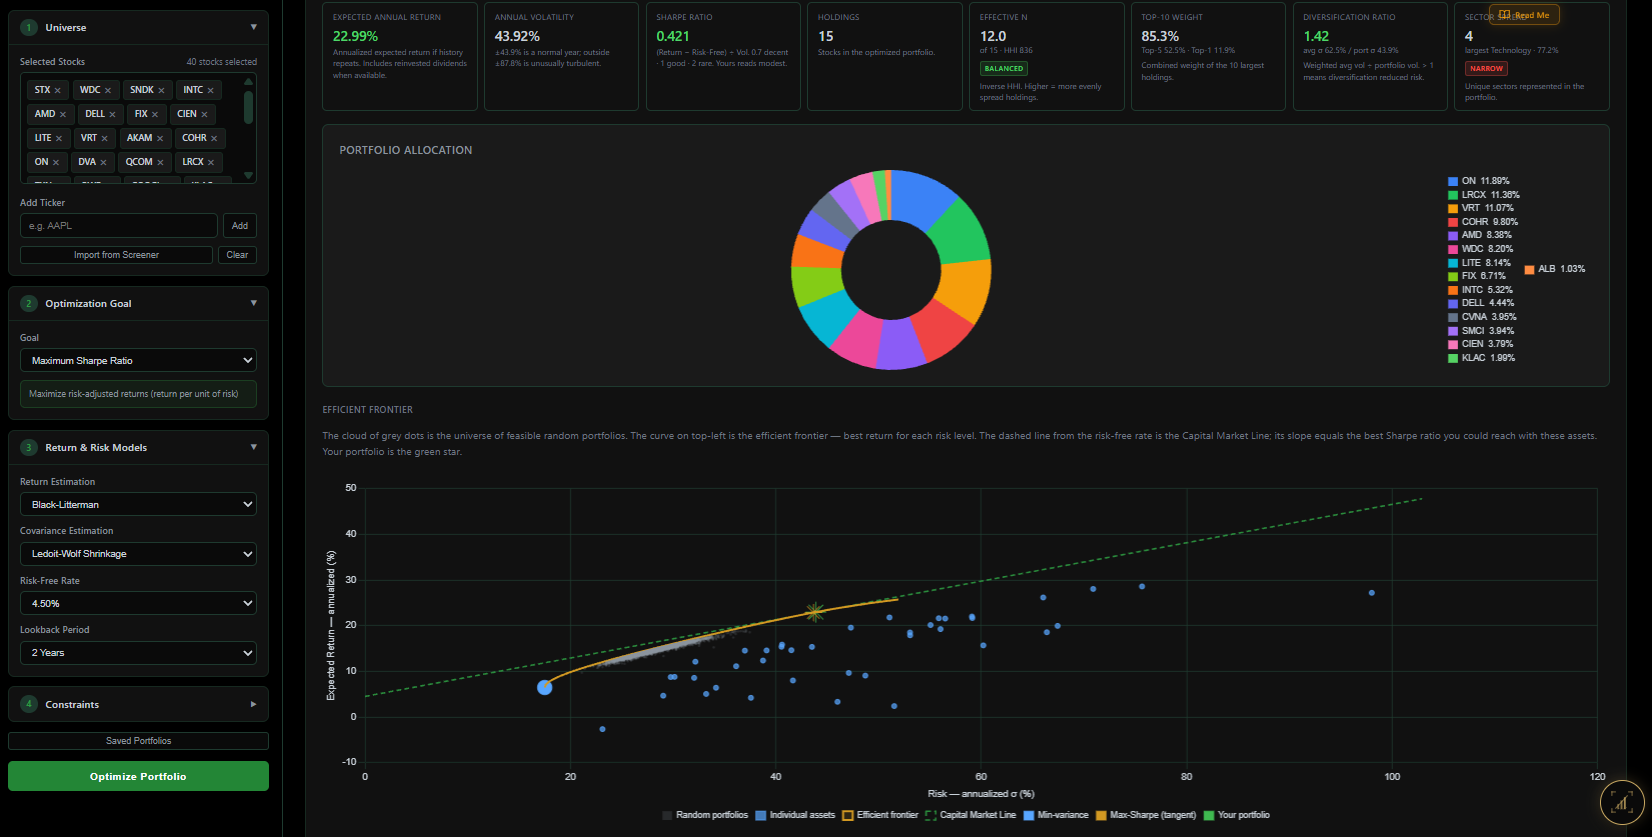
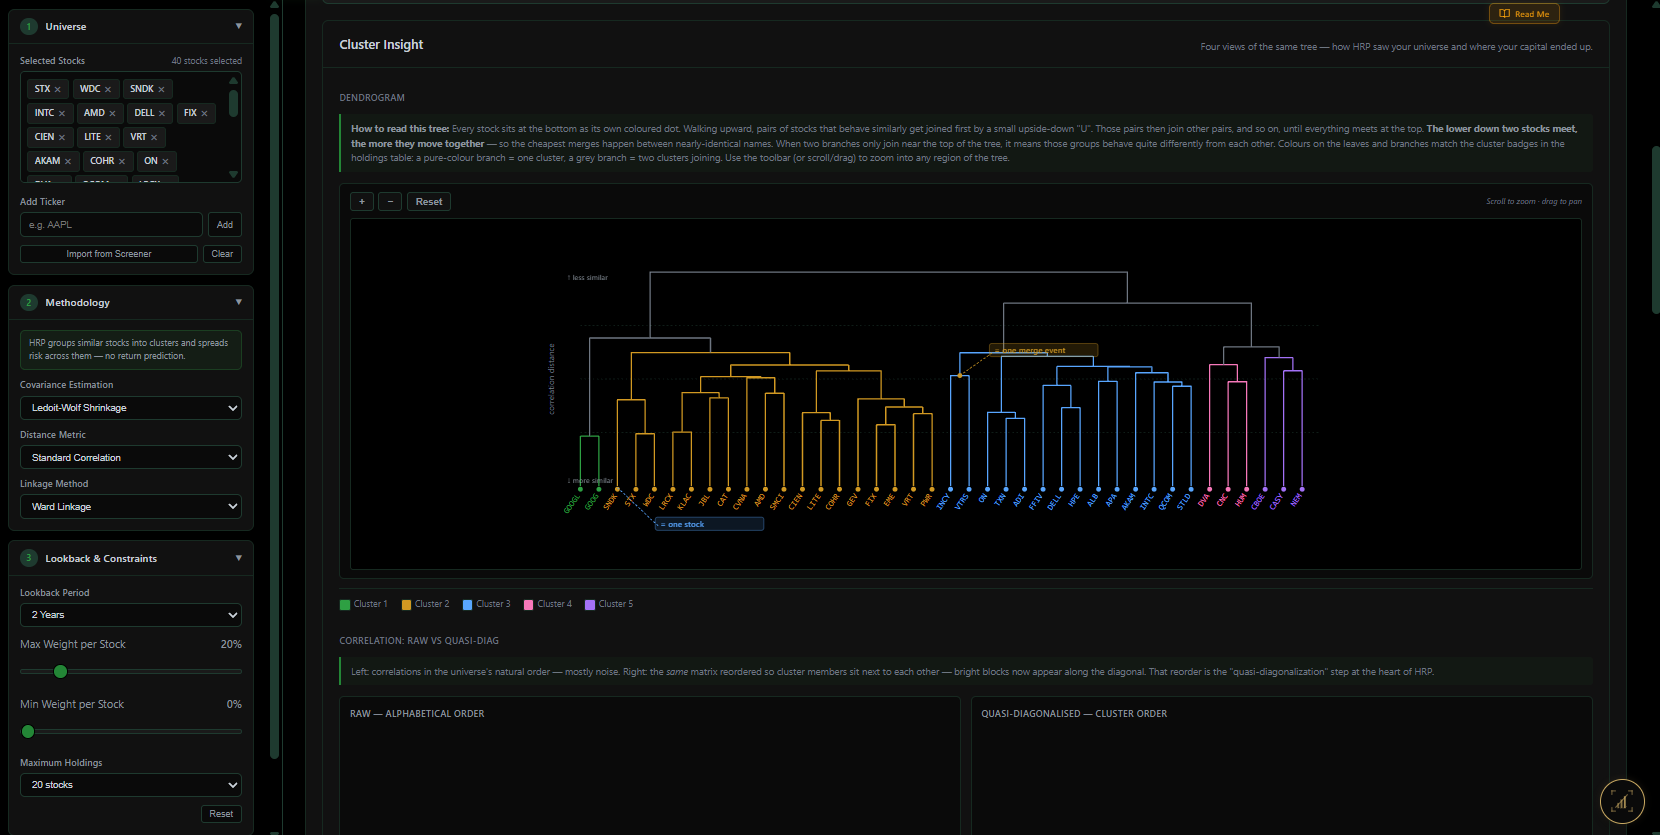
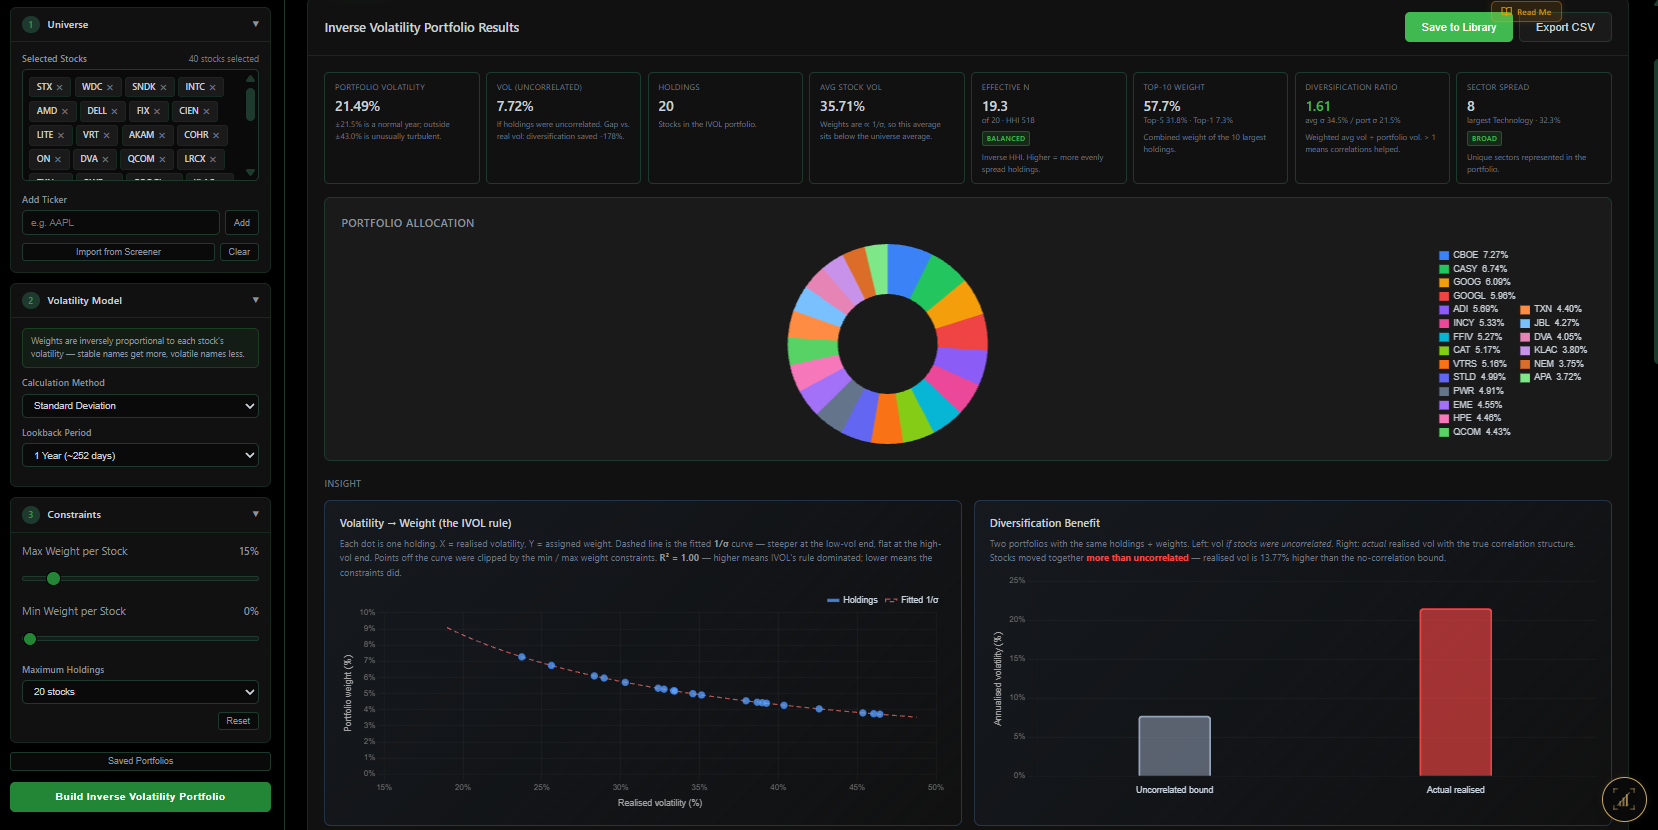
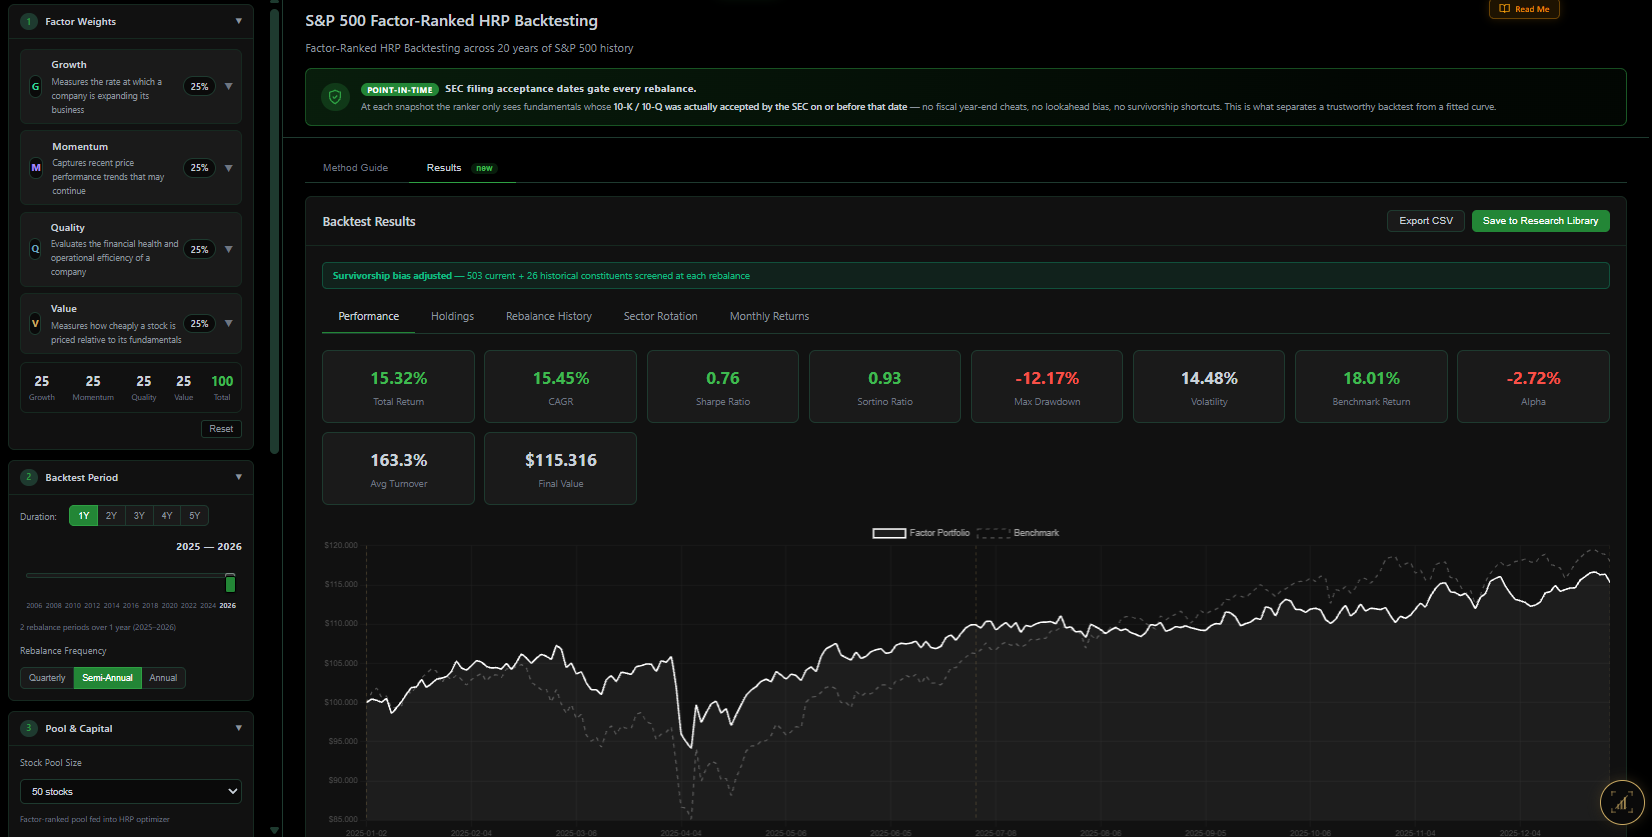
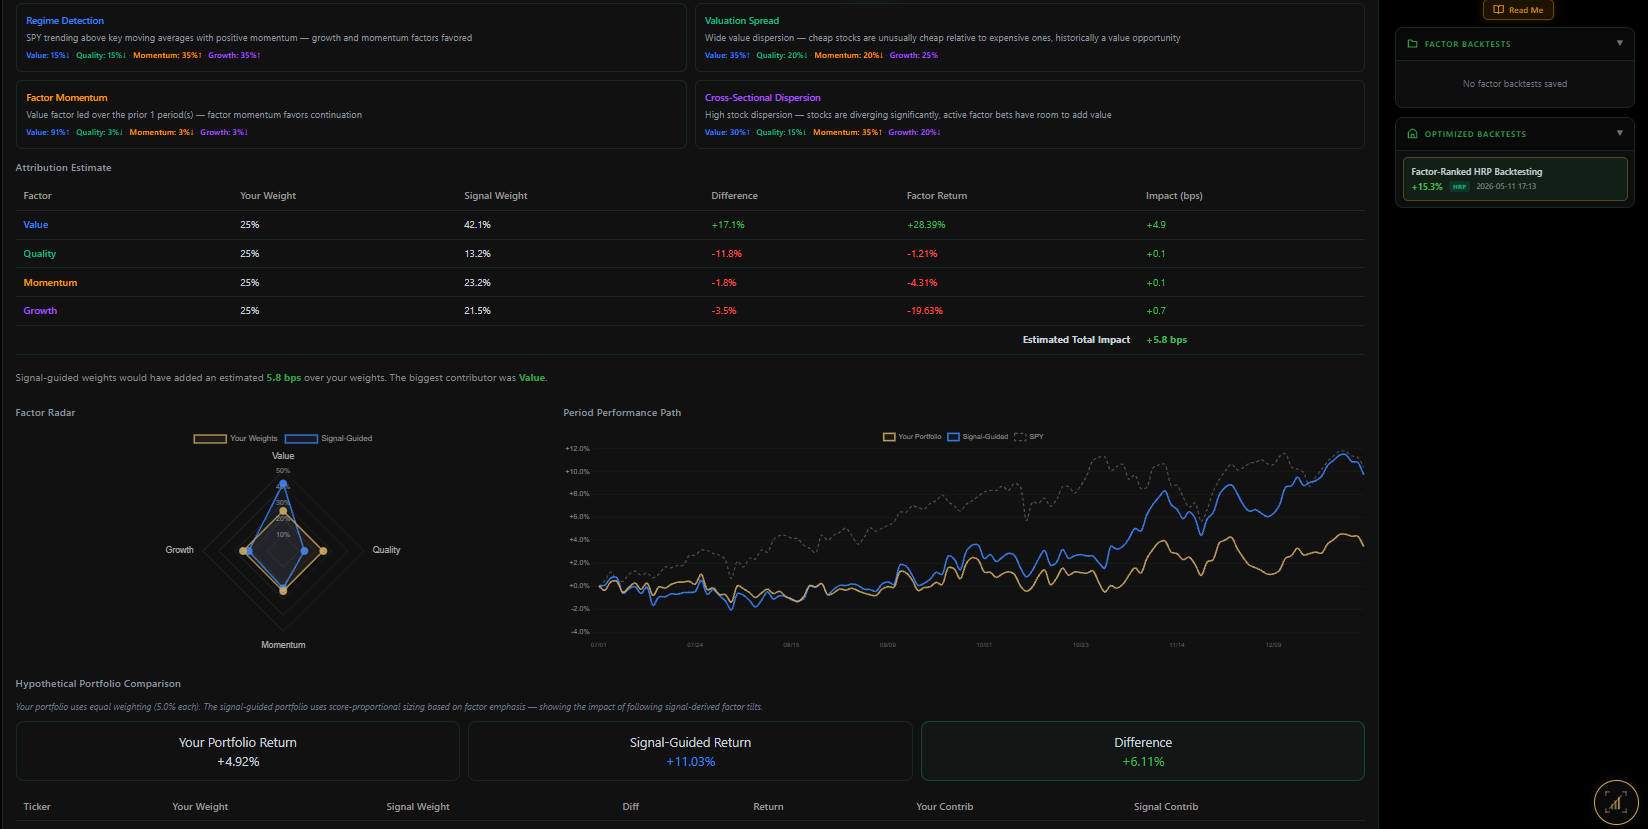
Rank the stocks of an index on traits such as value or momentum, hold the best as a portfolio, and see which trait carried the result.
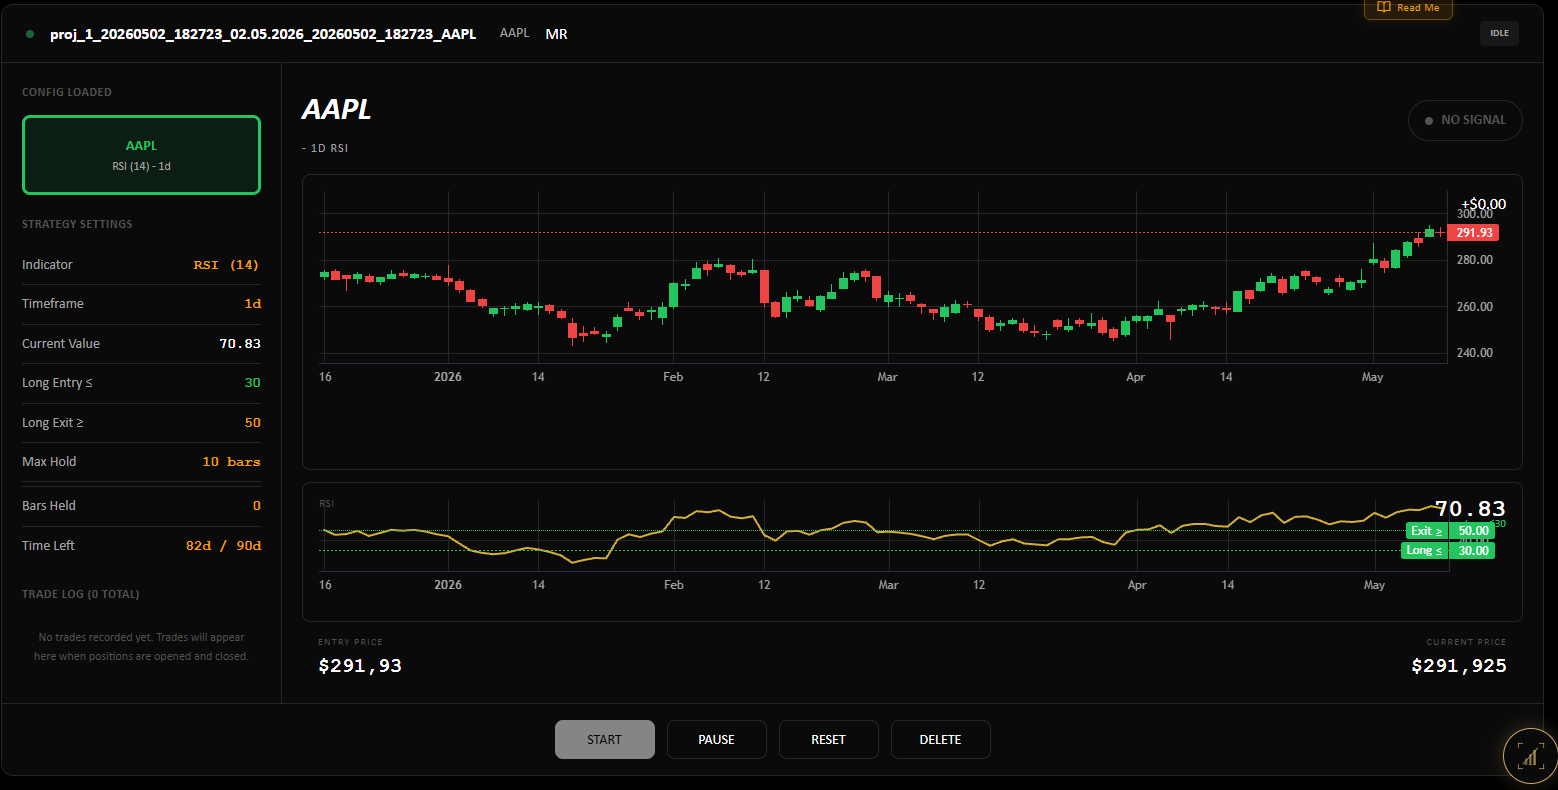
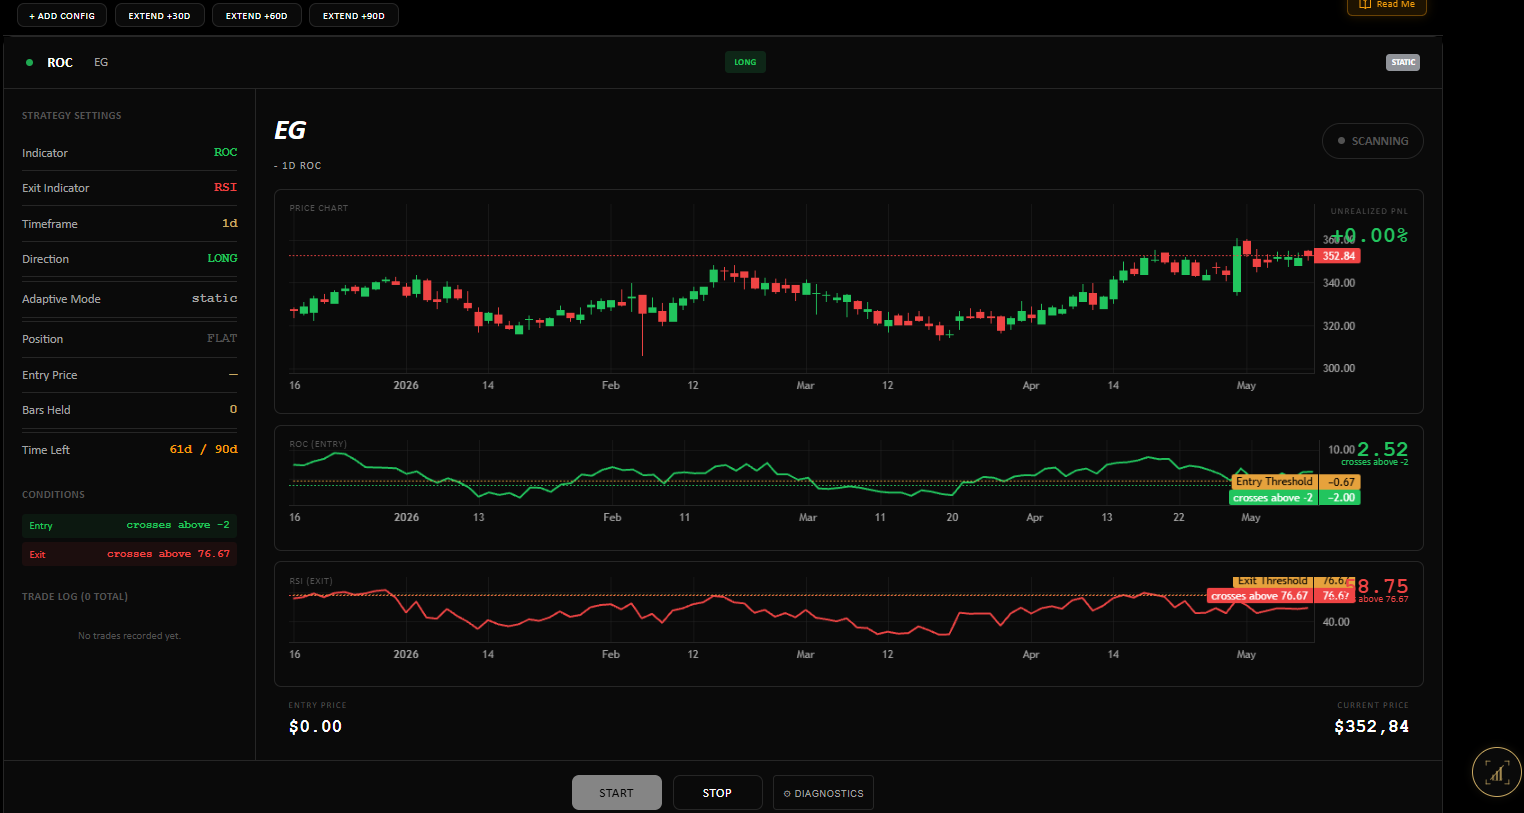
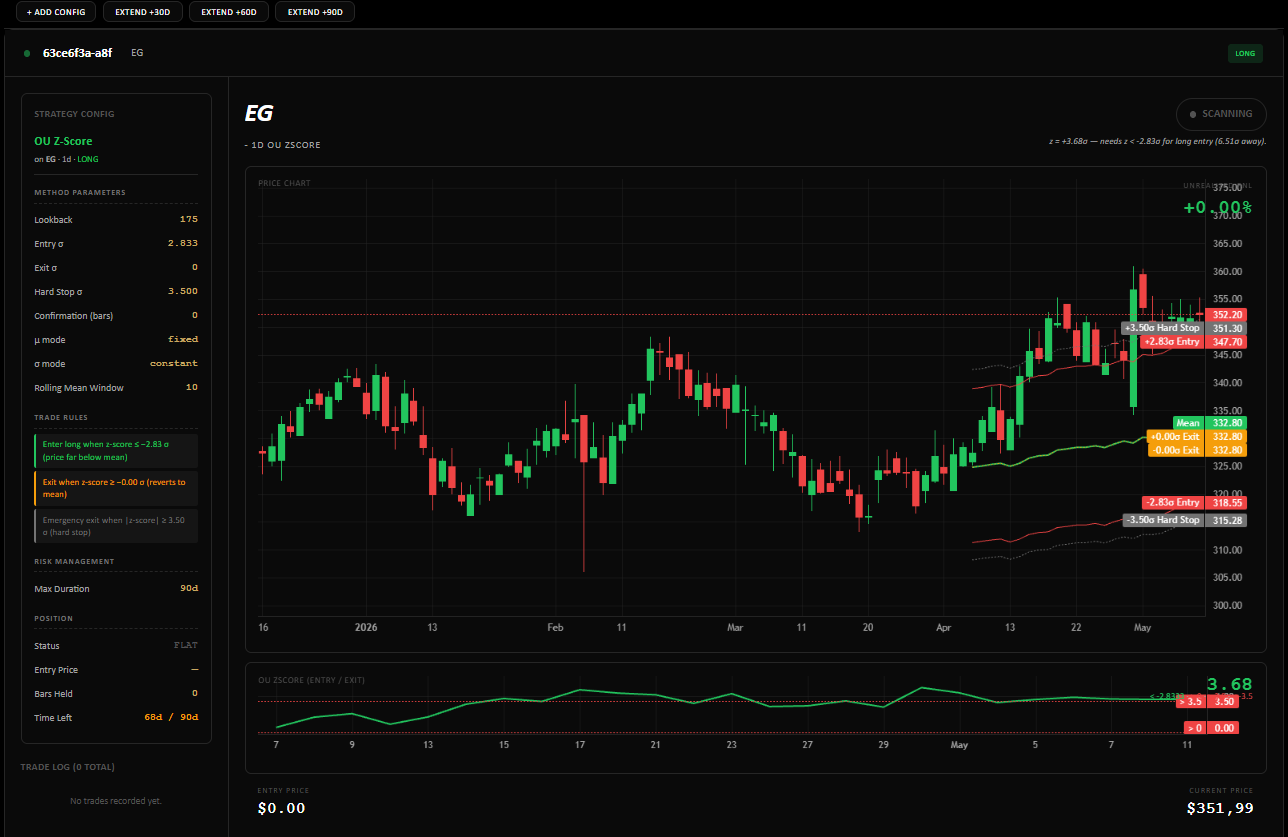
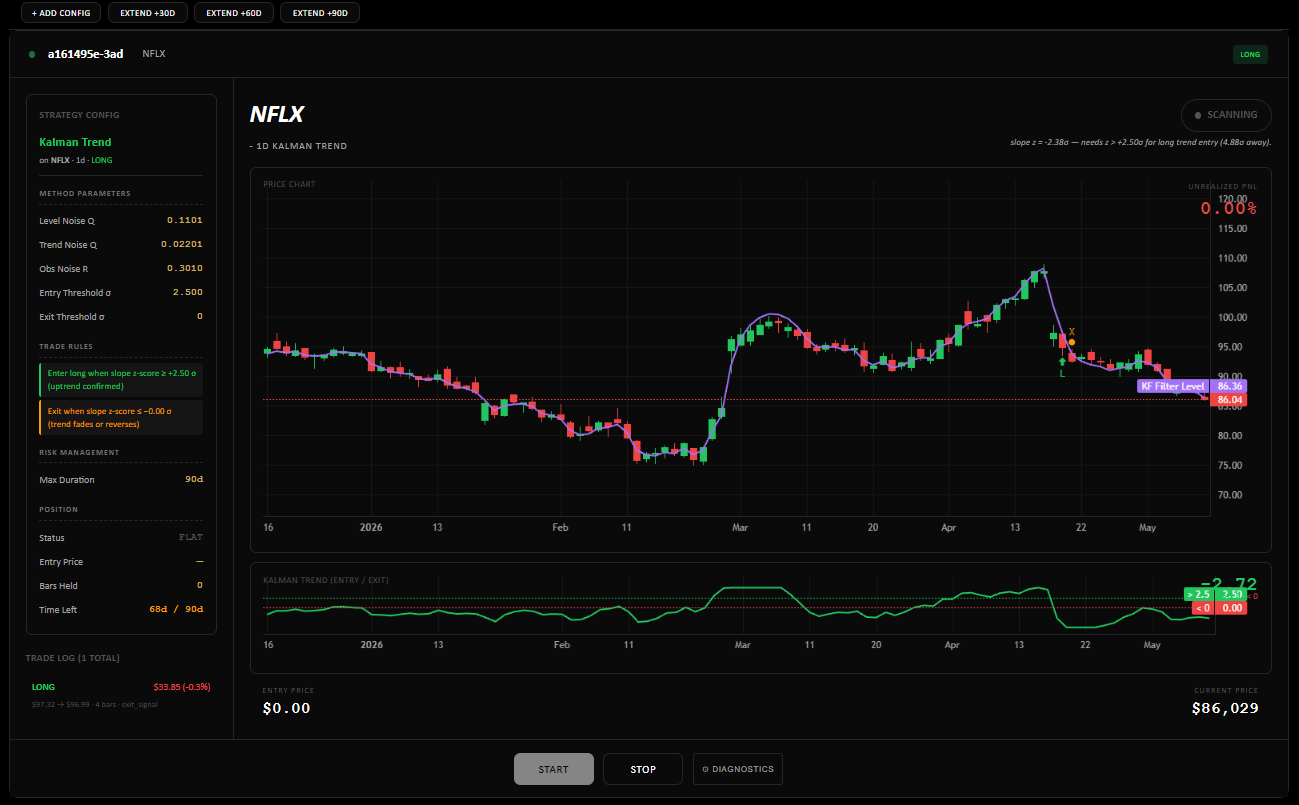
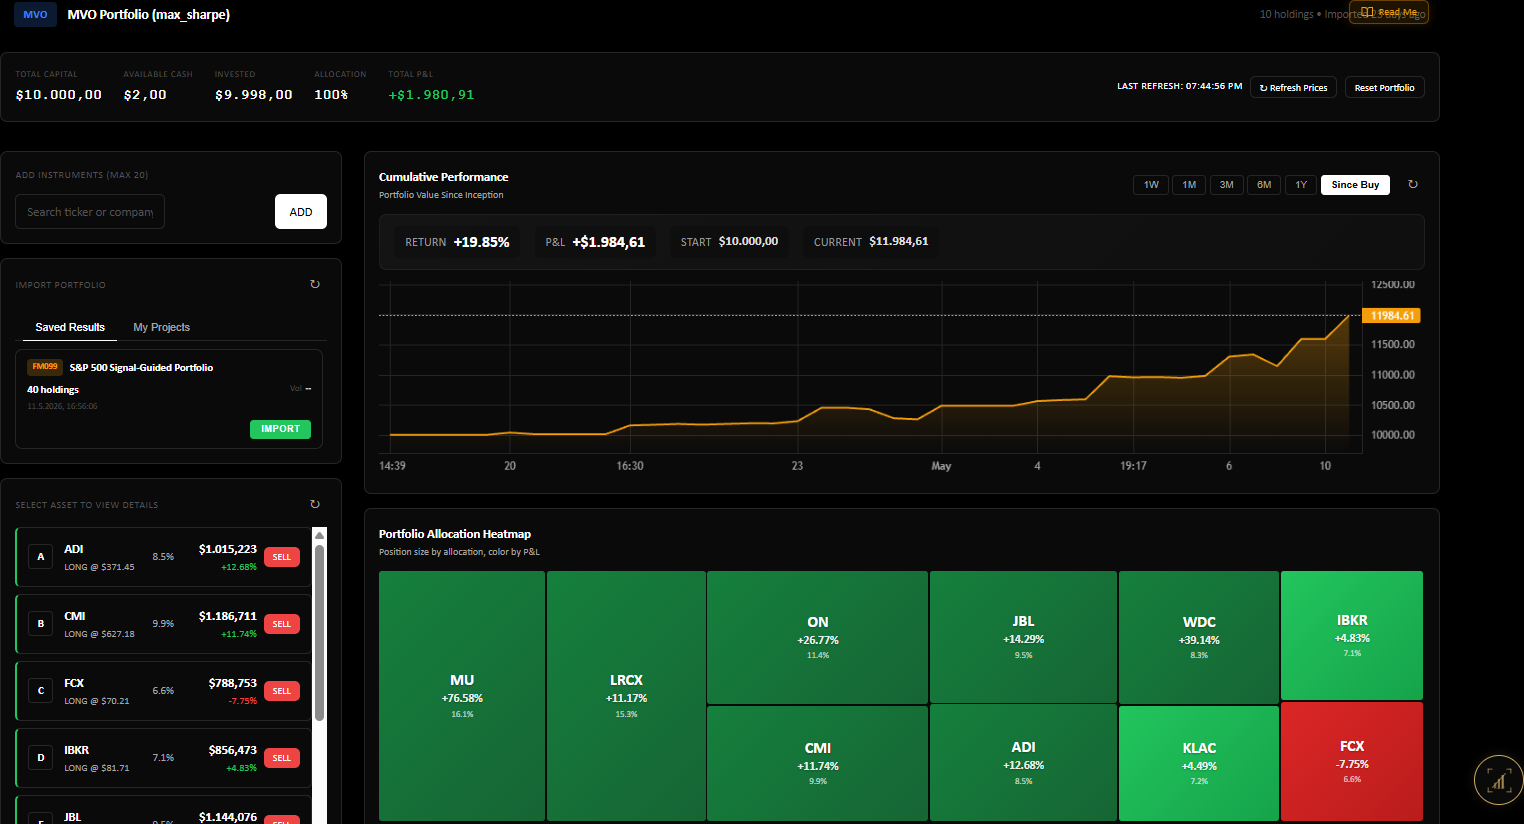
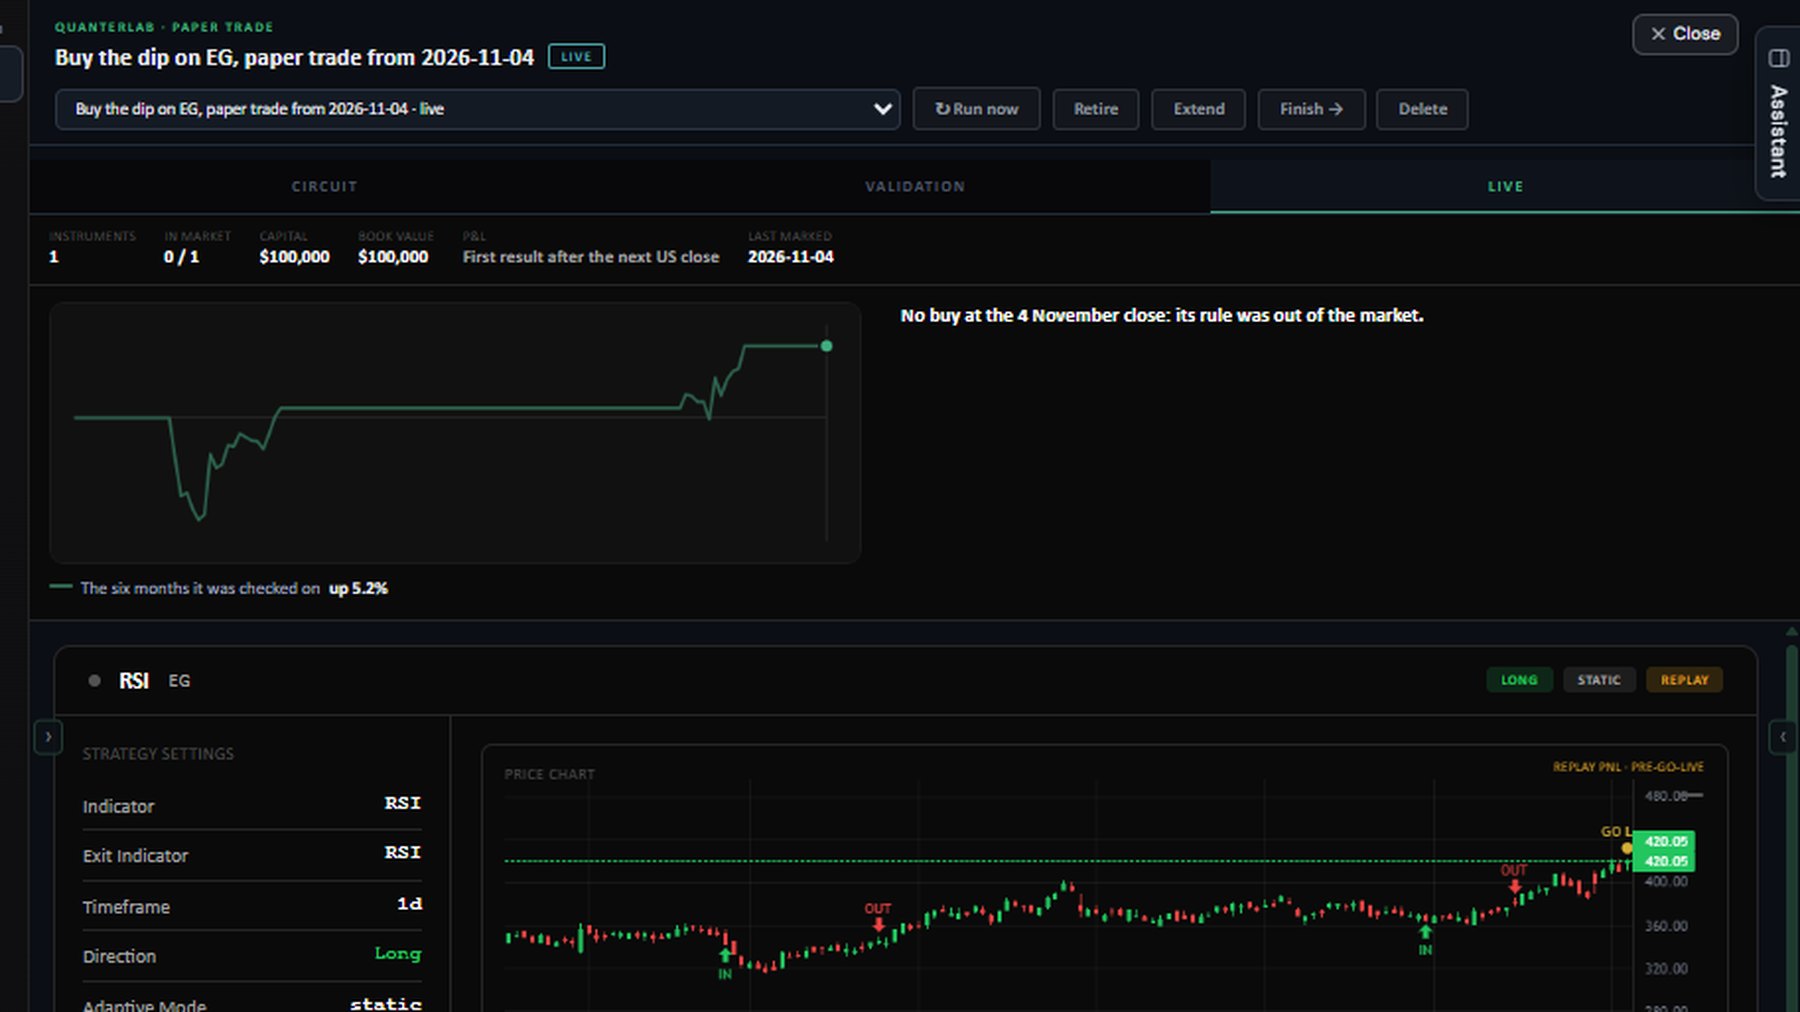
Follow a strategy forward on paper, marked once a day after the US market closes, to see whether it keeps doing what its test showed.
Pin a virtual today and the platform replays history forward, bar by bar. The strategy sees only what was knowable then. The question isn't whether you were right about one crash; it's whether your methodology holds up when reality unfolds, and where it breaks.
Only what existed on the pinned date is visible: universe, constituents, filings, prices. Acting twenty years ago, not fooling yourself with today's survivors.
Build with what was knowable. Replay forward bar by bar: pure methodology, no hindsight in the design.
Articles that explain why, not just how. Method deep-dives, conceptual explanations, terminology breakdowns, each grounded in real academic sources you can chase down.
QuanterLab is software built for quantitative research, and these studies are what it produces. Each one seals its hypothesis before anything is scored, sees only what was knowable on each date, and has to clear the platform’s checks before it publishes. Free to read, no account needed.
| What | Starter | Practitioner | Research |
|---|---|---|---|
| In the lab | |||
| Build and run your own circuits | Yes, with the Starter cards, on a ticker, a basket or the NASDAQ-100, and portfolios held at the weights you set | Every card but the Research ones, on every index | Every card |
| A published study's own circuit, its settings changed | 3 runs a day | No daily count | No daily count |
| Walk, write up and publish a research study | No | No | Yes |
| The platform's modules | |||
| Paper trading in the Basic, Advanced and Stochastic lanes, marked once a day after the US close | No | 10 per lane | 20 per lane |
| In ChatGPT and Claude | |||
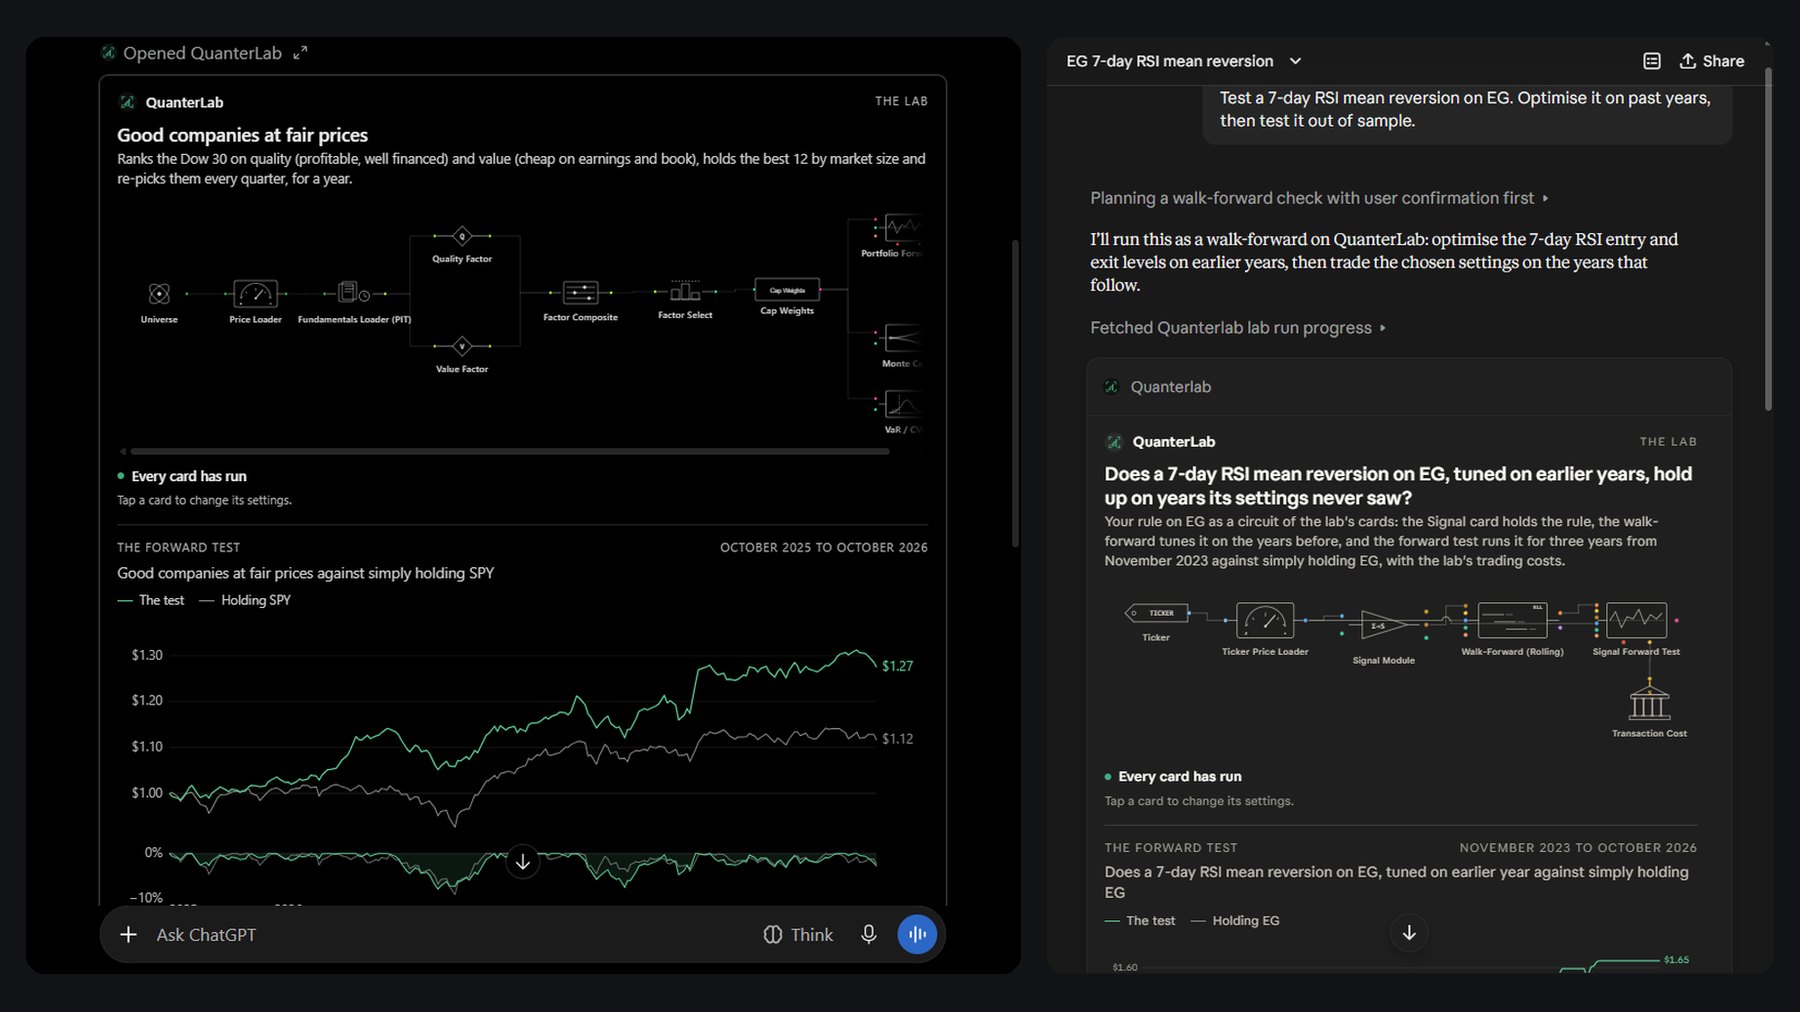
| Runs: backtests, walk-forwards, scans, stochastic methods, regime analysis and your saved lab circuits | Runs every day, of anything an assistant can start | Each kind up to its daily cap: 50 backtests, 50 stochastic-method backtests, 10 walk-forwards, 10 lab circuits, 30 mean-reversion scans, 15 pairs scans, 20 regime analyses, 10 regime optimisations | The same caps |
Every account starts with 30 days of Practitioner, free, with no card. After them, a plan, or the account is read-only: it keeps its saved work and reads every study, and runs nothing.
Anyone can create an account. The research stays free to read.
Dated walk-forward studies with registered hypotheses, point-in-time universes, and every attempt on the record. The papers are free to read, and they stay free. Subscribe and we'll email you when a new one publishes.
We've sent a confirmation link; open it and you're on the list. Nothing goes out until you confirm. (Check spam if it's not there in a minute.)
Reading the research needs no account; creating one is free.
Sign up for free →What QuanterLab is, and where to start
Hi. I can tell you what QuanterLab is, what you can do here without an account, and where to start.
Quantin is an AI model and can be wrong. Your questions go to Anthropic to be answered, and we keep nothing. Research, not investment advice.