
Does the Piotroski F-score have anything to find among large caps? The score and each of its signals tested alone on the S&P 500
Piotroski's F-score is the screen every value investor has run: nine yes-or-no questions on the last two annual statements, a point for each yes, buy the eights and nines. Piotroski (2000) built it for the cheapest fifth of the market by book-to-market, where a positive return on assets was information and the high scorers earned 7.5 percentage points a year more than the group between 1976 and 1996, with the gain in small firms nobody followed. Screeners run it on the S&P 500 today, whose names are large, followed and rarely cheap.
The checks people post run it on today's copy of the statements, restatements included. A buyer on a given day had only the reports the SEC had accepted by then, so that is what the score is built from; for a late filer that is last year's pair.
The S&P 500 is the opposite of Piotroski's sample on both counts that mattered to him, cheapness and the absence of anyone watching, so I expected the score to weaken. What I wanted to see was where it went: whether the whole score goes flat, or some of its nine questions still separate names once the rest have stopped.
I scored every member of the S&P 500 on each first of July from 2000 to 2025 and registered sixteen walks of 26 one-year windows, each a book against every scored member: the high scorers (8 or 9), the low scorers (0 to 3), the perfect nines, each signal's passers alone, and the high and low books again with financials out and again inside the cheapest fifth, Piotroski's own setting. Each window holds the book a year, equal weight, ten basis points each way. Beside the walks sit a census of the score and, as no fund tracks the F-score, three quality funds.
The high scorers did not beat the index they were drawn from. They trailed every scored member over the 26 windows, and in the decade from 2010, where the statements cover almost the whole index, they were ahead in one July of ten with one tied. Inside the cheapest fifth, the fifth beat the whole index while the high scorers inside it did not beat their own fifth. The value half of the recipe shows up in the S&P 500 and the score half does not. The low scorers appear to lead, and the lead is two windows wide: without July 2020 and July 2025 the two books finish level. Of the nine signals one is clear of noise and it points the wrong way. Names whose current ratio rose trailed every scored member, with about one chance in a hundred of having been the better book.
The census says why the rest are noise: the four level signals pass for 75 to 97 percent of S&P 500 names, so a score is decided by five change signals that pass about half the time and do not carry over; a nine this July averages 6.3 the next.
From 2016 the two large-cap quality funds kept pace with SPY and the high book trailed them; none of their screens uses the current ratio. The score was built to find survivors among cheap small firms; on an index of large ones its questions are already answered, and what is left is a year's change.
The nine signals and the books
Piotroski's score asks nine questions of a company's last two annual statements, a point for each yes. Four are about the level of this year's numbers: is the return on assets positive, is the cash flow from operations positive, is that cash flow above the earnings (so the earnings are not made of accruals), and did the company avoid issuing shares. Five are about change on the year before: did the return on assets rise, did the debt ratio fall, did the current ratio rise, did the gross margin rise, did the asset turnover rise. Nine yes answers is the best score; Piotroski called 8 and 9 high and 0 and 1 low. Table 1 lists the nine with how often each passes in the S&P 500.
The signals are computed as he defined them, with one deviation named. He counted any share issuance against a firm; a large company issues a small amount to employees every year, so here the signal fails only when the cash raised from stock issued exceeds the cash spent buying it back, from the cash-flow statement. The debt ratio is long-term debt over average assets and must fall; equal counts as no. A signal whose inputs the vendor's statements do not carry scores zero and is counted: 246 of 10,973 name-years on the current ratio and 28 on the gross margin, banks and insurers. Most financials carry the vendor's current assets and liabilities and are scored on all nine, which is one reason the financials-out walks exist: a bank's current ratio and gross margin are the vendor's constructions, not the company's.
Point in time. The score at each first of July uses the latest annual statement the SEC had accepted on or before that day and the annual statement before it, from the vendor's acceptance dates (the filing date when acceptance is missing, the period end plus 45 days when both are). A statement older than 550 days at the anchor is not used, so a company whose report is late is scored on last year's pair or not at all. This is the score a buyer could have computed that morning, with restatements excluded because they did not exist yet.
The books. High is 8 or 9. Low is 0 to 3, widened from Piotroski's 0 and 1 because the S&P 500 holds almost no zeros and ones: 25 name-years scored 0 or 1 in 26 years against 398 scoring 2 or 3. The perfect nines are 9 exactly, and each signal has a book of its passers. Every book is set against the same reference in the same window, every scored member of the index bought the same way, so each walk asks whether the book did better than buying all of them. Piotroski's own numbers, 7.5 points a year over the cheapest fifth and 23 percent a year long-short, come from a different test, a spread inside that fifth with the low scorers sold short; this paper's test is each book against every scored member of a large-cap index, long only, so the two sets of numbers are not set against each other. Two more cuts run the high and low books again: with Financial Services and Real Estate out of both arms, and inside the cheapest fifth of the scored members by book-to-market at the statement's fiscal year end, the setting the score was published for, with the window floor lowered to five names because that fifth holds 10 high scorers a year on average.
How a window is traded. Buy every name of the book equal weight at the anchor close, hold to the same day a year on, reinvest each dividend into the paying name on its ex-date from the payment record, pay ten basis points on every name at entry and at exit. A name that stops trading marks flat at its last close and is sold there. A window with fewer than ten names in the book (five in the cheapest-fifth walks) is excluded and counted, never filled. The benchmark drawn on the platform's figures is SPY with its distributions reinvested; the reference the paper argues against is every scored member, which is equal weight, and the two differ: equal weight returned 12.05 percent a year against 9.45 for SPY over the 26 windows, most of it from 2000 to 2009.
Table 1. The nine signals as scored here, and how often each passes in the S&P 500, by era
| signal | measure | passes when | as Piotroski wrote it | 2000 to 2009, % | 2010 to 2019, % | 2020 to 2025, % | all years, % |
|---|---|---|---|---|---|---|---|
| 1 return on assets positive | net income opening assets | above zero | same | 90.1 | 92.8 | 92.6 | 91.7 |
| 2 cash flow positive | cash from operations assets | above zero | same | 94.8 | 97.8 | 97.4 | 96.5 |
| 3 return on assets up | return on assets | above the year before | same | 51.7 | 51.5 | 49.4 | 51.1 |
| 4 cash flow above earnings | cash from operations vs net income | cash flow the larger | same | 87.0 | 89.7 | 86.2 | 87.9 |
| 5 debt ratio down | long-term debt average assets | below the year before | same | 51.5 | 50.5 | 54.3 | 51.8 |
| 6 current ratio up | current assets current liabilities | above the year before | same | 48.7 | 46.7 | 46.5 | 47.5 |
| 7 no net share issuance | stock issued minus repurchased | not positive | any issuance fails | 67.1 | 79.2 | 83.0 | 75.1 |
| 8 gross margin up | gross profit revenue | above the year before | same | 46.5 | 51.9 | 50.9 | 49.7 |
| 9 asset turnover up | revenue opening assets | above the year before | same | 50.1 | 47.5 | 51.6 | 49.3 |
1 Methodology
Universe. The S&P 500's membership on each first of July from 2000 to 2025, rebuilt from the index's change log, 13,046 member-years. I built the tables twice. The first build guarded against reused tickers by each name's listing date at the vendor, which threw out every company that had gone through bankruptcy and relisted, Peabody, Chesapeake and Diamond Offshore among them, so the second build uses the engine's own rule instead: a ticker the vendor has since reassigned to another company is refused before its reuse, 39 member-years, and no name is scored on another company's statements.
Statements. The vendor's annual income statement, balance sheet and cash-flow statement per company, merged by fiscal period end into one record a year; a record's acceptance date is the latest of its three statements' acceptances, so all three are public before the score is. The score at an anchor needs a current record accepted by the anchor and not older than 550 days, and a prior record 270 to 460 days before it; a third record before that supplies the year-before return on assets and turnover when it exists. The tables were built once on the production engine and frozen; the two study nodes read them and never the network.
Coverage. At each anchor the membership splits into the scored, the names with statements at the vendor but no accepted pair by the anchor, and the names with no statements at the vendor at all. Over the 26 anchors: 10,973 member-years scored of 13,046, 861 with statements but no accepted pair, 1,173 with no statements. Figure 2 and Table 2 carry it by year.
The census. For every scored name-year: the nine bits and the score; the pass rate of each signal by year and by era (Table 1); the mean score, the share scoring 8 or 9 and the share scoring 0 to 3 by year (Table 2) and by the vendor's sector for 2010 on (Table 3); and persistence, the score of the same name a year later, for every name scored in two consecutive Julys (Table 4).
The walks. Sixteen registered studies, one per book, each of 26 one-year windows anchored on the first of July from 2000 to 2025, 416 windows in all, 56 of them excluded for a book under its floor and counted. Two arms in every window: arm A the book, arm B every scored member of the same cut, both bought equal weight at the anchor close and held a year with dividends reinvested, ten basis points one way on every name at entry and at exit. The platform pairs the two arms date by date inside each window and tests the difference: a seeded circular block bootstrap of the mean daily difference, blocks of ten bars, 2,000 paths, 6,524 pairs over the 26 windows of a whole-index walk, gives the probability that A beats B; the paired Sharpe is that mean difference over its standard deviation, annualised. One pre-registered contrast per walk, so no deflation is applied. Two bases appear in the paper and are kept apart: window returns and CAGRs are the run reports' own, from the anchor close; windows led are counted on the platform's paired rows (Table 10), which pair the arms from the bar after the anchor and print returns to a tenth, so a window whose arms differ by under a tenth of a percent is a tie. The sixteen walks are declared as one family on the host, the high book against every scored member, and Figure 1 draws every one of them.
The two cuts. Financials out: the vendor's Financial Services and Real Estate sectors, as labelled today, leave both arms. The cheapest fifth: at each anchor the scored members are ranked by the inverse of the vendor's price-to-book at the scoring statement's fiscal year end, positive book only, and the top fifth is kept for both arms; it holds 55 names in 2000 and 94 in 2025, with the high book inside it at 7 and 14.
The funds, a measurement without a registration record. No fund tracks the F-score. Three funds screen on statement strength: QUAL (MSCI USA Sector Neutral Quality: return on equity, debt to equity, earnings variability, from 2013), SPHQ (S&P 500 Quality: return on equity, accruals ratio, debt ratio; the ticker carried a Value Line timeliness fund until 2010 and S&P's earnings-and-dividend quality rankings until 2016, so its record here starts in 2016) and QVAL (Alpha Architect's Quantitative Value: the cheapest names by operating earnings over enterprise value, screened on a financial-strength score built on Piotroski's signals, financials left out as in this paper's own cut, from 2014). Each is taken as total return with its distributions reinvested at the ex-date close from the payment record, on the walks' own windows from its first full July, beside the high book, every scored member and SPY from the run reports; Figure 3 chains the windows from July 2016, the first all three funds ran the screens they run today.
2 Results
2.1 Headline
This paper answers for a declared family of 16 sealed studies. 16 member walks are drawn as 32 lines (a comparative walk contributes one line per arm), each chained across its own out-of-sample windows, on one calendar axis, all rebased to 1× on the first session they share. 6 of them are shown to start, the ones the paper reads by; the others are switched off until their name is clicked. The paper’s own walk is the heavy line; the dashed grey line is the study’s own benchmark.
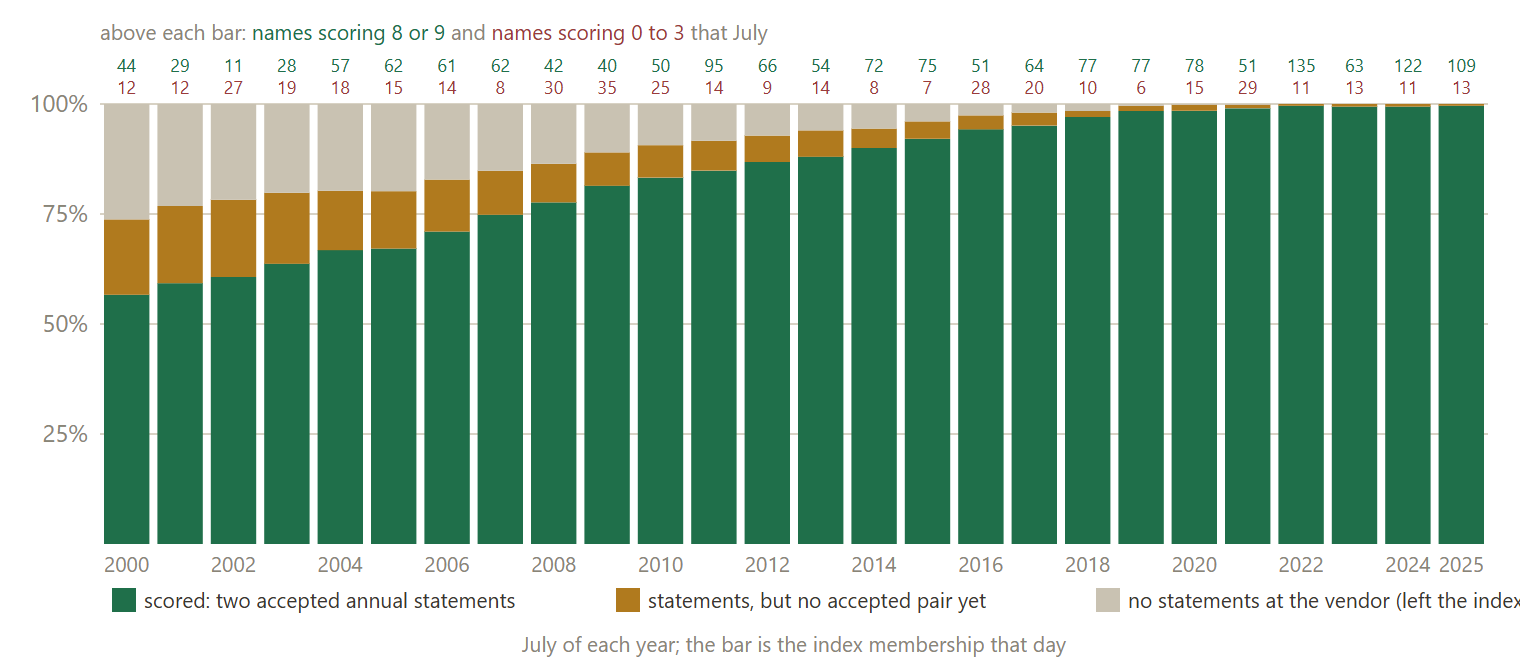
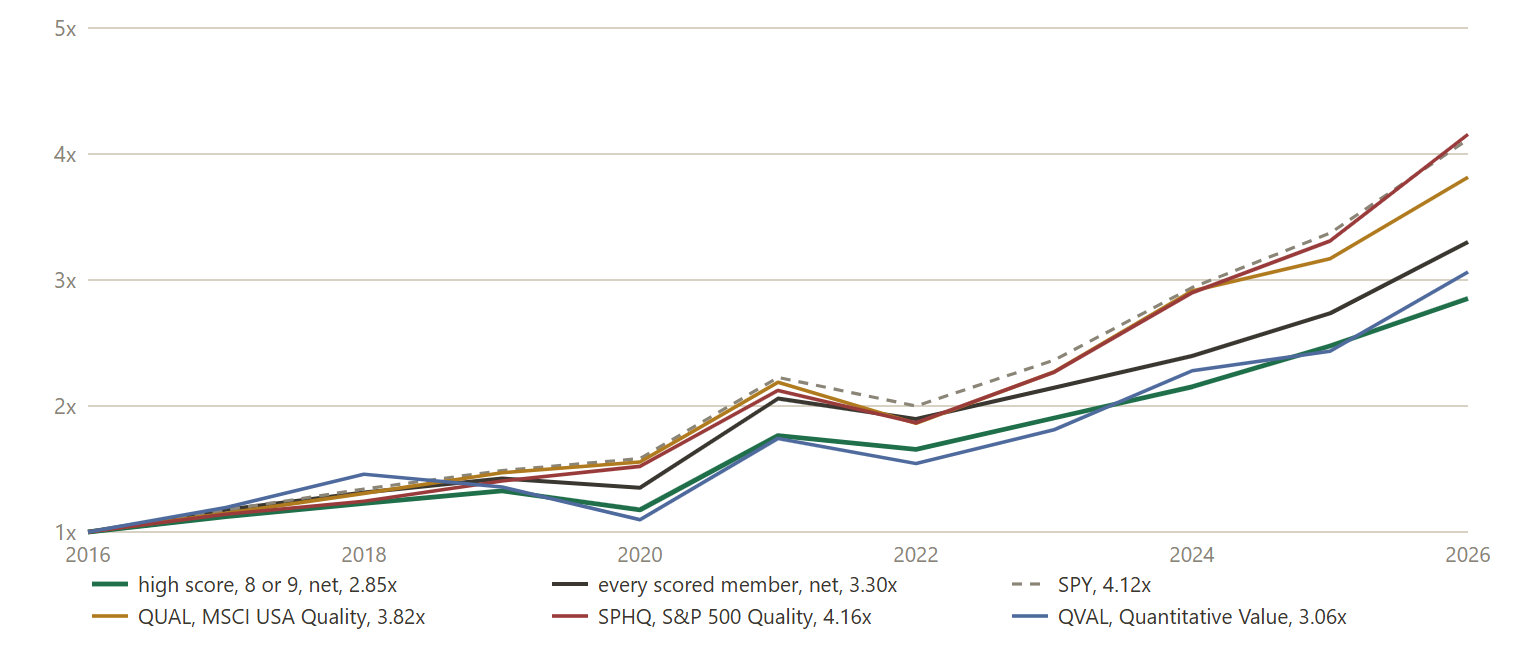
Table 2. Coverage: how much of each July's S&P 500 the vendor's statements can score (every other year; Figure 2 has all)
| July | members | scored | scored, % | statements, no pair | no statements | mean score | scoring 8 or 9 | scoring 0 to 3 | all nine |
|---|---|---|---|---|---|---|---|---|---|
| 2000 | 496 | 281 | 56.7 | 82 | 130 | 6.03 | 44 | 12 | 5 |
| 2002 | 496 | 301 | 60.7 | 84 | 108 | 5.18 | 11 | 27 | 1 |
| 2004 | 497 | 332 | 66.8 | 64 | 98 | 6.20 | 57 | 18 | 15 |
| 2006 | 500 | 355 | 71.0 | 56 | 86 | 6.06 | 61 | 14 | 12 |
| 2008 | 501 | 389 | 77.6 | 41 | 68 | 5.77 | 42 | 30 | 6 |
| 2010 | 501 | 417 | 83.2 | 35 | 47 | 5.74 | 50 | 25 | 9 |
| 2012 | 501 | 435 | 86.8 | 29 | 36 | 6.19 | 66 | 9 | 12 |
| 2014 | 501 | 451 | 90.0 | 21 | 28 | 6.15 | 72 | 8 | 8 |
| 2016 | 506 | 477 | 94.3 | 15 | 13 | 5.76 | 51 | 28 | 6 |
| 2018 | 506 | 491 | 97.0 | 7 | 8 | 6.22 | 77 | 10 | 19 |
| 2020 | 506 | 498 | 98.4 | 7 | 1 | 6.00 | 78 | 15 | 6 |
| 2022 | 505 | 503 | 99.6 | 2 | 0 | 6.59 | 135 | 11 | 26 |
| 2024 | 505 | 502 | 99.4 | 3 | 0 | 6.34 | 122 | 11 | 25 |
| 2025 | 505 | 503 | 99.6 | 2 | 0 | 6.25 | 109 | 13 | 20 |
Table 3. The score by sector, 2010 to 2025, name-years pooled (the vendor's sector as of today)
| sector | name-years | mean score | scoring 8 or 9, % | scoring 0 to 3, % |
|---|---|---|---|---|
| Financial Services | 1070 | 6.07 | 14.3 | 3.1 |
| Technology | 989 | 6.23 | 20.4 | 2.6 |
| Industrials | 988 | 6.24 | 17.7 | 1.5 |
| Consumer Cyclical | 910 | 6.18 | 20.0 | 4.1 |
| Healthcare | 901 | 6.16 | 15.8 | 1.7 |
| Consumer Defensive | 574 | 6.24 | 18.8 | 1.4 |
| Energy | 465 | 5.78 | 15.9 | 9.5 |
| Utilities | 441 | 5.57 | 4.8 | 3.2 |
| Real Estate | 412 | 5.92 | 10.0 | 1.5 |
| Basic Materials | 371 | 6.08 | 19.9 | 4.0 |
| Communication Services | 296 | 6.14 | 17.6 | 3.4 |
| unknown | 171 | 5.89 | 8.8 | 5.8 |
Table 4. Where a score goes the next July: name-years scored in two consecutive Julys
| score this July | name-years | mean score next July | next July 8 or 9, % | next July 4 to 7, % | next July 0 to 3, % |
|---|---|---|---|---|---|
| 1 | 19 | 4.11 | |||
| 2 | 74 | 5.12 | |||
| 3 | 276 | 5.46 | |||
| 4 | 952 | 5.76 | |||
| 5 | 2242 | 5.91 | |||
| 6 | 2741 | 6.05 | |||
| 7 | 2324 | 6.16 | |||
| 8 | 1265 | 6.24 | |||
| 9 | 273 | 6.33 | |||
| the high book, 8 or 9 | 1538 | 19.8 | 77.8 | 2.4 | |
| the middle, 4 to 7 | 8259 | 14.5 | 82.0 | 3.5 | |
| the low book, 0 to 3 | 370 | 10.0 | 75.1 | 14.9 |
Table 5. The score books walked: one registered one-year window each July, 2000 to 2025, mean window return net of costs
| book | every scored member of | windows counted | names a year | book, % | every scored member, % | windows book led, paired rows | book CAGR, % | every member CAGR, % | p book beats, % | paired Sharpe |
|---|---|---|---|---|---|---|---|---|---|---|
| high score, 8 or 9 | whole index | 26 of 26 | 62 | 10.86 | 12.05 | 11 (1 tied) | 9.79 | 10.86 | 15.3 | -0.19 |
| high, financials out | financials out | 26 of 26 | 54 | 11.07 | 12.41 | 12 | 10.01 | 11.32 | 14.1 | -0.21 |
| high, cheapest fifth | cheapest fifth | 19 of 26 | 10 | 9.20 | 9.94 | 8 | 6.42 | 7.11 | 39.0 | -0.06 |
| low score, 0 to 3 | whole index | 19 of 26 | 17 | 16.72 | 13.87 | 9 | 13.46 | 12.61 | 83.8 | 0.21 |
| low, financials out | financials out | 13 of 26 | 16 | 19.20 | 16.76 | 7 | 14.66 | 15.17 | 69.5 | 0.14 |
| low, cheapest fifth | cheapest fifth | 11 of 26 | 8 | 18.18 | 17.17 | 5 | 14.86 | 14.36 | 83.7 | 0.25 |
| the perfect nines | whole index | 12 of 26 | 16 | 11.03 | 9.28 | 5 | 9.94 | 8.62 | 77.9 | 0.22 |
Table 6. The nine signals walked one at a time: the passers against every scored member, 26 windows each, net of costs
| signal | passers a year | passers, % | every scored member, % | windows passers led, paired rows | passers CAGR, % | every member CAGR, % | gap, pp a year | p passers beat, % | paired Sharpe |
|---|---|---|---|---|---|---|---|---|---|
| 1, return on assets positive | 368 | 11.75 | 12.05 | 11 | 10.60 | 10.86 | -0.30 | 9.3 | -0.27 |
| 2, cash flow positive | 387 | 12.03 | 12.05 | 13 (2 tied) | 10.87 | 10.86 | 0.00 | 36.5 | -0.06 |
| 3, return on assets up | 203 | 11.47 | 12.05 | 11 | 10.38 | 10.86 | -0.50 | 12.4 | -0.20 |
| 4, cash flow above earnings | 351 | 12.20 | 12.05 | 15 (1 tied) | 11.07 | 10.86 | 0.20 | 82.5 | 0.16 |
| 5, debt ratio down | 208 | 12.08 | 12.05 | 12 (1 tied) | 10.82 | 10.86 | -0.00 | 50.5 | -0.00 |
| 6, current ratio up | 188 | 11.23 | 12.05 | 11 (2 tied) | 10.03 | 10.86 | -0.80 | 1.3 | -0.42 |
| 7, no net share issuance | 306 | 12.23 | 12.05 | 16 (1 tied) | 11.04 | 10.86 | 0.20 | 64.8 | 0.08 |
| 8, gross margin up | 200 | 11.77 | 12.05 | 15 | 10.73 | 10.86 | -0.10 | 34.7 | -0.06 |
| 9, asset turnover up | 197 | 12.49 | 12.05 | 13 | 11.30 | 10.86 | 0.40 | 77.5 | 0.15 |
Table 7. By era: the high and low books, every scored member and SPY, mean window return net of costs, windows led (paired)
| era | windows | high 8 or 9, % | every scored member, % | SPY, % | high led member | high led SPY | low 0 to 3, % (windows) | every member on those, % | low led member | names positive, high / all % | max drawdown, high / all % |
|---|---|---|---|---|---|---|---|---|---|---|---|
| 2000 to 2009 | 10 | 6.64 | 7.79 | -0.57 | 6 | 9 | 12.08 (7) | 8.49 (7) | 4 | 58.7 60.8 | -16.3 -16.8 |
| 2010 to 2019 | 10 | 11.37 | 13.13 | 14.16 | 1 (1 tied) | 2 | 11.01 (6) | 16.66 (6) | 1 | 65.6 69.0 | -15.2 -13.8 |
| 2020 to 2025 | 6 | 17.04 | 17.37 | 18.30 | 4 | 3 | 27.83 (6) | 17.37 (6) | 4 | 66.2 65.6 | -13.6 -13.5 |
| 2000 to 2025 | 26 | 10.86 | 12.05 | 9.45 | 11 (1 tied) | 14 | 16.72 (19) | 13.87 (19) | 9 | 63.1 65.0 | -15.3 -14.9 |
Table 8. The quality funds against the books on the walks' own windows, and growth of 1 from July 2016
| line | screens on | from | windows | line, % a year | high 8 or 9, % | every scored member, % | SPY, % | high led line | growth from 2016 | from 2016, % a year |
|---|---|---|---|---|---|---|---|---|---|---|
| QUAL, MSCI USA Quality | ROE, debt to equity, stable earnings | 2014 | 12 | 13.98 | 10.63 | 12.09 | 14.11 | 3 of 12 | 3.82x | 14.33 |
| SPHQ, S&P 500 Quality | ROE, accruals ratio, debt ratio | 2016 | 10 | 16.09 | 12.06 | 13.68 | 15.88 | 4 of 10 | 4.16x | 15.31 |
| QVAL, US Quantitative Value | cheapness, Piotroski-type strength | 2015 | 11 | 10.96 | 11.07 | 12.56 | 14.72 | 5 of 11 | 3.06x | 11.85 |
| high score, 8 or 9, net | 2016 | 10 | 2.85x | 11.05 | ||||||
| every scored member, net | 2016 | 10 | 3.30x | 12.69 | ||||||
| SPY, distributions reinvested | 2016 | 10 | 4.12x | 15.20 |
2.2 Per-step results
| # | Out-of-sample window | High score, 8 or 9 SR | Every scored member SR |
|---|---|---|---|
| 1 | 2000-07-03 → 2001-06-29 | 0.15 | 1.08 |
| 2 | 2001-07-02 → 2002-07-01 | 0.31 | 0.02 |
| 3 | 2002-07-01 → 2003-07-01 | -0.21 | 0.24 |
| 4 | 2003-07-01 → 2004-06-30 | 1.61 | 2.13 |
| 5 | 2004-07-01 → 2005-07-01 | 1.39 | 1.28 |
| 6 | 2005-07-01 → 2006-06-30 | 1.12 | 1.18 |
| 7 | 2006-07-03 → 2007-06-29 | 1.60 | 1.72 |
| 8 | 2007-07-02 → 2008-06-30 | -0.08 | -0.65 |
| 9 | 2008-07-01 → 2009-07-01 | -0.42 | -0.37 |
| 10 | 2009-07-01 → 2010-07-01 | 1.13 | 1.03 |
| 11 | 2010-07-01 → 2011-07-01 | 2.56 | 2.10 |
| 12 | 2011-07-01 → 2012-06-29 | 0.06 | 0.09 |
| 13 | 2012-07-02 → 2013-07-01 | 1.83 | 1.94 |
| 14 | 2013-07-01 → 2014-07-01 | 1.89 | 2.16 |
| 15 | 2014-07-01 → 2015-07-01 | 0.52 | 0.62 |
| 16 | 2015-07-01 → 2016-06-30 | 0.16 | 0.17 |
| 17 | 2016-07-01 → 2017-06-30 | 1.32 | 1.76 |
| 18 | 2017-07-03 → 2018-06-29 | 0.79 | 1.02 |
| 19 | 2018-07-02 → 2019-07-01 | 0.59 | 0.65 |
| 20 | 2019-07-01 → 2020-06-30 | -0.11 | 0.03 |
| 21 | 2020-07-01 → 2021-07-01 | 2.65 | 2.61 |
| 22 | 2021-07-01 → 2022-07-01 | -0.24 | -0.35 |
| 23 | 2022-07-01 → 2023-06-30 | 0.81 | 0.74 |
| 24 | 2023-07-03 → 2024-06-28 | 1.11 | 1.04 |
| 25 | 2024-07-01 → 2025-07-01 | 0.89 | 0.85 |
| 26 | 2025-07-01 → 2026-07-01 | 1.13 | 1.64 |
2.2b The family, walk by walk
Figure 1 draws these walks; here is every one of them in numbers, the paper’s own walk first and the study’s benchmark last.
| Walk | Windows | Span | Growth | CAGR | Worst drawdown | Pooled Sharpe |
|---|---|---|---|---|---|---|
| high score, 8 or 9 · High score, 8 or 9 (this paper) | 26 | 2000-07-03 → 2026-07-01 | +1034.6% | +9.8% | -48.0% | 0.59 |
| high score, 8 or 9 · Every scored member (this paper) | 26 | 2000-07-03 → 2026-07-01 | +1358.0% | +10.9% | -57.7% | 0.63 |
| high score, 8 or 9, cheapest fifth by book-to-market · High score, 8 or 9, cheapest fifth by book-to-market | 19 (7 excluded) | 2002-07-01 → 2026-07-01 | +226.1% | +5.0% | -59.6% | 0.38 |
| high score, 8 or 9, cheapest fifth by book-to-market · Every scored member of the cheapest fifth | 19 (7 excluded) | 2002-07-01 → 2026-07-01 | +268.7% | +5.6% | -69.0% | 0.40 |
| high score, 8 or 9, financials out · High score, 8 or 9, financials out | 26 | 2000-07-03 → 2026-07-01 | +1095.2% | +10.0% | -48.7% | 0.60 |
| high score, 8 or 9, financials out · Every scored member, financials out | 26 | 2000-07-03 → 2026-07-01 | +1524.2% | +11.3% | -52.4% | 0.67 |
| low score, 0 to 3 · Low score, 0 to 3 | 19 (7 excluded) | 2000-07-03 → 2026-07-01 | +1001.9% | +9.7% | -65.2% | 0.58 |
| low score, 0 to 3 · Every scored member | 19 (7 excluded) | 2000-07-03 → 2026-07-01 | +855.3% | +9.1% | -51.0% | 0.71 |
| low score, 0 to 3, cheapest fifth by book-to-market · Low score, 0 to 3, cheapest fifth by book-to-market | 11 (15 excluded) | 2002-07-01 → 2024-06-28 | +359.1% | +7.2% | -69.7% | 0.55 |
| low score, 0 to 3, cheapest fifth by book-to-market · Every scored member of the cheapest fifth | 11 (15 excluded) | 2002-07-01 → 2024-06-28 | +337.5% | +6.9% | -62.2% | 0.63 |
| low score, 0 to 3, financials out · Low score, 0 to 3, financials out | 13 (13 excluded) | 2002-07-01 → 2026-07-01 | +491.9% | +7.7% | -63.4% | 0.61 |
| low score, 0 to 3, financials out · Every scored member, financials out | 13 (13 excluded) | 2002-07-01 → 2026-07-01 | +527.3% | +8.0% | -47.7% | 0.85 |
| signal 1, return on assets positive · Signal 1, return on assets positive | 26 | 2000-07-03 → 2026-07-01 | +1273.4% | +10.6% | -57.0% | 0.63 |
| signal 1, return on assets positive · Every scored member | 26 | 2000-07-03 → 2026-07-01 | +1358.0% | +10.9% | -57.7% | 0.63 |
| signal 2, cash flow positive · Signal 2, cash flow positive | 26 | 2000-07-03 → 2026-07-01 | +1361.3% | +10.9% | -56.6% | 0.64 |
| signal 2, cash flow positive · Every scored member | 26 | 2000-07-03 → 2026-07-01 | +1358.0% | +10.9% | -57.7% | 0.63 |
| signal 3, return on assets up · Signal 3, return on assets up | 26 | 2000-07-03 → 2026-07-01 | +1203.4% | +10.4% | -55.5% | 0.62 |
| signal 3, return on assets up · Every scored member | 26 | 2000-07-03 → 2026-07-01 | +1358.0% | +10.9% | -57.7% | 0.63 |
| signal 4, cash flow above earnings · Signal 4, cash flow above earnings | 26 | 2000-07-03 → 2026-07-01 | +1431.4% | +11.1% | -55.2% | 0.65 |
| signal 4, cash flow above earnings · Every scored member | 26 | 2000-07-03 → 2026-07-01 | +1358.0% | +10.9% | -57.7% | 0.63 |
| signal 5, leverage down · Signal 5, leverage down | 26 | 2000-07-03 → 2026-07-01 | +1344.9% | +10.8% | -57.9% | 0.62 |
| signal 5, leverage down · Every scored member | 26 | 2000-07-03 → 2026-07-01 | +1358.0% | +10.9% | -57.7% | 0.63 |
| signal 6, current ratio up · Signal 6, current ratio up | 26 | 2000-07-03 → 2026-07-01 | +1101.2% | +10.0% | -56.8% | 0.60 |
| signal 6, current ratio up · Every scored member | 26 | 2000-07-03 → 2026-07-01 | +1358.0% | +10.9% | -57.7% | 0.63 |
| signal 7, no net share issuance · Signal 7, no net share issuance | 26 | 2000-07-03 → 2026-07-01 | +1423.3% | +11.0% | -56.9% | 0.65 |
| signal 7, no net share issuance · Every scored member | 26 | 2000-07-03 → 2026-07-01 | +1358.0% | +10.9% | -57.7% | 0.63 |
| signal 8, gross margin up · Signal 8, gross margin up | 26 | 2000-07-03 → 2026-07-01 | +1316.1% | +10.7% | -54.6% | 0.63 |
| signal 8, gross margin up · Every scored member | 26 | 2000-07-03 → 2026-07-01 | +1358.0% | +10.9% | -57.7% | 0.63 |
| signal 9, asset turnover up · Signal 9, asset turnover up | 26 | 2000-07-03 → 2026-07-01 | +1516.1% | +11.3% | -57.9% | 0.66 |
| signal 9, asset turnover up · Every scored member | 26 | 2000-07-03 → 2026-07-01 | +1358.0% | +10.9% | -57.7% | 0.63 |
| the perfect nines · The perfect nines | 12 (14 excluded) | 2004-07-01 → 2026-07-01 | +211.9% | +5.3% | -52.6% | 0.54 |
| the perfect nines · Every scored member | 12 (14 excluded) | 2004-07-01 → 2026-07-01 | +169.8% | +4.6% | -38.6% | 0.54 |
| platform reference (SPY) (benchmark) | 2000-07-03 → 2026-07-01 | +678.1% | +8.2% | -55.3% |
Growth and CAGR above are each walk over its own windows, so they are not comparable across walks with different window counts: a walk that excluded a window did not live through it. The figure rebases every line on the session all of them share.
2.3 Search accounting
This paper's search is a declared family: a declared family, counted at N = 16 evaluated books. Every member is either a registered walk with its own sealed hypothesis and frozen record, or a derived average computed from those frozen records; every member is reported, in the family matrix table and the robustness figure, and none was selected away. The count is declared by the author rather than derived from one project's ledger, because the members are sibling registered studies; the declaration names them and is frozen in this artifact. What the source strategy's author searched before publishing is not knowable from here and is not counted. The registered per-step record below still guarantees each window's hypothesis was hashed and registered before that window was scored.
2.4 The comparison
Both arms trade the same registered windows, so their returns can be PAIRED: inside each window the two return series are inner-joined date by date and the difference rHigh score, 8 or 9 − rEvery scored member is the object under test. Because this is ONE pre-declared contrast, frozen at registration before any window was scored, the paired statistic needs no multiple-testing deflation; the arm-level records carry the declared family count of §2.3 as their search accounting, and this contrast, sealed per window before scoring, is not multiplied by it.
In the table: Arm A = High score, 8 or 9 · Arm B = Every scored member.
| # | Window | Paired bars | Arm A | Arm B | Δ | Leader |
|---|---|---|---|---|---|---|
| 1 | 2000-07-05 → 2001-06-29 | 250 | +1.0% | +16.5% | -15.5 pp | Arm B |
| 2 | 2001-07-03 → 2002-07-01 | 247 | +3.7% | -1.0% | +4.7 pp | Arm A |
| 3 | 2002-07-02 → 2003-07-01 | 252 | -8.1% | +2.9% | -11.0 pp | Arm B |
| 4 | 2003-07-02 → 2004-06-30 | 251 | +22.6% | +29.5% | -6.9 pp | Arm B |
| 5 | 2004-07-02 → 2005-07-01 | 253 | +17.3% | +15.2% | +2.1 pp | Arm A |
| 6 | 2005-07-05 → 2006-06-30 | 251 | +13.6% | +13.8% | -0.2 pp | Arm B |
| 7 | 2006-07-05 → 2007-06-29 | 249 | +20.2% | +19.7% | +0.4 pp | Arm A |
| 8 | 2007-07-03 → 2008-06-30 | 251 | -3.9% | -14.8% | +10.9 pp | Arm A |
| 9 | 2008-07-02 → 2009-07-01 | 252 | -22.2% | -25.8% | +3.6 pp | Arm A |
| 10 | 2009-07-02 → 2010-07-01 | 252 | +23.2% | +23.0% | +0.2 pp | Arm A |
| 11 | 2010-07-02 → 2011-07-01 | 253 | +38.1% | +37.3% | +0.8 pp | Arm A |
| 12 | 2011-07-05 → 2012-06-29 | 251 | -2.0% | -1.0% | -1.1 pp | Arm B |
| 13 | 2012-07-03 → 2013-07-01 | 249 | +28.4% | +28.4% | +0.0 pp | tie |
| 14 | 2013-07-02 → 2014-07-01 | 252 | +24.4% | +26.2% | -1.8 pp | Arm B |
| 15 | 2014-07-02 → 2015-07-01 | 252 | +5.9% | +7.1% | -1.2 pp | Arm B |
| 16 | 2015-07-02 → 2016-06-30 | 252 | +1.3% | +1.4% | -0.1 pp | Arm B |
| 17 | 2016-07-05 → 2017-06-30 | 251 | +12.4% | +17.8% | -5.4 pp | Arm B |
| 18 | 2017-07-05 → 2018-06-29 | 250 | +9.3% | +11.8% | -2.5 pp | Arm B |
| 19 | 2018-07-03 → 2019-07-01 | 250 | +8.3% | +8.5% | -0.2 pp | Arm B |
| 20 | 2019-07-02 → 2020-06-30 | 252 | -11.3% | -5.1% | -6.2 pp | Arm B |
| 21 | 2020-07-02 → 2021-07-01 | 252 | +50.3% | +52.5% | -2.3 pp | Arm B |
| 22 | 2021-07-02 → 2022-07-01 | 252 | -6.1% | -7.8% | +1.7 pp | Arm A |
| 23 | 2022-07-05 → 2023-06-30 | 250 | +15.2% | +13.2% | +2.0 pp | Arm A |
| 24 | 2023-07-05 → 2024-06-28 | 249 | +13.0% | +11.9% | +1.1 pp | Arm A |
| 25 | 2024-07-02 → 2025-07-01 | 250 | +15.2% | +14.2% | +1.0 pp | Arm A |
| 26 | 2025-07-02 → 2026-07-01 | 251 | +15.3% | +20.9% | -5.5 pp | Arm B |
Paired Sharpe of the difference track: -0.19 · block bootstrap (2000 paths, block 10, seed 1234): P(High score, 8 or 9 beats Every scored member) = 15.3%.
Window win-rate. High score, 8 or 9 led 11 of 26 windows (42.3%), Every scored member led 14, and 1 windows were ties, and the mean window gap of -1.20 pp points the same way. Widest single window: 2000 at -15.5 pp.
| Period | Windows | High score, 8 or 9 | Every scored member | Mean gap | High score, 8 or 9 led |
|---|---|---|---|---|---|
| All windows | 26 | +10.97% | +12.17% | -1.20 pp | 11/26 |
| Before 2010 | 10 | +6.74% | +7.90% | -1.16 pp | 6/10 |
| 2010 onward | 16 | +13.61% | +14.83% | -1.22 pp | 5/16 |
3 The circuit
The strategy is a circuit of platform primitives, frozen when the study is registered. Below is the circuit as wired on the canvas, the objective it encodes and how the search runs through it, followed by the mathematics each primitive actually computes, the same formulas the execution engine runs. The complete parameterisation is preserved in the study ledger (Appendix A).
The sentence below is the registration record, generated when the circuit was sealed and printed verbatim; the authored description of the design is Section 1.
A COMPARATIVE study: High score, 8 or 9 vs Every scored member, walked on the same registered out-of-sample windows. High score, 8 or 9: S&P 500, evaluated, and run out-of-sample from the anchor: anything the design estimates from history, where it estimates at all, is re-estimated at each anchor from pre-anchor data only, and the walk advances through registered out-of-sample windows; its disposition is the realized forward path versus the benchmark. Every scored member: S&P 500, evaluated, and run out-of-sample from the anchor: anything the design estimates from history, where it estimates at all, is re-estimated at each anchor from pre-anchor data only, and the walk advances through registered out-of-sample windows; its disposition is the realized forward path versus the benchmark. The arms differ in: Piotroski F-score book (PIT), book: high → all. The contrast under test: whether High score, 8 or 9 generates better risk-adjusted returns than Every scored member over the identical out-of-sample windows.
The two blocks this study runs on, the F-score book and the one-year hold, were written for it as custom primitives on the engine, the way a user writes one on the desktop. They read a frozen table of scores built once from the vendor's annual statements with their SEC acceptance dates, and they run on any universe such a table is built for. Universe and Autopsy are the platform's own.
Envelopes show counts, ratios, dates, and the parameters the author chose. Full price and per-name data series are not republished: the underlying market data is licensed to QuanterLab. Point figures quoted in the prose, a named holding's return over a stated span, are summary facts derived from public market prices, not redistributed series.
The objective and the search
High score, 8 or 9
| Universe | S&P 500 index constituents. |
|---|---|
| Validation & out-of-sample | held forward test (every wired name bought equal weight at the anchor close and held to the end of the one-year window, dividends reinvested on the ex-date, 10.0 basis points one way at entry and at exit). |
| Other components | Study: Hold the book a year, Piotroski F-score book (PIT). |
Every scored member
The specification is identical to High score, 8 or 9's table above, row for row; the one sealed difference between the arms is itemized below.
What differs between the arms, one difference; the comparison is clean:
- paramPiotroski F-score book (PIT), book: high → all
Everything else is held identical, so an out-of-sample gap between the arms is attributable to this one change.
Cost elements are wired into the circuit, the realised drag is reported per step in Appendix B.
Show the mathematics, 2 primitives, formulas and parity notes
3.1 Universe
The starting set of tickers, resolved point-in-time from the index change-log, so names delisted or removed later still compete on the dates they traded.
Before any math, you need a list of stocks. An index preset (S&P 500, Nasdaq-100, Dow 30) is reconstructed as it stood ON your anchor date by replaying the historical add/drop change-log backwards, so a 2018 backtest sees the 2018 membership, not today's winners.
Start from today's constituents and un-apply every membership change after the anchor t:
\mathcal{U}(t) = \mathcal{U}_{\text{now}} \;\ominus\; \{\text{adds after } t\} \;\oplus\; \{\text{drops after } t\}3.2 Portfolio Forward Autopsy
The post-mortem, where the forward test’s return actually came from.
Runs after the Portfolio Forward Test and dissects its realized path: per-rebalance contributions, winners and losers, exposure and cash periods, and how the realized route compares to what the risk cones projected. It computes nothing new about the future, it explains the past the book just lived.
Depth I–IV: headline attribution, per-segment breakdown, per-name contributions, and the calibration ledger (projected cone vs realized, segment by segment). In a study, this is the node that fills the appendices.
4 Discussion
4.1 Findings
Over 10,973 scored name-years the mean score is 6.03 (Tables 1 and 4). The four level signals pass for most names: 92 percent have a positive return on assets, 96 positive cash flow from operations, 88 cash flow above earnings, 75 no net share issuance. The five change signals pass between 48 and 52 percent of the time, and they do not carry: a name in the high book this July is in it again next July 19.8 percent of the time, against 14.5 percent for a name from the middle, and a name scoring 9 scores 6.3 on average a year later. The low book carries a little more, 14.9 percent of low scorers are low again against 3.5 percent of the middle. The size of the high book is a market variable, not a company one: 11 names scored 8 or 9 in July 2002 and 135 in July 2022, because the change signals count improvement and after a good year for everybody everybody improved.
By sector from 2010 (Table 3), Utilities score lowest, a mean of 5.57 with 4.8 percent of name-years at 8 or 9 against 16.3 for the index, because a utility's turnover and margin barely move; Energy has the most low scorers, 9.5 percent of name-years against 2.6 for Technology, because its return on assets and debt ratio swing with the oil price. Industrials and Consumer Defensive score highest at 6.24.
In July 2000 the vendor's statements score 281 of the 496 members, 56.7 percent (Figure 2, Table 2); 130 members have no statements at the vendor at all and 82 have statements but no accepted pair by the anchor. The scored share passes 83 percent in 2010 and reaches 99.6 percent in July 2025. The names without statements are the names that left the index and the vendor never carried, so the first decade is scored on the survivors, and the limitations say which way that leans.
The names scoring 8 or 9 (Table 5, Figure 1), 62 a year on average, returned 10.86 percent per window net against 12.05 for every scored member, gross 11.08 against 12.28, so costs took 0.22 on either side. On the platform's paired rows the book led in 11 of 26 windows with one tied, July 2012, where the two arms sit within a tenth of a point; on the run reports' own window returns that July falls the book's way and the count is 12. It beat SPY in 14 windows; every scored member beat SPY in 13. By era (Table 7): 6.64 against 7.79 from 2000 to 2009, ahead in 6 of 10; 11.37 against 13.13 from 2010 to 2019, ahead in 1 of 10 with the tie; 17.04 against 17.37 from 2020, ahead in 4 of 6. The decade where the statements cover the index is the decade the book did worst against it. The paired bootstrap puts the probability that the high book is the better book at 15.3 percent, paired Sharpe -0.19, a gap of -1.10 points of CAGR. In the 6 windows where every scored member lost money the high book led in 4, and its three widest leads are three of them, July 2001, 2007 and 2008; its three widest misses are July 2000, 2002 and 2003. The share of names that ended the year up is 63.1 percent in the book against 65.0 in the index, and the mean drawdown inside a window 15.3 percent against 14.9: the high scorers are the same set of large caps with a few names taken out, and carry the same drawdown. Taking financials out does not change it: 11.07 against 12.41, ahead in 12 of 26, probability 14.1 percent.
Ranked by book-to-market at the statement's fiscal year end, the cheapest fifth of the scored members did better than the whole index on the 19 windows where it held five or more high scorers, 9.94 against 9.44, with SPY at 9.80 on the same windows. The high scorers inside it, 10 names a year, returned 9.20 against 9.94 for every scored member of the fifth, ahead in 8 of the 19, probability 39.0 percent, and the other 7 windows had fewer than five names. The value half of Piotroski's recipe shows up in the S&P 500, and the score half, applied on top of it, does not; a book of ten names a year is too small to carry a paper, which is why this is the second finding and not the first.
One signal of the nine is clear of noise and it hurts (Table 6). The names whose current ratio rose, 188 a year, returned 11.23 against 12.05 for every scored member, a paired Sharpe of -0.42 and a 1.3 percent probability of being the better book. On the paired rows they led in 11 of 26 with two tied, so the drag is small and steady, -0.80 points of CAGR, rather than large and occasional; the widest windows against them were 2025 and 2000. Three signals lean the other way without settling: cash flow above earnings, 82.5 percent probability and 0.20 points; asset turnover up, 77.5 percent and 0.40 points; no net share issuance, 64.8 percent and 0.20 points, ahead in 16 of 26 windows with one tied, the most of any book. A positive return on assets and a rising one sit at 9.3 and 12.4 percent: the names failing them, the loss-makers, one name in twelve, and the half whose return on assets fell, did better than the index, which is the low book's story again. Positive cash flow, debt ratio down and gross margin up are the index within a tenth of a point. The three quality funds people hold instead of a score screen on the level of profitability and on debt, SPHQ on accruals too, and none of them on the current ratio: the industry dropped the one signal with a measurable drag before this paper measured it.
The names scoring 0 to 3, 17 a year on average, returned 16.72 against 13.87 for every scored member on the 19 windows where the book had ten names (it had fewer in 6 Julys, 2005, 2007, 2012, 2014, 2015, 2019, and in 2006 it had 12 but too few with forward prices). It led in 9 of the 19, probability 83.8 percent, paired Sharpe 0.21. The lead is two windows wide: July 2020 (81.7 against 52.4) and July 2025 (48.5 against 20.8), and without those two the book returned 11.03 against 11.20. Its mean drawdown inside a window is 20.9 percent against 15.0 for the index. By era it led in 4 of 7 windows from 2000 to 2009, 1 of 6 from 2010 to 2019, and 4 of 6 from 2020, the rebound years. Inside the cheapest fifth, 18.18 against 17.17 on 11 windows; with financials out, 19.20 against 16.76 on 13. The perfect nines, 16 names on 12 windows, returned 11.03 against 9.28, ahead in 5, with one window each way of twenty points: 2007 and 2019.
On the walks' own windows from its first full July (Table 8, Figure 3), QUAL returned 13.98 percent a year against 10.63 for the high book and 14.11 for SPY over 12 windows, and the high book led it in 3; SPHQ from 2016, 16.09 against 12.06 and 15.88 over 10 windows, the high book ahead in 4; QVAL, the fund with a Piotroski-type screen inside it, 10.96 against 11.07 and 14.72 over 11 windows. Chained from July 2016 (Figure 3): SPHQ 4.16x, SPY 4.12x, QUAL 3.82x, every scored member 3.30x, QVAL 3.06x, the high book 2.85x. The two large-cap quality funds are SPY with a tilt. The book of high scorers is the equal-weight index with a few names removed, and equal weight trailed SPY over those years.
4.2 Interpretation
Piotroski wrote nine questions for firms the market had priced for trouble, where a positive return on assets or a positive cash flow was information. In the S&P 500 those are answered yes by 92 and 96 percent of names, and the score comes down to five questions about last year's change that pass about half the time and do not persist. A book of high scorers is then the index minus the loss-makers, the issuers and the names that had a bad year, held for the year after. It holds up when the index falls, its three widest leads are three of the 6 windows in which every scored member lost money, and it trails when the names it left out bounce, July 2002 and 2003 after the 2002 low. Its widest miss is July 2000, 0.9 percent against 16.4 for every scored member: the statements that had improved most in 1999 belonged to the technology names about to fall, and the book held Technology at 18 percent of its names against 9 for the index. Over the whole record the book returns about a point a year less than the index it is drawn from.
The low book has the same problem running the other way. A score of 0 to 3 at a company that stays in the S&P 500 is usually one bad year, not a firm on its way out, and the year after a bad year is a good one when the whole market is recovering: the book's lead is July 2020 and July 2025, and without them it returned 11.03 against 11.20. In the covered decade, 2010 to 2019, it led in 1 of 6 windows. This is the opposite of Piotroski's sample, where the low scorers were the firms that went on to delist; the index membership rule has already removed those.
Cash flow above earnings, the accruals signal, is Sloan (1996) restated as a bit, and it leans the right way at 82.5 percent; asset turnover up and no net issuance lean the same way. A large company whose current assets grew faster than its current liabilities usually built inventory or receivables or sat on cash, which in a firm with no funding problem is idle capital, and the signal was written for firms whose problem was funding.
Piotroski and So (2012) showed that the score pays where the price disagrees with the statements, cheap names with strong fundamentals and expensive names with weak ones. The S&P 500 is mostly priced for the quality it has, and the one cut here that adds the disagreement, the cheapest fifth, is too small in this index to carry a book, ten high scorers a year, and did not beat its own fifth. Mohanram (2005) had to write a separate score for growth stocks because the F-score's questions do not carry to low book-to-market firms; most of the S&P 500 sits there.
What would change the conclusion is a broader universe, where the cheapest fifth holds a few hundred names and some of them are in trouble, which is where the score was born; a long-short test, which needs a borrow model this record does not carry; and point-in-time sector labels, which would move a few names across the financials line. None of these would change what the census shows, that in this index the score is one year's change and does not carry over. The two nodes written for this study, the F-score book and the one-year hold, stay on the platform with the tables they read, so a reader with an account can wire them to a universe of their own and rerun the census and the sixteen walks on it. The broad-universe walk is the next one to run.
This study is one member of a declared search family: the same design walked at several sealed settings across sibling registered projects, every member either a registered walk with its own frozen record or a derived average of those records, and every member reported. The family size is declared by the author and named in the lineage; it is the search-accounting count for this paper. What was searched before the source strategy was published is not knowable from here and is not counted.
4.3 Limitations
The vendor holds no statements for 1,173 member-years, 130 of the 496 members in July 2000 and none by 2022, and it prices none of the names that left the index and it no longer carries. Those are the names that were acquired or delisted, and Piotroski's own finding is that low scorers delist more often, so the first decade's low book is missing the names most likely to have gone to zero and its lead there is flattered; the reference is flattered the same way, less. In 2006 the low book had 12 names and fewer than ten with forward prices, and that window is excluded rather than filled. From 2010 the hole is under a fifth of the index and from 2018 under a twentieth, and the results the paper leans on, the high book's record and the signal-by-signal walks, hold in the covered years as they do in the whole record.
The score is computed from the vendor's fields as it maps them, and a bank's current assets are the vendor's construction; the financials-out cut is the check. The sector labels are the vendor's as of today, not as of the anchor. Price-to-book for the cheapest fifth is the vendor's figure at the statement's fiscal year end, so the ranking is a few months stale at the anchor and uses the fiscal-year-end price. Costs are a flat ten basis points one way on every name, not quoted spreads; the names are large caps and the books turn over once a year, so the cost line is small either way, 0.22 percent a year on the high book. Taxes are not modelled. The walks are long only, and Piotroski's long-short number is not reproduced. The reference arm is equal weight and the funds are cap weighted, so Table 8 compares two weightings as well as two screens. SPHQ's record before 2016 belongs to other indices and is left out.
References
- Gelman, A., & Loken, E. (2013). The garden of forking paths: Why multiple comparisons can be a problem, even when there is no “fishing expedition.” Working paper, Columbia University.
- Harvey, C. R., Liu, Y., & Zhu, H. (2016). … and the Cross-Section of Expected Returns. Review of Financial Studies, 29(1), 5–68. doi:10.1093/rfs/hhv059
- Lo, A. W. (2002). The Statistics of Sharpe Ratios. Financial Analysts Journal, 58(4), 36–52. doi:10.2469/faj.v58.n4.2453
- Piotroski (2000), Value investing: the use of historical financial statement information to separate winners from losers, Journal of Accounting Research: nine binary signals from the statements; among the highest book-to-market fifth, the high scorers earned 7.5 percentage points a year over the group between 1976 and 1996, a long-short of 23 percent, concentrated in small firms with no analyst fo
- Sloan (1996), Do stock prices fully reflect information in accruals and cash flows about future earnings?, The Accounting Review: firms whose earnings are made of accruals rather than cash flow earn lower returns after, the mechanism behind signal 4.
- Mohanram (2005), Separating winners from losers among low book-to-market stocks using financial statement analysis, Review of Accounting Studies: a separate score for growth stocks, because the value screen's signals do not carry to low book-to-market firms.
- Piotroski and So (2012), Identifying expectation errors in value/glamour strategies: a fundamental analysis approach, Review of Financial Studies: the score's returns concentrate where price and fundamentals disagree, cheap names with strong statements and expensive names with weak ones.
- Novy-Marx (2013), The other side of value: the gross profitability premium, Journal of Financial Economics: the level of gross profits over assets predicts returns about as well as book-to-market; the score uses the change in gross margin, which is a different quantity.
- Gray and Carlisle (2012), Quantitative Value, Wiley: the financial-strength score built on Piotroski's signals that sits inside the Quantitative Value fund's screen.
Appendix A Reproducibility in QuanterLab
Each step is backed by a frozen run report. The study is re-derivable from the ledger below.
| # | Commit | Report | Anchor | OOS window |
|---|---|---|---|---|
| 1 | b9697978a521 | 9022 | 2000-07-01 | 2000-07-03 → 2001-06-29 |
| 2 | c55d06bd4a91 | 9023 | 2001-07-01 | 2001-07-02 → 2002-07-01 |
| 3 | 321ea9b0e3f2 | 9024 | 2002-07-01 | 2002-07-01 → 2003-07-01 |
| 4 | 942ca442aed7 | 9025 | 2003-07-01 | 2003-07-01 → 2004-06-30 |
| 5 | 13c16592153c | 9026 | 2004-07-01 | 2004-07-01 → 2005-07-01 |
| 6 | 44d70a12363c | 9027 | 2005-07-01 | 2005-07-01 → 2006-06-30 |
| 7 | ac07c5fb8411 | 9028 | 2006-07-01 | 2006-07-03 → 2007-06-29 |
| 8 | 84ecfbd1a6f8 | 9029 | 2007-07-01 | 2007-07-02 → 2008-06-30 |
| 9 | aa1f7c703121 | 9032 | 2008-07-01 | 2008-07-01 → 2009-07-01 |
| 10 | c4c4ed2b390b | 9034 | 2009-07-01 | 2009-07-01 → 2010-07-01 |
| 11 | 522dc59524a6 | 9037 | 2010-07-01 | 2010-07-01 → 2011-07-01 |
| 12 | 1d4cbe4eaf4f | 9039 | 2011-07-01 | 2011-07-01 → 2012-06-29 |
| 13 | bf694e16bdf5 | 9041 | 2012-07-01 | 2012-07-02 → 2013-07-01 |
| 14 | ca79b1208439 | 9043 | 2013-07-01 | 2013-07-01 → 2014-07-01 |
| 15 | ae736ea34941 | 9045 | 2014-07-01 | 2014-07-01 → 2015-07-01 |
| 16 | afd3759ed866 | 9047 | 2015-07-01 | 2015-07-01 → 2016-06-30 |
| 17 | 026fc6f2355e | 9055 | 2016-07-01 | 2016-07-01 → 2017-06-30 |
| 18 | 602353eb3cab | 9061 | 2017-07-01 | 2017-07-03 → 2018-06-29 |
| 19 | 330ce25f0c44 | 9067 | 2018-07-01 | 2018-07-02 → 2019-07-01 |
| 20 | a0f41c7b48b6 | 9072 | 2019-07-01 | 2019-07-01 → 2020-06-30 |
| 21 | b196d0d9c505 | 9076 | 2020-07-01 | 2020-07-01 → 2021-07-01 |
| 22 | fcdcceefb825 | 9081 | 2021-07-01 | 2021-07-01 → 2022-07-01 |
| 23 | 2c7678a991b8 | 9085 | 2022-07-01 | 2022-07-01 → 2023-06-30 |
| 24 | 17afa677507c | 9087 | 2023-07-01 | 2023-07-03 → 2024-06-28 |
| 25 | f8d778f6d467 | 9092 | 2024-07-01 | 2024-07-01 → 2025-07-01 |
| 26 | cae72d4eb753 | 9096 | 2025-07-01 | 2025-07-01 → 2026-07-01 |
Appendix A2 Registration record
What this record does and does not establish. Every window in this study is historical: the data existed before the study began, so this is sequential sealing on past windows, not pre-registration in the clinical-trial sense, and no procedure could make it so. What the platform does enforce is order, each step's specification was frozen and hashed before that step was scored, and the walk cannot advance past a step that was never run or close one with a result registered for a different window. The two timestamp columns below are the evidence: read them together and each seal precedes its own run, and each run precedes the next seal. A study whose seals all post-date its runs would show it here. Wall-clock spacing between seals varies with the author's schedule and queue latency; the ordering, not the tempo, is the claim.
“A COMPARATIVE study: High score, 8 or 9 vs Every scored member, walked on the same registered out-of-sample windows. High score, 8 or 9: S&P 500, evaluated, and run out-of-sample from the anchor: anything the design estimates from history, where it estimates at all, is re-estimated at each anchor from pre-anchor data only, and the walk advances through registered out-of-sample windows; its disposition is the realized forward path versus the benchmark. Every scored member: S&P 500, evaluated, and run out-of-sample from the anchor: anything the design estimates from history, where it estimates at all, is re-estimated at each anchor from pre-anchor data only, and the walk advances through registered out-of-sample windows; its disposition is the realized forward path versus the benchmark. The arms differ in: Piotroski F-score book (PIT), book: high → all. The contrast under test: whether High score, 8 or 9 generates better risk-adjusted returns than Every scored member over the identical out-of-sample windows.”
The same hypothesis was registered independently at every step, hashed before each step's out-of-sample window was scored:
| # | Anchor | Registered at (UTC) | Run completed (UTC) |
|---|---|---|---|
| 1 | 2000-07-01 | 2026-09-12 11:47:06 | 2026-09-12 11:47:42 |
| 2 | 2001-07-01 | 2026-09-12 11:47:42 | 2026-09-12 11:47:54 |
| 3 | 2002-07-01 | 2026-09-12 11:47:54 | 2026-09-12 11:48:06 |
| 4 | 2003-07-01 | 2026-09-12 11:48:06 | 2026-09-12 11:48:18 |
| 5 | 2004-07-01 | 2026-09-12 11:48:18 | 2026-09-12 11:48:31 |
| 6 | 2005-07-01 | 2026-09-12 11:48:31 | 2026-09-12 11:48:43 |
| 7 | 2006-07-01 | 2026-09-12 11:48:43 | 2026-09-12 11:48:55 |
| 8 | 2007-07-01 | 2026-09-12 11:48:55 | 2026-09-12 11:49:07 |
| 9 | 2008-07-01 | 2026-09-12 11:49:07 | 2026-09-12 11:49:32 |
| 10 | 2009-07-01 | 2026-09-12 11:49:32 | 2026-09-12 11:49:44 |
| 11 | 2010-07-01 | 2026-09-12 11:49:44 | 2026-09-12 11:50:08 |
| 12 | 2011-07-01 | 2026-09-12 11:50:09 | 2026-09-12 11:50:21 |
| 13 | 2012-07-01 | 2026-09-12 11:50:21 | 2026-09-12 11:50:33 |
| 14 | 2013-07-01 | 2026-09-12 11:50:33 | 2026-09-12 11:50:45 |
| 15 | 2014-07-01 | 2026-09-12 11:50:46 | 2026-09-12 11:50:58 |
| 16 | 2015-07-01 | 2026-09-12 11:50:58 | 2026-09-12 11:51:10 |
| 17 | 2016-07-01 | 2026-09-12 11:51:10 | 2026-09-12 11:51:59 |
| 18 | 2017-07-01 | 2026-09-12 11:51:59 | 2026-09-12 11:52:35 |
| 19 | 2018-07-01 | 2026-09-12 11:52:36 | 2026-09-12 11:53:24 |
| 20 | 2019-07-01 | 2026-09-12 11:53:24 | 2026-09-12 11:54:01 |
| 21 | 2020-07-01 | 2026-09-12 11:54:01 | 2026-09-12 11:54:37 |
| 22 | 2021-07-01 | 2026-09-12 11:54:37 | 2026-09-12 11:55:14 |
| 23 | 2022-07-01 | 2026-09-12 11:55:14 | 2026-09-12 11:55:50 |
| 24 | 2023-07-01 | 2026-09-12 11:55:50 | 2026-09-12 11:56:15 |
| 25 | 2024-07-01 | 2026-09-12 11:56:15 | 2026-09-12 11:56:51 |
| 26 | 2025-07-01 | 2026-09-12 11:56:52 | 2026-09-12 11:57:28 |
Appendix B Per-step diagnostics
Realized in the projection tables below is the risk engine scoring its own forecast: the buy-and-hold return of the segment that followed each rebalance, on the same gross basis the cone was projected on. It is deliberately not the charged, calendar-window total return the study’s tables print, so the two will not reconcile line by line; the cone and its outcome share one basis, which is what a calibration test requires. Each row names its segment’s span so a boundary session is visible.
Names held is the union across the window: the count of distinct instruments the book touched between the window’s first and last session, not the number it held at one time. A book that rotates monthly touches more names than it holds.
What each step's run actually did beyond its return: capital allocation across lanes and regimes, the portfolio book's rebalancing and cost drag, and how positions were sized. Harvested from the frozen run reports, present where the circuit produced them.
Open the full per-step grid (26 steps: every rebalance, capital routing and sizing, per window)
Step 1 · 2000-07-03 → 2001-06-29
High score, 8 or 9
Portfolio book, rebalanced hold · 39 names held · selection: anchor · 5.1% in cash · cost drag 0.202% · 2 names dropped at load (41 selected, 39 held across the window), weights renormalised onto the rest
Every scored member
Portfolio book, rebalanced hold · 259 names held · selection: anchor · 5.8% in cash · cost drag 0.233% · 15 names dropped at load (274 selected, 259 held across the window), weights renormalised onto the rest
Step 2 · 2001-07-02 → 2002-07-01
High score, 8 or 9
Portfolio book, rebalanced hold · 27 names held · selection: anchor · 0.0% in cash · cost drag 0.207%
Every scored member
Portfolio book, rebalanced hold · 277 names held · selection: anchor · 5.4% in cash · cost drag 0.198% · 15 names dropped at load (292 selected, 277 held across the window), weights renormalised onto the rest
Step 3 · 2002-07-01 → 2003-07-01
High score, 8 or 9
Portfolio book, rebalanced hold · 11 names held · selection: anchor · 9.1% in cash · cost drag 0.184% · 1 name dropped at load (12 selected, 11 held across the window), weights renormalised onto the rest
Every scored member
Portfolio book, rebalanced hold · 281 names held · selection: anchor · 5.7% in cash · cost drag 0.206% · 16 names dropped at load (297 selected, 281 held across the window), weights renormalised onto the rest
Step 4 · 2003-07-01 → 2004-06-30
High score, 8 or 9
Portfolio book, rebalanced hold · 25 names held · selection: anchor · 0.0% in cash · cost drag 0.245%
Every scored member
Portfolio book, rebalanced hold · 295 names held · selection: anchor · 2.7% in cash · cost drag 0.259% · 8 names dropped at load (303 selected, 295 held across the window), weights renormalised onto the rest
Step 5 · 2004-07-01 → 2005-07-01
High score, 8 or 9
Portfolio book, rebalanced hold · 52 names held · selection: anchor · 0.0% in cash · cost drag 0.235%
Every scored member
Portfolio book, rebalanced hold · 305 names held · selection: anchor · 2.6% in cash · cost drag 0.23% · 8 names dropped at load (313 selected, 305 held across the window), weights renormalised onto the rest
Step 6 · 2005-07-01 → 2006-06-30
High score, 8 or 9
Portfolio book, rebalanced hold · 60 names held · selection: anchor · 1.7% in cash · cost drag 0.227% · 1 name dropped at load (61 selected, 60 held across the window), weights renormalised onto the rest
Every scored member
Portfolio book, rebalanced hold · 310 names held · selection: anchor · 2.9% in cash · cost drag 0.228% · 9 names dropped at load (319 selected, 310 held across the window), weights renormalised onto the rest
Step 7 · 2006-07-03 → 2007-06-29
High score, 8 or 9
Portfolio book, rebalanced hold · 61 names held · selection: anchor · 3.3% in cash · cost drag 0.24% · 2 names dropped at load (63 selected, 61 held across the window), weights renormalised onto the rest
Every scored member
Portfolio book, rebalanced hold · 330 names held · selection: anchor · 3.3% in cash · cost drag 0.24% · 11 names dropped at load (341 selected, 330 held across the window), weights renormalised onto the rest
Step 8 · 2007-07-02 → 2008-06-30
High score, 8 or 9
Portfolio book, rebalanced hold · 57 names held · selection: anchor · 1.8% in cash · cost drag 0.192% · 1 name dropped at load (58 selected, 57 held across the window), weights renormalised onto the rest
Every scored member
Portfolio book, rebalanced hold · 349 names held · selection: anchor · 3.2% in cash · cost drag 0.171% · 11 names dropped at load (360 selected, 349 held across the window), weights renormalised onto the rest
Step 9 · 2008-07-01 → 2009-07-01
High score, 8 or 9
Portfolio book, rebalanced hold · 39 names held · selection: anchor · 2.6% in cash · cost drag 0.156% · 1 name dropped at load (40 selected, 39 held across the window), weights renormalised onto the rest
Every scored member
Portfolio book, rebalanced hold · 366 names held · selection: anchor · 4.6% in cash · cost drag 0.148% · 17 names dropped at load (383 selected, 366 held across the window), weights renormalised onto the rest
Step 10 · 2009-07-01 → 2010-07-01
High score, 8 or 9
Portfolio book, rebalanced hold · 38 names held · selection: anchor · 0.0% in cash · cost drag 0.247%
Every scored member
Portfolio book, rebalanced hold · 384 names held · selection: anchor · 3.1% in cash · cost drag 0.246% · 12 names dropped at load (396 selected, 384 held across the window), weights renormalised onto the rest
Step 11 · 2010-07-01 → 2011-07-01
High score, 8 or 9
Portfolio book, rebalanced hold · 48 names held · selection: anchor · 0.0% in cash · cost drag 0.276%
Every scored member
Portfolio book, rebalanced hold · 398 names held · selection: anchor · 2.8% in cash · cost drag 0.275% · 11 names dropped at load (409 selected, 398 held across the window), weights renormalised onto the rest
Step 12 · 2011-07-01 → 2012-06-29
High score, 8 or 9
Portfolio book, rebalanced hold · 91 names held · selection: anchor · 0.0% in cash · cost drag 0.196%
Every scored member
Portfolio book, rebalanced hold · 405 names held · selection: anchor · 2.7% in cash · cost drag 0.198% · 11 names dropped at load (416 selected, 405 held across the window), weights renormalised onto the rest
Step 13 · 2012-07-02 → 2013-07-01
High score, 8 or 9
Portfolio book, rebalanced hold · 62 names held · selection: anchor · 0.0% in cash · cost drag 0.257%
Every scored member
Portfolio book, rebalanced hold · 415 names held · selection: anchor · 2.2% in cash · cost drag 0.257% · 9 names dropped at load (424 selected, 415 held across the window), weights renormalised onto the rest
Step 14 · 2013-07-01 → 2014-07-01
High score, 8 or 9
Portfolio book, rebalanced hold · 51 names held · selection: anchor · 0.0% in cash · cost drag 0.249%
Every scored member
Portfolio book, rebalanced hold · 421 names held · selection: anchor · 1.9% in cash · cost drag 0.252% · 8 names dropped at load (429 selected, 421 held across the window), weights renormalised onto the rest
Step 15 · 2014-07-01 → 2015-07-01
High score, 8 or 9
Portfolio book, rebalanced hold · 70 names held · selection: anchor · 0.0% in cash · cost drag 0.212%
Every scored member
Portfolio book, rebalanced hold · 429 names held · selection: anchor · 2.1% in cash · cost drag 0.214% · 9 names dropped at load (438 selected, 429 held across the window), weights renormalised onto the rest
Step 16 · 2015-07-01 → 2016-06-30
High score, 8 or 9
Portfolio book, rebalanced hold · 72 names held · selection: anchor · 2.8% in cash · cost drag 0.203% · 2 names dropped at load (74 selected, 72 held across the window), weights renormalised onto the rest
Every scored member
Portfolio book, rebalanced hold · 442 names held · selection: anchor · 1.8% in cash · cost drag 0.203% · 8 names dropped at load (450 selected, 442 held across the window), weights renormalised onto the rest
Step 17 · 2016-07-01 → 2017-06-30
High score, 8 or 9
Portfolio book, rebalanced hold · 49 names held · selection: anchor · 0.0% in cash · cost drag 0.225%
Every scored member
Portfolio book, rebalanced hold · 465 names held · selection: anchor · 1.1% in cash · cost drag 0.236% · 5 names dropped at load (470 selected, 465 held across the window), weights renormalised onto the rest
Step 18 · 2017-07-03 → 2018-06-29
High score, 8 or 9
Portfolio book, rebalanced hold · 64 names held · selection: anchor · 1.6% in cash · cost drag 0.219% · 1 name dropped at load (65 selected, 64 held across the window), weights renormalised onto the rest
Every scored member
Portfolio book, rebalanced hold · 473 names held · selection: anchor · 0.8% in cash · cost drag 0.224% · 4 names dropped at load (477 selected, 473 held across the window), weights renormalised onto the rest
Step 19 · 2018-07-02 → 2019-07-01
High score, 8 or 9
Portfolio book, rebalanced hold · 77 names held · selection: anchor · 0.0% in cash · cost drag 0.217%
Every scored member
Portfolio book, rebalanced hold · 483 names held · selection: anchor · 0.4% in cash · cost drag 0.217% · 2 names dropped at load (485 selected, 483 held across the window), weights renormalised onto the rest
Step 20 · 2019-07-01 → 2020-06-30
High score, 8 or 9
Portfolio book, rebalanced hold · 77 names held · selection: anchor · 0.0% in cash · cost drag 0.177%
Every scored member
Portfolio book, rebalanced hold · 492 names held · selection: anchor · 0.4% in cash · cost drag 0.19% · 2 names dropped at load (494 selected, 492 held across the window), weights renormalised onto the rest
Step 21 · 2020-07-01 → 2021-07-01
High score, 8 or 9
Portfolio book, rebalanced hold · 77 names held · selection: anchor · 0.0% in cash · cost drag 0.301%
Every scored member
Portfolio book, rebalanced hold · 493 names held · selection: anchor · 0.2% in cash · cost drag 0.305% · 1 name dropped at load (494 selected, 493 held across the window), weights renormalised onto the rest
Step 22 · 2021-07-01 → 2022-07-01
High score, 8 or 9
Portfolio book, rebalanced hold · 51 names held · selection: anchor · 0.0% in cash · cost drag 0.188%
Every scored member
Portfolio book, rebalanced hold · 496 names held · selection: anchor · 0.0% in cash · cost drag 0.184%
Step 23 · 2022-07-01 → 2023-06-30
High score, 8 or 9
Portfolio book, rebalanced hold · 134 names held · selection: anchor · 0.7% in cash · cost drag 0.231% · 1 name dropped at load (135 selected, 134 held across the window), weights renormalised onto the rest
Every scored member
Portfolio book, rebalanced hold · 497 names held · selection: anchor · 0.4% in cash · cost drag 0.226% · 2 names dropped at load (499 selected, 497 held across the window), weights renormalised onto the rest
Step 24 · 2023-07-03 → 2024-06-28
High score, 8 or 9
Portfolio book, rebalanced hold · 62 names held · selection: anchor · 0.0% in cash · cost drag 0.226%
Every scored member
Portfolio book, rebalanced hold · 497 names held · selection: anchor · 0.0% in cash · cost drag 0.224%
Step 25 · 2024-07-01 → 2025-07-01
High score, 8 or 9
Portfolio book, rebalanced hold · 122 names held · selection: anchor · 0.0% in cash · cost drag 0.231%
Every scored member
Portfolio book, rebalanced hold · 497 names held · selection: anchor · 0.2% in cash · cost drag 0.228% · 1 name dropped at load (498 selected, 497 held across the window), weights renormalised onto the rest
Step 26 · 2025-07-01 → 2026-07-01
High score, 8 or 9
Portfolio book, rebalanced hold · 109 names held · selection: anchor · 0.9% in cash · cost drag 0.231% · 1 name dropped at load (110 selected, 109 held across the window), weights renormalised onto the rest
Every scored member
Portfolio book, rebalanced hold · 496 names held · selection: anchor · 0.4% in cash · cost drag 0.242% · 2 names dropped at load (498 selected, 496 held across the window), weights renormalised onto the rest