
A VIX Circuit Breaker on Momentum: One Crisis Averted, Every Recovery Missed (S&P 500, 2006–2026)
A volatility circuit breaker is the most intuitive risk control a systematic equity investor can bolt onto a momentum book: when the VIX crosses a panic threshold, go to cash; when it settles, return. This study tests that rule directly. Two arms run the identical combined-momentum strategy on the point-in-time S&P 500 across twenty sealed one-year out-of-sample windows from 2006 to 2026. They differ in exactly one node: Arm A carries a VIX cut that moves the book to cash above VIX 30 and re-enters below 22; Arm B carries nothing.
The cut is decisively harmful. Arm A compounds at 2.5% against Arm B's 10.0%, a gap of 7.5 percentage points a year, and a block bootstrap over 5,011 paired daily observations puts the probability that the protected arm outperforms at 0.8%. Pooled out-of-sample Sharpe is 0.225 with the cut against 0.488 without.
The interesting part is not the average. The rule never fires in nine of the twenty windows, so the entire verdict rests on eleven. Of those, it helps in two and hurts in nine. Its single clear success is 2008, where it turned a 52.4% loss into a 37.5% loss. Its single worst failure is the year immediately following: in 2009 it held the book in cash 83.7% of the time and delivered 9.6% against the unprotected arm's 41.6%. The 14.9 points bought in the crisis were repaid more than three times over in the recovery.
The mechanism is visible in the volatility. In 2022 the cut reduced realised volatility from 37.2% to 22.5% while turning a 10.9% loss into a 41.2% loss. It did exactly what it promised and removed the good days with the bad. A binary threshold on a mean-reverting index cuts after drawdowns and re-enters after rebounds, and momentum's recoveries are where its returns live.
1 Methodology
UNIVERSE AND POINT-IN-TIME CONSTRUCTION. The universe is the S&P 500 as constituted at each window's anchor date, resolved point-in-time from vendor membership history rather than from today's index. Both arms use the same resolution at every step, so no survivorship difference can enter the comparison. Twenty anchors run from 2006-01-01 to 2025-01-01 inclusive, each followed by a full one-year out-of-sample window; the final window closes at 2026-01-01.
SIGNAL. Each name is scored on a combined price-momentum factor built from four horizons, trailing 1, 3, 6 and 12-month returns, each cross-sectionally winsorized and z-scored over the loaded universe at the anchor, then averaged at equal importance. The momentum family carries 100% of the composite weight; no fundamental family contributes. Momentum is computed from prices alone and requires no filing, so a name enters the cross-section on price history rather than on statement coverage.
SELECTION AND HOLDING. The top ten names by composite score are held equal-weighted. The book re-selects quarterly against the full point-in-time universe, so each rebalance re-ranks the index rather than re-ranking the incumbent holdings. Positions are long only. The benchmark is SPY. Each window runs one year forward from its anchor and the twenty windows are chained end to end into a single out-of-sample track.
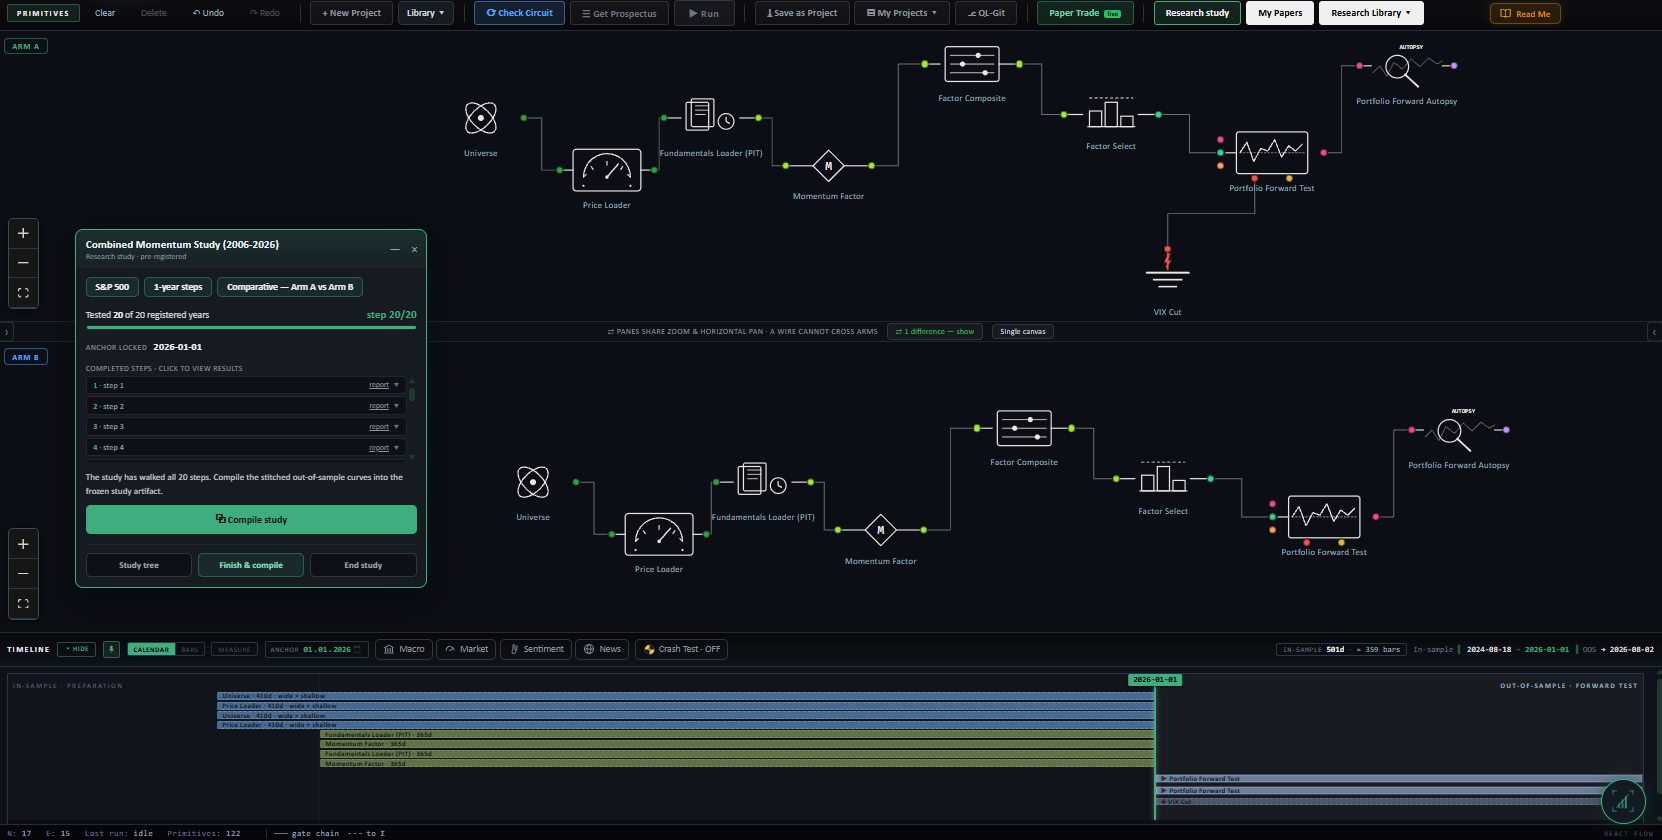
THE VARIABLE UNDER TEST. Arm A and Arm B are byte-identical circuits with one exception: Arm A wires a VIX cut into the forward tester as a risk overlay. The rule is a two-level hysteresis, when the VIX closes above 30 the book moves entirely to cash, and it re-enters only once the VIX closes below 22. The asymmetric thresholds exist to prevent a single index print from toggling the book daily. Arm B receives no overlay of any kind. No regime classifier is wired in either arm, so the forward tester's regime exposure controls never engage; the cut is the sole source of cash in the study, which the per-window cash percentages confirm exactly.
SEQUENTIAL SEALING, NOT PRE-REGISTRATION. Every window in this study is historical: the data existed before the study began. No procedure applied afterwards can turn that into pre-registration in the clinical-trial sense, and this paper does not claim otherwise. What the platform does enforce is ORDER. Each step's circuit was frozen and hashed, and the resulting commitment recorded against that window's anchor, before that step was scored; the walk refuses to advance past a step whose run never landed, and refuses to close a window with a result registered for a different one. Appendix A2 prints the seal time and the run-completion time for all twenty steps at second resolution, so the interleaving, seal, run, seal, run, is checkable rather than asserted. The whole walk was executed in one session on 2026-08-02; the twenty seals are minutes apart, not months, and the table shows exactly that. What this rules out is a specification that moved mid-walk or a window scored before it was sealed. What it cannot rule out, and nothing could, is that the author had prior exposure to the historical record.
STATISTICS. The arms are compared on paired daily returns over the stitched out-of-sample track, 5,011 paired observations. The reported probability that Arm A outperforms Arm B is a stationary block bootstrap with a block length of ten trading days over 2,000 resampled paths; the block preserves the short-horizon autocorrelation that an i.i.d. bootstrap would destroy and that would otherwise overstate significance. The paired Sharpe of the difference series is reported alongside each arm's own pooled Sharpe.
WHAT IS NOT MODELLED. No transaction-cost overlay is wired, so all results are gross of commissions, spread, slippage and market impact. No deflated Sharpe ratio is claimed: this design was not promoted from a recorded search, so the number of alternatives considered before it is unknown, and an unrecorded search count cannot honestly be deflated against. Returns are price returns and exclude dividends for both the book and the benchmark.
Transaction costs are not modelled in this study; all results are gross of costs.
2 Results
2.1 Headline
| Book | Total return | Per year | Volatility | Sharpe | Worst drawdown | Mean window |
|---|---|---|---|---|---|---|
| Arm B | +557.7% | 9.88% | 26.8% | 0.49 | -65.0% | +12.46% |
| Benchmark (reference) | +402.8% | 8.41% | 19.4% | 0.52 | -57.4% | +9.88% |
| Arm A | +64.3% | 2.51% | 20.5% | 0.22 | -61.6% | +4.73% |
Volatility, Sharpe and worst drawdown are computed on each book's own stitched daily series over the identical trading days that Figure 1 draws, so the panel and the figure are the same arithmetic. Sharpe carries no cash hurdle. Mean window is the arithmetic average of the one-year window returns and does not compound to the total beside it; the difference is volatility drag.
2.2 Per-step results
| # | Out-of-sample window | Arm A SR | Arm B SR |
|---|---|---|---|
| 1 | 2006-01-03 → 2006-12-29 | 0.09 | 0.09 |
| 2 | 2007-01-03 → 2007-12-31 | -0.24 | 0.55 |
| 3 | 2008-01-02 → 2008-12-31 | -1.81 | -1.34 |
| 4 | 2009-01-02 → 2009-12-31 | -0.75 | 1.27 |
| 5 | 2010-01-04 → 2010-12-31 | 0.67 | 0.67 |
| 6 | 2011-01-03 → 2011-12-30 | -0.54 | -0.44 |
| 7 | 2012-01-03 → 2012-12-31 | 0.75 | 0.75 |
| 8 | 2013-01-02 → 2013-12-31 | 1.92 | 1.92 |
| 9 | 2014-01-02 → 2014-12-31 | 0.84 | 0.84 |
| 10 | 2015-01-02 → 2015-12-31 | -0.06 | 0.48 |
| 11 | 2016-01-04 → 2016-12-30 | 0.65 | 0.65 |
| 12 | 2017-01-03 → 2017-12-29 | 1.29 | 1.29 |
| 13 | 2018-01-02 → 2018-12-31 | -0.28 | 0.10 |
| 14 | 2019-01-02 → 2019-12-31 | 1.34 | 1.34 |
| 15 | 2020-01-02 → 2020-12-31 | -0.68 | 0.70 |
| 16 | 2021-01-04 → 2021-12-31 | 0.94 | 1.23 |
| 17 | 2022-01-03 → 2022-12-30 | -2.27 | -0.13 |
| 18 | 2023-01-03 → 2023-12-29 | 1.32 | 1.32 |
| 19 | 2024-01-02 → 2024-12-31 | 0.81 | 1.05 |
| 20 | 2025-01-02 → 2025-12-31 | 0.75 | 0.94 |
2.3 Search accounting
No search record exists for this design. It was not promoted from a recorded evolving search, so the number of alternatives tried before it, on paper, in another tool, or in the author's head, is unknown. Unknown is a different fact from one: a study with no lineage is not a strategy with one trial, it is a strategy with an unrecorded number of them. Accordingly no count of alternatives tried is claimed, and nothing in this paper is corrected for a search that was never recorded; the number that stands is the raw out-of-sample result plus this disclosure. The registered per-step record below (§4) still guarantees each window's hypothesis was hashed and registered before that window was scored.
2.4 The comparison
Both arms trade the same registered windows, so their returns can be PAIRED: inside each window the two return series are inner-joined date by date and the difference rArm A − rArm B is the object under test. Because this is ONE pre-declared contrast, frozen at registration before any window was scored, the paired statistic needs no multiple-testing deflation, and the per-arm pooled numbers above are likewise uncorrected, this design has no recorded search to correct against (§2.3). The paired contrast carries that gap differently from the arm levels: it was declared before each window ran and it is scored on the difference, so no window could be read first and scored after. What the timestamps cannot speak to is how this contrast came to be the declared one, which is the limit §2.3 states.
| # | Window | Paired bars | Arm A | Arm B | Δ | Leader |
|---|---|---|---|---|---|---|
| 1 | 2006-01-04 → 2006-12-29 | 250 | -0.5% | -0.5% | +0.0 pp | tie |
| 2 | 2007-01-04 → 2007-12-31 | 250 | -7.2% | +10.7% | -17.9 pp | Arm B |
| 3 | 2008-01-03 → 2008-12-31 | 252 | -37.5% | -52.4% | +14.9 pp | Arm A |
| 4 | 2009-01-05 → 2009-12-31 | 251 | -9.6% | +41.6% | -51.1 pp | Arm B |
| 5 | 2010-01-05 → 2010-12-31 | 251 | +15.9% | +15.9% | +0.0 pp | tie |
| 6 | 2011-01-04 → 2011-12-30 | 251 | -10.9% | -16.9% | +6.0 pp | Arm A |
| 7 | 2012-01-04 → 2012-12-31 | 249 | +13.5% | +13.5% | +0.0 pp | tie |
| 8 | 2013-01-03 → 2013-12-31 | 251 | +37.5% | +37.5% | +0.0 pp | tie |
| 9 | 2014-01-03 → 2014-12-31 | 251 | +15.6% | +15.6% | +0.0 pp | tie |
| 10 | 2015-01-05 → 2015-12-31 | 251 | -2.4% | +7.5% | -9.9 pp | Arm B |
| 11 | 2016-01-05 → 2016-12-30 | 251 | +10.3% | +10.3% | +0.0 pp | tie |
| 12 | 2017-01-04 → 2017-12-29 | 250 | +20.8% | +20.8% | +0.0 pp | tie |
| 13 | 2018-01-03 → 2018-12-31 | 250 | -7.8% | -0.3% | -7.5 pp | Arm B |
| 14 | 2019-01-03 → 2019-12-31 | 251 | +19.4% | +19.4% | +0.0 pp | tie |
| 15 | 2020-01-03 → 2020-12-31 | 252 | -8.5% | +22.0% | -30.6 pp | Arm B |
| 16 | 2021-01-05 → 2021-12-31 | 251 | +24.8% | +36.1% | -11.3 pp | Arm B |
| 17 | 2022-01-04 → 2022-12-30 | 250 | -41.2% | -10.9% | -30.3 pp | Arm B |
| 18 | 2023-01-04 → 2023-12-29 | 249 | +27.7% | +27.7% | +0.0 pp | tie |
| 19 | 2024-01-03 → 2024-12-31 | 251 | +17.6% | +25.1% | -7.4 pp | Arm B |
| 20 | 2025-01-03 → 2025-12-31 | 249 | +17.1% | +26.6% | -9.6 pp | Arm B |
Paired Sharpe of the difference track: -0.49 · block bootstrap (2000 paths, block 10, seed 1234): P(Arm A beats Arm B) = 0.8%.
Window win-rate. Arm A led 2 of 20 windows (10.0%), Arm B led 9, and 9 windows were ties, and the mean window gap of -7.73 pp points the same way. Widest single window: 2009 at -51.1 pp.
| Period | Windows | Arm A | Arm B | Mean gap | Arm A led |
|---|---|---|---|---|---|
| All windows | 20 | +4.73% | +12.46% | -7.73 pp | 2/20 |
| Before 2010 | 4 | -13.70% | -0.15% | -13.55 pp | 1/4 |
| 2010 onward | 16 | +9.34% | +15.62% | -6.28 pp | 1/16 |
3 The circuit
The strategy is a circuit of platform primitives, frozen when the study is registered. Below is the circuit as wired on the canvas, the objective it encodes and how the search runs through it, followed by the mathematics each primitive actually computes, the same formulas the execution engine runs. The complete parameterisation is preserved in the study ledger (Appendix A).
The sentence below is the registration record, generated when the circuit was sealed and printed verbatim; the authored description of the design is Section 1.
A COMPARATIVE study, Arm A vs Arm B, walked on the same registered out-of-sample windows. Arm A: S&P 500, rebalanced quarterly across the selected basket, and run out-of-sample from the anchor, whatever the design estimates from history is re-estimated at each anchor from pre-anchor data only, and the walk advances through registered out-of-sample windows; its disposition is the realized forward path versus the benchmark. Arm B: S&P 500, rebalanced quarterly across the selected basket, and run out-of-sample from the anchor, whatever the design estimates from history is re-estimated at each anchor from pre-anchor data only, and the walk advances through registered out-of-sample windows; its disposition is the realized forward path versus the benchmark. The arms differ in: VIX Cut, removed in Arm B. The contrast under test: whether Arm A generates better risk-adjusted returns than Arm B over the identical out-of-sample windows.
Envelopes show counts, ratios, dates, and the parameters the author chose. Full price and per-name data series are not republished: the underlying market data is licensed to QuanterLab. Point figures quoted in the prose, a named holding's return over a stated span, are summary facts derived from public market prices, not redistributed series.
The objective and the search
Arm A
| Universe | S&P 500 index constituents. |
|---|---|
| Validation & out-of-sample | portfolio forward test (buy-and-hold book) (1y horizon from the anchor, quarterly rebalance); overlays: VIX Cut. |
| Other components | Factor models: Factor Composite, Factor Select, Fundamentals Loader (PIT), Momentum Factor. |
Arm B
| Validation & out-of-sample | portfolio forward test (buy-and-hold book) (1y horizon from the anchor, quarterly rebalance). |
|---|
Every other specification row is identical to Arm A's table above.
What differs between the arms, one difference; the comparison is clean:
- removedVIX Cut, removed in Arm B
Everything else is held identical, so an out-of-sample gap between the arms is attributable to this one change.
No transaction-cost elements are wired into this circuit; results are gross of costs.
Show the mathematics, 9 primitives, formulas and parity notes
3.1 Universe
The starting set of tickers, resolved point-in-time from the index change-log, so names delisted or removed later still compete on the dates they traded.
Before any math, you need a list of stocks. An index preset (S&P 500, Nasdaq-100, Dow 30) is reconstructed as it stood ON your anchor date by replaying the historical add/drop change-log backwards, so a 2018 backtest sees the 2018 membership, not today's winners.
Start from today's constituents and un-apply every membership change after the anchor t:
\mathcal{U}(t) = \mathcal{U}_{\text{now}} \;\ominus\; \{\text{adds after } t\} \;\oplus\; \{\text{drops after } t\}3.2 Price Loader
Bulk OHLCV fetch for the whole universe, point-in-time, no future bars.
Momentum, volatility, trend, every price-based metric needs history. This loads open/high/low/close/volume for all names in parallel, clipped so nothing after the anchor can leak in. The lookback window is derived automatically from the deepest metric you wired.
It loads exactly enough history for the hungriest downstream metric plus a warm-up buffer:
W = \max_k(\text{lookback}_k) + \text{buffer}, \qquad \text{bars} \le \text{anchor } t3.3 Factor Loader
Point-in-time fundamentals, never let the user see a number before the SEC did.
Loads ~23 fundamental metrics (valuation, quality, growth) per name, but with one inviolable rule: a financial statement becomes visible only on or after its SEC acceptedDate. A 2020 backtest sees only what was actually filed by 2020, no look-ahead, ever.
\text{visible}(f, t) \iff \text{acceptedDate}(f) \le t3.4 Factor Momentum
Momentum, recent price strength, no filing required.
Pure price-based: 1/3/6/12-month returns measured at the anchor. Because it needs no financial statement, it is always available, even for names with thin fundamentals.
\text{Mom}_i = \frac{\sum_k \omega_k\, z\!\big(R_{i}^{(k)}\big)}{\sum_k \omega_k}, \quad R^{(k)} = \frac{P_{\mathrm{near}}}{P_{t-k}}-13.5 Factor Composite
The weighting console, blend Value, Quality, Momentum, Growth into one 0–100 score.
Where the four factor families become a single ranking. Each family score is standardized across the universe, blended with your slider weights (or the radar's suggested tilt), and min-max scaled to 0–100. Winsorizing tames outliers; z-score or percentile normalization is your choice.
z_{i,f} = \frac{x_{i,f} - \bar x_f}{s_f}\quad(\text{clipped at the 1st / 99th percentile})C_i = \sum_f W_f\,z_{i,f}, \qquad \text{score}_i = 100\cdot\frac{C_i - \min_j C_j}{\max_j C_j - \min_j C_j}3.6 Factor Top Tier
The cut out of the factor lane, keep the top-ranked names.
Takes the composite-ranked factor set and keeps the best N, carrying the composite score, the four family scores and the point-in-time market cap for each survivor. Feed 10–20 to a direct portfolio, or 30–100 as an optimizer pool.
\{\, i : \operatorname{rank}(C_i) \le N\,\}, \quad C_i = \text{composite score}3.7 Portfolio Backtest
Replay the portfolio forward, rebalanced, point-in-time.
Holds the basket and rebalances on schedule, re-selecting and re-optimizing point-in-time at each rebalance (so it only ever uses information available then), and reports the equity curve, Sharpe, drawdown and trade stats, optionally net of cost and risk overlays.
E_t = E_{t-1}\big(1 + \mathbf w_{t}^{\top}\mathbf r_t - \text{costs}_t\big)\text{DD}_t = \frac{E_t}{\max_{\tau\le t}E_\tau} - 1, \qquad \text{MaxDD} = \min_t \text{DD}_t\text{charge}_t \;=\; \text{loan}_t \cdot \frac{\text{spread}}{252}, \qquad \text{loan}_t = \begin{cases}\max(0,\,-\text{cash}_t) & \text{institutional (netted)}\\ \max(0,\,\text{long MV}_t - E_t) & \text{retail (no netting)}\end{cases}3.8 Vix Cut
Risk-off switch, go to cash when fear spikes.
Liquidates the book when the VIX exceeds a threshold, a blunt but effective way to step aside in a market panic. An overlay on the forward tester.
\text{liquidate if}\quad \text{VIX}_t > v_{\text{cut}}3.9 Portfolio Forward Autopsy
The post-mortem, where the forward test’s return actually came from.
Runs after the Portfolio Forward Test and dissects its realized path: per-rebalance contributions, winners and losers, exposure and cash periods, and how the realized route compares to what the risk cones projected. It computes nothing new about the future, it explains the past the book just lived.
Depth I–IV: headline attribution, per-segment breakdown, per-name contributions, and the calibration ledger (projected cone vs realized, segment by segment). In a study, this is the node that fills the appendices.
4 Discussion
4.1 Findings
THE HEADLINE. Over twenty out-of-sample years the protected arm compounds at 2.5% a year against 10.0% for the unprotected arm, a gap of 7.5 percentage points annualised. Pooled out-of-sample Sharpe is 0.225 with the cut and 0.488 without, on 5,012 daily observations. The paired difference series has a Sharpe of -0.49. A block bootstrap over 5,011 paired daily observations puts the probability that the protected arm outperforms at 0.8%. On this evidence the VIX cut does not merely fail to help; it is the single largest destroyer of return in the strategy.
THE RULE IS INERT MOST OF THE TIME. In nine of the twenty windows the VIX never crosses 30 and the two arms are byte-identical, producing the same return to the decimal. The entire result therefore rests on the eleven windows in which the rule actually fired. Reporting this as "twenty windows of evidence" would overstate the sample by nearly half, and any reader weighing the strength of the conclusion should weigh eleven.
OF THE ELEVEN, IT HELPS IN TWO. The cut improves the outcome in 2008 (-37.5% against -52.4%, a gain of 14.9 points) and marginally in 2011 (-10.9% against -16.9%, a gain of 6.0 points). In the other nine it costs between 7.5 and 51.1 points.
2008 AND 2009 ARE ONE EVENT. The rule's only decisive success is immediately undone by its worst failure. In 2008 it held the book in cash 46.6% of the year and saved 14.9 points against an arm that lost more than half its value. In 2009 it held the book in cash 83.7% of the year and returned -9.6% while the unprotected arm returned +41.6%, a loss of 51.1 points, the largest single-window gap in the study. Treating these as two independent observations flatters the rule badly. They are the two halves of one crisis, and across the pair the cut is 36 points behind.
IT LOWERS VOLATILITY AND DESTROYS RETURN. The 2022 window is the cleanest demonstration. The cut fired four times, held the book in cash 52.6% of the year, and reduced realised volatility from 37.2% to 22.5%. Over the same window it turned a 10.9% loss into a 41.2% loss. The rule delivered precisely the risk reduction it advertises while removing the recovery days that carry momentum's returns. A reader who judges the overlay on volatility alone would conclude it works.
WHIPSAW IS THE FAILURE MODE, NOT LATENCY. In 2022 the VIX crossed 30 on four separate occasions, 25 January at 31.2, 23 February at 31.0, 26 April at 33.5 and 26 September at 32.3, in a year when the index oscillated around the threshold rather than spiking through it. Each crossing cut the book after a drawdown and each retreat below 22 returned it after a recovery. The rule did not fire late; it fired repeatedly, and each firing was a round trip paid at the worst two points of the cycle.
THE SHAPE OF THE CRISIS DECIDES THE OUTCOME. Comparing the three high-volatility episodes: 2008 was a persistent, grinding high-volatility regime and the cut earned 14.9 points. 2020 was a sharp spike with a near-vertical recovery, the cut fired on 27 February, held cash 69.6% of the year, and lost 30.6 points. 2022 was a sawtooth and cost 30.3 points. The rule pays only when high volatility persists long enough that being absent is genuinely correct, and it is punished whenever volatility spikes and mean-reverts. Nothing in a VIX level distinguishes these cases at the moment of crossing.
4.2 Interpretation
This study lands squarely in an unresolved argument. Barroso and Santa-Clara (2015) show that scaling a momentum book by its own realised volatility roughly halves crash risk and materially raises Sharpe, and Moreira and Muir (2017) extend volatility management across factors and find it pays broadly. Against that, Cederburg, O'Doherty, Wang and Yan (2020) test volatility-managed strategies out of sample across a wide set of factors and find that the gains largely fail to survive. The result here is an unambiguous data point for the sceptical side, but the reason matters more than the direction, because it identifies which part of the volatility management idea is doing the damage.
The successful versions in the literature scale exposure continuously by realised volatility. The rule tested here is binary and triggered by a forward-looking implied index. Those are not the same intervention. A continuous scaler reduces position size as volatility rises and restores it as volatility falls, holding some exposure throughout and never facing a re-entry decision. A binary cut with hysteresis holds either everything or nothing and must decide, at a threshold, when to return. In 2009 that decision cost 51 points. The evidence here is therefore not that volatility carries no information, Arm A's realised volatility was genuinely and substantially lower, but that a discrete on/off rule converts that information into a market-timing bet, and the timing bet loses.
Daniel and Moskowitz (2016) explain why momentum in particular is hostile to this mechanism. Momentum crashes occur in panic states and, critically, during the market's rebound from them, when the loser portfolio's beta is extreme and prior losers rally violently. The dangerous period is not the drawdown but the recovery. A VIX rule is built to be out of the market precisely during the panic and, through its resume threshold, to remain out through the early part of the rebound. It is structurally positioned to miss the exact window in which a momentum book earns back its crisis losses. The 2008-2009 pair in this study is that argument rendered in numbers: 14.9 points saved during the panic, 51.1 points forgone in the recovery.
Cooper, Gutierrez and Hameed (2004) offer the closest thing to a defence of the approach, finding that momentum profits are conditional on market state and disappear following down markets. That is a real conditioning result, but it conditions on the sign of a trailing multi-year market return, not on a volatility index crossing a level. The distinction is exactly the one this study surfaces: the shape and persistence of a volatility episode determines whether absence is correct, and the VIX level at the moment of crossing does not encode that. In 2008 volatility persisted and absence was right. In 2020 volatility spiked and reverted within weeks and absence was catastrophic. Both crossings looked identical to the rule.
There is also a lesson about study design that is worth stating plainly. This walk was first registered from a 2011 anchor by mistake. That window contains 2020 and 2022, both cases where the cut fails badly, and none of 2008. A study run from 2011 would have produced the same directional conclusion for entirely the wrong reason, and would have had no way to observe the one regime in which the rule genuinely works or the recovery that undoes it. The 2006 anchor is what makes the mechanism visible rather than merely the verdict. Researchers testing crisis-contingent rules should choose the sample by which crises it must contain, not by convenience.
What would follow from this? The natural next tests are a continuous volatility scaler in place of the binary cut, which is the construction the supportive literature actually uses; an asymmetric rule that re-enters far faster than it exits, on the reasoning that the cost is concentrated in the recovery rather than the exit; and a version with transaction costs modelled, which this study omits and which would penalise the protected arm further. Each is a single-node change to this circuit and can be run against the identical twenty sealed windows, which is the point of registering the walk this way.
The practical conclusion for an investor is narrow and firm. On a long-only, concentrated, quarterly-rebalanced S&P 500 momentum book over 2006 to 2026, a VIX 30/22 circuit breaker reduced volatility by roughly a third and cost 7.5 percentage points of annual return, with a 0.8% bootstrap probability of having helped. The intuition that buying protection in panics is prudent is not wrong about the panic. It is wrong about what happens next.
No search record exists for this study: the design was not promoted from a recorded evolving search, so the number of alternatives tried before it is UNKNOWN, which is a different fact from one. No count of alternatives tried is claimed, and nothing is corrected for a search that was never recorded; the number that stands is the raw out-of-sample result plus this disclosure. The out-of-sample windows are historical.
4.3 Limitations
GROSS OF COSTS, AND THE BIAS RUNS AGAINST THE CONCLUSION'S FAVOUR. No transaction-cost overlay is wired, so neither arm pays spread, commission, slippage or market impact. This is not neutral between the arms: the protected arm liquidates and rebuilds a ten-name book at every threshold crossing, on top of the quarterly re-selection both arms pay. In 2022 that is four additional round trips of the entire portfolio. Charging realistic costs would widen the gap against the VIX cut, so the 7.5 point annual deficit reported here is, if anything, generous to the rule.
ONE THRESHOLD PAIR, NOT A SURFACE. The rule is tested at a single configuration: cut above 30, resume below 22. These were fixed before the study ran and never tuned, which protects the result from selection bias but also means the study speaks to this rule rather than to volatility gating in general. A higher cut threshold, a faster re-entry, or a partial rather than binary de-risking might behave differently, and this design cannot say by how much. The finding is that this rule fails, not that no such rule can work.
ELEVEN EFFECTIVE WINDOWS. Nine of the twenty windows never trigger the rule and carry no information about it. Eleven is a small sample for a conclusion about crisis behaviour, and it contains only three genuine volatility crises.
NO SEARCH RECORD, SO NO DEFLATED SHARPE. This design was not promoted from a recorded evolving search, so the number of alternatives tried before it is unknown rather than one. No deflated Sharpe ratio is claimed. The honest statement is the raw out-of-sample result together with this disclosure.
CONCENTRATION AND LONG-ONLY CONSTRUCTION. The book holds ten equal-weighted names, which is far more concentrated than the decile portfolios of the academic momentum literature and carries substantial idiosyncratic risk in every window. The strategy is also long only, so it omits the short leg where Daniel and Moskowitz locate most of momentum's crash risk. Results should not be read as a replication of published momentum premia.
THE PROJECTION-CALIBRATION RECORD DOES NOT SPEAK TO THE VARIABLE, AND IS OMITTED. The forward tester fits a Monte Carlo cone and a VaR estimate before each rebalance and scores them against the outcome. In this study that record is IDENTICAL across the two arms, to the integer, and the reason is structural rather than a coincidence worth reading into: the projection is fitted on the SELECTED BASKET, and both arms select identically, the VIX cut acts afterwards, on exposure. So the record measures the accuracy of the selection's projections and is silent on the overlay, which is the one thing this paper is about. It is therefore computed but not featured, and the computed-not-featured ledger records that choice. Reported for completeness: 80 scored rebalances per arm, 86.2% band coverage against an expected 90%, and a 6.77% VaR breach rate against an expected 5%, both properties of the basket, not of either arm's book. A calibration record that follows the exposure actually held is a separate measurement and would require re-running the walk.
PRICE RETURNS ONLY. Both the book and the benchmark exclude dividends. Over a twenty-year horizon this understates absolute returns for both arms roughly equally, but it is not exactly neutral for an arm that spends large fractions of some years in cash.
THE ONE-MONTH HORIZON IS INCLUDED. The composite weights the trailing one-month return equally with the longer horizons. The reversal literature finds this horizon predicts negatively at the cross-section, so its inclusion is likely a drag on both arms. Because both arms share it, the comparison is unaffected, but the absolute level of both is lower than a conventional 12-1 construction would produce.
Computed, not featured
The run produced the results below. The author chose not to feature them in this paper; they were computed all the same, are part of the frozen record, and are reproducible from the study's frozen circuit.
- Projection calibration, 160 rebalance projections, 9,902 VaR days. The forward tester itself. Every portfolio backtest fits a Monte Carlo cone and a VaR estimate before each rebalance and scores them against what happened, it is instrumentation on the test, not a primitive on the canvas. No Monte Carlo primitive is required, and adding one would be a separate, standalone analysis.
References
- Gelman, A., & Loken, E. (2013). The garden of forking paths: Why multiple comparisons can be a problem, even when there is no “fishing expedition.” Working paper, Columbia University.
- Harvey, C. R., Liu, Y., & Zhu, H. (2016). … and the Cross-Section of Expected Returns. Review of Financial Studies, 29(1), 5–68. doi:10.1093/rfs/hhv059
- Lo, A. W. (2002). The Statistics of Sharpe Ratios. Financial Analysts Journal, 58(4), 36–52. doi:10.2469/faj.v58.n4.2453
- Jegadeesh, N. and Titman, S. (1993). "Returns to Buying Winners and Selling Losers: Implications for Stock Market Efficiency." Journal of Finance 48(1), 65-91. The origin of the cross-sectional momentum strategy tested here.
- Daniel, K. and Moskowitz, T. J. (2016). "Momentum Crashes." Journal of Financial Economics 122(2), 221-247. Locates momentum’s left tail in panic states and the rebounds that follow them, the mechanism behind this study’s 2008-2009 pair.
- Barroso, P. and Santa-Clara, P. (2015). "Momentum Has Its Moments." Journal of Financial Economics 116(1), 111-120. Scaling momentum by its own realised volatility halves crash risk; the continuous analogue of the binary rule tested here.
- Moreira, A. and Muir, T. (2017). "Volatility-Managed Portfolios." Journal of Finance 72(4), 1611-1644. Extends volatility management across factors and finds it pays.
- Cederburg, S., O’Doherty, M. S., Wang, F. and Yan, X. S. (2020). "On the Performance of Volatility-Managed Portfolios." Journal of Financial Economics 138(1), 95-117. Finds the gains largely fail out of sample; the counterweight to the two above.
- Cooper, M. J., Gutierrez, R. C. and Hameed, A. (2004). "Market States and Momentum." Journal of Finance 59(3), 1345-1365. Momentum profits are conditional on market state, the academic precedent for gating momentum exposure at all.
- Novy-Marx, R. (2012). "Is Momentum Really Momentum?" Journal of Financial Economics 103(3), 429-453. Argues the premium sits in intermediate-horizon past returns, which bears on this study’s equal weighting of the 1, 3, 6 and 12-month horizons.
- Goyal, A. and Wahal, S. (2015). "Is Momentum an Echo?" Journal of Financial and Quantitative Analysis 50(6), 1237-1262. International evidence against the echo interpretation; the controversy this study’s combined score sits inside.
- Jegadeesh, N. (1990). "Evidence of Predictable Behavior of Security Returns." Journal of Finance 45(3), 881-898. Short-horizon reversal, why including the one-month return with a positive sign is a known drag on both arms.
- Israel, R. and Moskowitz, T. J. (2013). "The Role of Shorting, Firm Size, and Time on Market Anomalies." Journal of Financial Economics 108(2), 275-301. Momentum survives long-only implementation at reduced size, relevant to this book’s construction.
- Whaley, R. E. (2009). "Understanding the VIX." Journal of Portfolio Management 35(3), 98-105. What the index measures and what it does not, the basis for reading a threshold crossing as a signal about the future rather than the recent past.
- Bailey, D. H. and López de Prado, M. (2014). "The Deflated Sharpe Ratio: Correcting for Selection Bias, Backtest Overfitting and Non-Normality." Journal of Portfolio Management 40(5), 94-107. Why no deflated Sharpe is claimed without a search record.
Appendix A Reproducibility in QuanterLab
Each step is backed by a frozen run report. The study is re-derivable from the ledger below.
| # | Commit | Report | Anchor | OOS window |
|---|---|---|---|---|
| 1 | 203e7ae4468b | 444 | 2006-01-01 | 2006-01-03 → 2006-12-29 |
| 2 | 0239a6609b05 | 445 | 2007-01-01 | 2007-01-03 → 2007-12-31 |
| 3 | a4cb3ce259c7 | 446 | 2008-01-01 | 2008-01-02 → 2008-12-31 |
| 4 | fac497d877fc | 447 | 2009-01-01 | 2009-01-02 → 2009-12-31 |
| 5 | c6388de6937b | 448 | 2010-01-01 | 2010-01-04 → 2010-12-31 |
| 6 | 697b96bbdbd5 | 449 | 2011-01-01 | 2011-01-03 → 2011-12-30 |
| 7 | aa15e88466fa | 450 | 2012-01-01 | 2012-01-03 → 2012-12-31 |
| 8 | 462f4358beaf | 451 | 2013-01-01 | 2013-01-02 → 2013-12-31 |
| 9 | 15add0943567 | 452 | 2014-01-01 | 2014-01-02 → 2014-12-31 |
| 10 | 0b308d4b22df | 453 | 2015-01-01 | 2015-01-02 → 2015-12-31 |
| 11 | af89f3002126 | 454 | 2016-01-01 | 2016-01-04 → 2016-12-30 |
| 12 | c8e669665eb9 | 455 | 2017-01-01 | 2017-01-03 → 2017-12-29 |
| 13 | 6426ab562d7c | 456 | 2018-01-01 | 2018-01-02 → 2018-12-31 |
| 14 | 47f3316125ef | 457 | 2019-01-01 | 2019-01-02 → 2019-12-31 |
| 15 | 41860298994b | 458 | 2020-01-01 | 2020-01-02 → 2020-12-31 |
| 16 | 4b1604710b1c | 459 | 2021-01-01 | 2021-01-04 → 2021-12-31 |
| 17 | 774c622a2385 | 460 | 2022-01-01 | 2022-01-03 → 2022-12-30 |
| 18 | 710c0fba1255 | 461 | 2023-01-01 | 2023-01-03 → 2023-12-29 |
| 19 | caf865eae653 | 462 | 2024-01-01 | 2024-01-02 → 2024-12-31 |
| 20 | b98738f6dfc2 | 463 | 2025-01-01 | 2025-01-02 → 2025-12-31 |
Appendix A2 Registration record
What this record does and does not establish. Every window in this study is historical: the data existed before the study began, so this is sequential sealing on past windows, not pre-registration in the clinical-trial sense, and no procedure could make it so. What the platform does enforce is order, each step's specification was frozen and hashed before that step was scored, and the walk cannot advance past a step that was never run or close one with a result registered for a different window. The two timestamp columns below are the evidence: read them together and each seal precedes its own run, and each run precedes the next seal. A study whose seals all post-date its runs would show it here. Wall-clock spacing between seals varies with the author's schedule and queue latency; the ordering, not the tempo, is the claim.
“A COMPARATIVE study, Arm A vs Arm B, walked on the same registered out-of-sample windows. Arm A: S&P 500, rebalanced quarterly across the selected basket, and run out-of-sample from the anchor, whatever the design estimates from history (covariance, expected returns, rankings) is re-estimated at each anchor from pre-anchor data only, and the walk advances through registered out-of-sample windows; its disposition is the realized forward path versus the benchmark. Arm B: S&P 500, rebalanced quarterly across the selected basket, and run out-of-sample from the anchor, whatever the design estimates from history (covariance, expected returns, rankings) is re-estimated at each anchor from pre-anchor data only, and the walk advances through registered out-of-sample windows; its disposition is the realized forward path versus the benchmark. The arms differ in: VIX Cut, removed in Arm B. The contrast under test: whether Arm A generates better risk-adjusted returns than Arm B over the identical out-of-sample windows.”
The same hypothesis was registered independently at every step, hashed before each step's out-of-sample window was scored:
| # | Anchor | Registered at (UTC) | Run completed (UTC) |
|---|---|---|---|
| 1 | 2006-01-01 | 2026-08-02 12:47:42 | 2026-08-02 13:09:03 |
| 2 | 2007-01-01 | 2026-08-02 13:09:03 | 2026-08-02 13:20:44 |
| 3 | 2008-01-01 | 2026-08-02 13:20:44 | 2026-08-02 13:26:05 |
| 4 | 2009-01-01 | 2026-08-02 13:26:05 | 2026-08-02 13:32:26 |
| 5 | 2010-01-01 | 2026-08-02 13:32:26 | 2026-08-02 13:38:26 |
| 6 | 2011-01-01 | 2026-08-02 13:38:26 | 2026-08-02 13:44:07 |
| 7 | 2012-01-01 | 2026-08-02 13:44:07 | 2026-08-02 13:49:28 |
| 8 | 2013-01-01 | 2026-08-02 13:49:28 | 2026-08-02 13:56:28 |
| 9 | 2014-01-01 | 2026-08-02 13:56:29 | 2026-08-02 14:02:49 |
| 10 | 2015-01-01 | 2026-08-02 14:02:49 | 2026-08-02 14:09:31 |
| 11 | 2016-01-01 | 2026-08-02 14:09:31 | 2026-08-02 14:15:33 |
| 12 | 2017-01-01 | 2026-08-02 14:15:33 | 2026-08-02 14:22:35 |
| 13 | 2018-01-01 | 2026-08-02 14:22:35 | 2026-08-02 14:29:16 |
| 14 | 2019-01-01 | 2026-08-02 14:29:16 | 2026-08-02 14:35:57 |
| 15 | 2020-01-01 | 2026-08-02 14:35:57 | 2026-08-02 14:41:37 |
| 16 | 2021-01-01 | 2026-08-02 14:41:37 | 2026-08-02 14:48:38 |
| 17 | 2022-01-01 | 2026-08-02 14:48:38 | 2026-08-02 14:54:59 |
| 18 | 2023-01-01 | 2026-08-02 14:54:59 | 2026-08-02 15:01:22 |
| 19 | 2024-01-01 | 2026-08-02 15:01:22 | 2026-08-02 15:06:43 |
| 20 | 2025-01-01 | 2026-08-02 15:06:43 | 2026-08-02 15:13:04 |
Appendix B Per-step diagnostics
Realized in the projection tables below is the risk engine scoring its own forecast: the buy-and-hold return of the segment that followed each rebalance, on the same gross basis the cone was projected on. It is deliberately not the charged, calendar-window total return the study’s tables print, so the two will not reconcile line by line; the cone and its outcome share one basis, which is what a calibration test requires. Each row names its segment’s span so a boundary session is visible.
Names held is the union across the window: the count of distinct instruments the book touched between the window’s first and last session, not the number it held at one time. A book that rotates monthly touches more names than it holds.
What each step's run actually did beyond its return: capital allocation across lanes and regimes, the portfolio book's rebalancing and cost drag, and how positions were sized. Harvested from the frozen run reports, present where the circuit produced them.
Open the full per-step grid (20 steps: every rebalance, capital routing and sizing, per window)
Step 1 · 2006-01-03 → 2006-12-29
Arm A
Portfolio book, rebalanced quarterly · 5 constructions · 49 names held · selection: reselect · 0.0% in cash · turnover 5.3× · 13 names dropped at load (62 selected, 49 held across the window), weights renormalised onto the rest
Projection accuracy, realized outcome fell inside the P5–P95 cone in 75.0% of 4 scored rebalances (a well-calibrated 90% band contains ~90.0%) · 95% VaR breached on 9.72% of 247 days (expected ~5.0%)
| Rebalance | P5 | Median | P95 | Realized | In band | VaR 95 (1d) | Breaches |
|---|---|---|---|---|---|---|---|
| 2006-01-01 → 2006-04-01 | -5.6711% | 8.7259% | 26.96% | 18.7356% | yes | 1.8155% | 3 / 61 |
| 2006-04-01 → 2006-07-01 | -9.5465% | 8.3469% | 29.9161% | -13.1691% | no | 2.2576% | 9 / 62 |
| 2006-07-01 → 2006-10-01 | -6.9501% | 9.0459% | 27.9096% | -3.9465% | yes | 2.0156% | 5 / 62 |
| 2006-10-01 → 2007-01-01 | -3.0828% | 7.4064% | 19.1019% | -0.4185% | yes | 1.1043% | 7 / 62 |
| 2007-01-01 | no segment follows this rebalance, not scored | ||||||
Arm B
Portfolio book, rebalanced quarterly · 5 constructions · 49 names held · selection: reselect · 0.0% in cash · 13 names dropped at load (62 selected, 49 held across the window), weights renormalised onto the rest
Projection accuracy, realized outcome fell inside the P5–P95 cone in 75.0% of 4 scored rebalances (a well-calibrated 90% band contains ~90.0%) · 95% VaR breached on 9.72% of 247 days (expected ~5.0%)
| Rebalance | P5 | Median | P95 | Realized | In band | VaR 95 (1d) | Breaches |
|---|---|---|---|---|---|---|---|
| 2006-01-01 → 2006-04-01 | -5.6711% | 8.7259% | 26.96% | 18.7356% | yes | 1.8155% | 3 / 61 |
| 2006-04-01 → 2006-07-01 | -9.5465% | 8.3469% | 29.9161% | -13.1691% | no | 2.2576% | 9 / 62 |
| 2006-07-01 → 2006-10-01 | -6.9501% | 9.0459% | 27.9096% | -3.9465% | yes | 2.0156% | 5 / 62 |
| 2006-10-01 → 2007-01-01 | -3.0828% | 7.4064% | 19.1019% | -0.4185% | yes | 1.1043% | 7 / 62 |
| 2007-01-01 | no segment follows this rebalance, not scored | ||||||
Step 2 · 2007-01-03 → 2007-12-31
Arm A
Portfolio book, rebalanced quarterly · 5 constructions · 50 names held · selection: reselect · 9.6% in cash · turnover 9.4× · 9 names dropped at load (59 selected, 50 held across the window), weights renormalised onto the rest
Projection accuracy, realized outcome fell inside the P5–P95 cone in 75.0% of 4 scored rebalances (a well-calibrated 90% band contains ~90.0%) · 95% VaR breached on 12.96% of 247 days (expected ~5.0%)
| Rebalance | P5 | Median | P95 | Realized | In band | VaR 95 (1d) | Breaches |
|---|---|---|---|---|---|---|---|
| 2007-01-01 → 2007-04-01 | -5.9336% | 9.7075% | 26.1617% | 6.7673% | yes | 1.6983% | 5 / 60 |
| 2007-04-01 → 2007-07-01 | -5.8482% | 8.3658% | 24.8276% | 1.5929% | yes | 1.6134% | 5 / 62 |
| 2007-07-01 → 2007-10-01 | -5.4709% | 9.8518% | 27.7696% | 5.2996% | yes | 1.7704% | 10 / 62 |
| 2007-10-01 → 2008-01-01 | -6.7457% | 9.4828% | 26.7356% | -7.2494% | no | 1.7314% | 12 / 63 |
| 2008-01-01 | no segment follows this rebalance, not scored | ||||||
Arm B
Portfolio book, rebalanced quarterly · 5 constructions · 50 names held · selection: reselect · 0.0% in cash · 9 names dropped at load (59 selected, 50 held across the window), weights renormalised onto the rest
Projection accuracy, realized outcome fell inside the P5–P95 cone in 75.0% of 4 scored rebalances (a well-calibrated 90% band contains ~90.0%) · 95% VaR breached on 12.96% of 247 days (expected ~5.0%)
| Rebalance | P5 | Median | P95 | Realized | In band | VaR 95 (1d) | Breaches |
|---|---|---|---|---|---|---|---|
| 2007-01-01 → 2007-04-01 | -5.9336% | 9.7075% | 26.1617% | 6.7673% | yes | 1.6983% | 5 / 60 |
| 2007-04-01 → 2007-07-01 | -5.8482% | 8.3658% | 24.8276% | 1.5929% | yes | 1.6134% | 5 / 62 |
| 2007-07-01 → 2007-10-01 | -5.4709% | 9.8518% | 27.7696% | 5.2996% | yes | 1.7704% | 10 / 62 |
| 2007-10-01 → 2008-01-01 | -6.7457% | 9.4828% | 26.7356% | -7.2494% | no | 1.7314% | 12 / 63 |
| 2008-01-01 | no segment follows this rebalance, not scored | ||||||
Step 3 · 2008-01-02 → 2008-12-31
Arm A
Portfolio book, rebalanced quarterly · 4 constructions · 46 names held · selection: reselect · 46.6% in cash · turnover 6.1× · 4 names dropped at load (50 selected, 46 held across the window), weights renormalised onto the rest
Projection accuracy, realized outcome fell inside the P5–P95 cone in 25.0% of 4 scored rebalances (a well-calibrated 90% band contains ~90.0%) · 95% VaR breached on 18.47% of 249 days (expected ~5.0%)
| Rebalance | P5 | Median | P95 | Realized | In band | VaR 95 (1d) | Breaches |
|---|---|---|---|---|---|---|---|
| 2008-01-01 → 2008-04-01 | -7.1626% | 9.7817% | 27.843% | -17.034% | no | 1.9698% | 11 / 60 |
| 2008-04-01 → 2008-07-01 | -11.9681% | 6.3827% | 26.4369% | 5.8398% | yes | 2.3508% | 1 / 63 |
| 2008-07-01 → 2008-10-01 | -12.6244% | 10.1217% | 35.9953% | -29.2969% | no | 2.6135% | 12 / 63 |
| 2008-10-01 → window end | -14.2329% | 3.5296% | 22.9203% | -24.3067% | no | 2.2185% | 22 / 63 |
Arm B
Portfolio book, rebalanced quarterly · 4 constructions · 59 names held · selection: reselect · 0.0% in cash · 4 names dropped at load (63 selected, 59 held across the window), weights renormalised onto the rest
Projection accuracy, realized outcome fell inside the P5–P95 cone in 25.0% of 4 scored rebalances (a well-calibrated 90% band contains ~90.0%) · 95% VaR breached on 18.47% of 249 days (expected ~5.0%)
| Rebalance | P5 | Median | P95 | Realized | In band | VaR 95 (1d) | Breaches |
|---|---|---|---|---|---|---|---|
| 2008-01-01 → 2008-04-01 | -7.1626% | 9.7817% | 27.843% | -17.034% | no | 1.9698% | 11 / 60 |
| 2008-04-01 → 2008-07-01 | -11.9681% | 6.3827% | 26.4369% | 5.8398% | yes | 2.3508% | 1 / 63 |
| 2008-07-01 → 2008-10-01 | -12.6244% | 10.1217% | 35.9953% | -29.2969% | no | 2.6135% | 12 / 63 |
| 2008-10-01 → window end | -14.2329% | 3.5296% | 22.9203% | -24.3067% | no | 2.2185% | 22 / 63 |
Step 4 · 2009-01-02 → 2009-12-31
Arm A
Portfolio book, rebalanced quarterly · 5 constructions · 16 names held · selection: reselect · 83.7% in cash · turnover 2.7× · 13 names dropped at load (29 selected, 16 held across the window), weights renormalised onto the rest
Projection accuracy, realized outcome fell inside the P5–P95 cone in 100.0% of 4 scored rebalances (a well-calibrated 90% band contains ~90.0%) · 95% VaR breached on 3.23% of 248 days (expected ~5.0%)
| Rebalance | P5 | Median | P95 | Realized | In band | VaR 95 (1d) | Breaches |
|---|---|---|---|---|---|---|---|
| 2009-01-01 → 2009-04-01 | -19.195% | 1.3654% | 24.5475% | -8.2351% | yes | 2.3079% | 8 / 60 |
| 2009-04-01 → 2009-07-01 | -21.1152% | 0.828% | 29.0592% | 4.1311% | yes | 2.554% | 0 / 62 |
| 2009-07-01 → 2009-10-01 | -45.9854% | -4.7965% | 59.6469% | 37.7637% | yes | 6.8133% | 0 / 63 |
| 2009-10-01 → 2010-01-01 | -40.9083% | 0.835% | 64.1716% | 13.7356% | yes | 6.339% | 0 / 63 |
| 2010-01-01 | no segment follows this rebalance, not scored | ||||||
Arm B
Portfolio book, rebalanced quarterly · 5 constructions · 52 names held · selection: reselect · 0.0% in cash · 13 names dropped at load (65 selected, 52 held across the window), weights renormalised onto the rest
Projection accuracy, realized outcome fell inside the P5–P95 cone in 100.0% of 4 scored rebalances (a well-calibrated 90% band contains ~90.0%) · 95% VaR breached on 3.23% of 248 days (expected ~5.0%)
| Rebalance | P5 | Median | P95 | Realized | In band | VaR 95 (1d) | Breaches |
|---|---|---|---|---|---|---|---|
| 2009-01-01 → 2009-04-01 | -19.195% | 1.3654% | 24.5475% | -8.2351% | yes | 2.3079% | 8 / 60 |
| 2009-04-01 → 2009-07-01 | -21.1152% | 0.828% | 29.0592% | 4.1311% | yes | 2.554% | 0 / 62 |
| 2009-07-01 → 2009-10-01 | -45.9854% | -4.7965% | 59.6469% | 37.7637% | yes | 6.8133% | 0 / 63 |
| 2009-10-01 → 2010-01-01 | -40.9083% | 0.835% | 64.1716% | 13.7356% | yes | 6.339% | 0 / 63 |
| 2010-01-01 | no segment follows this rebalance, not scored | ||||||
Step 5 · 2010-01-04 → 2010-12-31
Arm A
Portfolio book, rebalanced quarterly · 5 constructions · 50 names held · selection: reselect · 0.0% in cash · turnover 5.5× · 7 names dropped at load (57 selected, 50 held across the window), weights renormalised onto the rest
Projection accuracy, realized outcome fell inside the P5–P95 cone in 100.0% of 4 scored rebalances (a well-calibrated 90% band contains ~90.0%) · 95% VaR breached on 0.0% of 248 days (expected ~5.0%)
| Rebalance | P5 | Median | P95 | Realized | In band | VaR 95 (1d) | Breaches |
|---|---|---|---|---|---|---|---|
| 2010-01-01 → 2010-04-01 | -35.9838% | 2.6348% | 57.5967% | 9.3484% | yes | 5.8054% | 0 / 60 |
| 2010-04-01 → 2010-07-01 | -34.3395% | 5.7949% | 70.9344% | -16.1643% | yes | 5.8669% | 0 / 62 |
| 2010-07-01 → 2010-10-01 | -36.9463% | 4.2858% | 65.0189% | 15.0908% | yes | 5.3897% | 0 / 63 |
| 2010-10-01 → 2011-01-01 | -29.6911% | 8.4474% | 61.0221% | 8.1188% | yes | 5.0324% | 0 / 63 |
| 2011-01-01 | no segment follows this rebalance, not scored | ||||||
Arm B
Portfolio book, rebalanced quarterly · 5 constructions · 50 names held · selection: reselect · 0.0% in cash · 7 names dropped at load (57 selected, 50 held across the window), weights renormalised onto the rest
Projection accuracy, realized outcome fell inside the P5–P95 cone in 100.0% of 4 scored rebalances (a well-calibrated 90% band contains ~90.0%) · 95% VaR breached on 0.0% of 248 days (expected ~5.0%)
| Rebalance | P5 | Median | P95 | Realized | In band | VaR 95 (1d) | Breaches |
|---|---|---|---|---|---|---|---|
| 2010-01-01 → 2010-04-01 | -35.9838% | 2.6348% | 57.5967% | 9.3484% | yes | 5.8054% | 0 / 60 |
| 2010-04-01 → 2010-07-01 | -34.3395% | 5.7949% | 70.9344% | -16.1643% | yes | 5.8669% | 0 / 62 |
| 2010-07-01 → 2010-10-01 | -36.9463% | 4.2858% | 65.0189% | 15.0908% | yes | 5.3897% | 0 / 63 |
| 2010-10-01 → 2011-01-01 | -29.6911% | 8.4474% | 61.0221% | 8.1188% | yes | 5.0324% | 0 / 63 |
| 2011-01-01 | no segment follows this rebalance, not scored | ||||||
Step 6 · 2011-01-03 → 2011-12-30
Arm A
Portfolio book, rebalanced quarterly · 5 constructions · 51 names held · selection: reselect · 38.5% in cash · turnover 5.9× · 8 names dropped at load (59 selected, 51 held across the window), weights renormalised onto the rest
Projection accuracy, realized outcome fell inside the P5–P95 cone in 75.0% of 4 scored rebalances (a well-calibrated 90% band contains ~90.0%) · 95% VaR breached on 8.87% of 248 days (expected ~5.0%)
| Rebalance | P5 | Median | P95 | Realized | In band | VaR 95 (1d) | Breaches |
|---|---|---|---|---|---|---|---|
| 2011-01-01 → 2011-04-01 | -15.9051% | 15.015% | 61.8771% | 4.9252% | yes | 4.2092% | 0 / 61 |
| 2011-04-01 → 2011-07-01 | -15.045% | 15.2821% | 56.7131% | -5.846% | yes | 3.6646% | 0 / 62 |
| 2011-07-01 → 2011-10-01 | -8.6041% | 12.7895% | 36.6414% | -21.6024% | no | 2.329% | 14 / 63 |
| 2011-10-01 → 2012-01-01 | -11.0296% | 8.3856% | 32.1891% | 8.5507% | yes | 2.2143% | 8 / 62 |
| 2012-01-01 | no segment follows this rebalance, not scored | ||||||
Arm B
Portfolio book, rebalanced quarterly · 5 constructions · 51 names held · selection: reselect · 0.0% in cash · 8 names dropped at load (59 selected, 51 held across the window), weights renormalised onto the rest
Projection accuracy, realized outcome fell inside the P5–P95 cone in 75.0% of 4 scored rebalances (a well-calibrated 90% band contains ~90.0%) · 95% VaR breached on 8.87% of 248 days (expected ~5.0%)
| Rebalance | P5 | Median | P95 | Realized | In band | VaR 95 (1d) | Breaches |
|---|---|---|---|---|---|---|---|
| 2011-01-01 → 2011-04-01 | -15.9051% | 15.015% | 61.8771% | 4.9252% | yes | 4.2092% | 0 / 61 |
| 2011-04-01 → 2011-07-01 | -15.045% | 15.2821% | 56.7131% | -5.846% | yes | 3.6646% | 0 / 62 |
| 2011-07-01 → 2011-10-01 | -8.6041% | 12.7895% | 36.6414% | -21.6024% | no | 2.329% | 14 / 63 |
| 2011-10-01 → 2012-01-01 | -11.0296% | 8.3856% | 32.1891% | 8.5507% | yes | 2.2143% | 8 / 62 |
| 2012-01-01 | no segment follows this rebalance, not scored | ||||||
Step 7 · 2012-01-03 → 2012-12-31
Arm A
Portfolio book, rebalanced quarterly · 4 constructions · 60 names held · selection: reselect · 0.0% in cash · turnover 5.6× · 3 names dropped at load (63 selected, 60 held across the window), weights renormalised onto the rest
Projection accuracy, realized outcome fell inside the P5–P95 cone in 100.0% of 4 scored rebalances (a well-calibrated 90% band contains ~90.0%) · 95% VaR breached on 2.03% of 246 days (expected ~5.0%)
| Rebalance | P5 | Median | P95 | Realized | In band | VaR 95 (1d) | Breaches |
|---|---|---|---|---|---|---|---|
| 2012-01-01 → 2012-04-01 | -10.8271% | 7.1378% | 30.9023% | 8.2036% | yes | 2.2986% | 0 / 61 |
| 2012-04-01 → 2012-07-01 | -15.4307% | 7.8198% | 37.6568% | -7.7518% | yes | 2.9953% | 5 / 62 |
| 2012-07-01 → 2012-10-01 | -11.7939% | 7.4488% | 31.0397% | 7.2462% | yes | 2.2521% | 0 / 62 |
| 2012-10-01 → window end | -11.0764% | 8.3312% | 34.3806% | 4.7615% | yes | 2.3917% | 0 / 61 |
Arm B
Portfolio book, rebalanced quarterly · 4 constructions · 60 names held · selection: reselect · 0.0% in cash · 3 names dropped at load (63 selected, 60 held across the window), weights renormalised onto the rest
Projection accuracy, realized outcome fell inside the P5–P95 cone in 100.0% of 4 scored rebalances (a well-calibrated 90% band contains ~90.0%) · 95% VaR breached on 2.03% of 246 days (expected ~5.0%)
| Rebalance | P5 | Median | P95 | Realized | In band | VaR 95 (1d) | Breaches |
|---|---|---|---|---|---|---|---|
| 2012-01-01 → 2012-04-01 | -10.8271% | 7.1378% | 30.9023% | 8.2036% | yes | 2.2986% | 0 / 61 |
| 2012-04-01 → 2012-07-01 | -15.4307% | 7.8198% | 37.6568% | -7.7518% | yes | 2.9953% | 5 / 62 |
| 2012-07-01 → 2012-10-01 | -11.7939% | 7.4488% | 31.0397% | 7.2462% | yes | 2.2521% | 0 / 62 |
| 2012-10-01 → window end | -11.0764% | 8.3312% | 34.3806% | 4.7615% | yes | 2.3917% | 0 / 61 |
Step 8 · 2013-01-02 → 2013-12-31
Arm A
Portfolio book, rebalanced quarterly · 5 constructions · 52 names held · selection: reselect · 0.0% in cash · turnover 5.4×
Projection accuracy, realized outcome fell inside the P5–P95 cone in 100.0% of 4 scored rebalances (a well-calibrated 90% band contains ~90.0%) · 95% VaR breached on 4.03% of 248 days (expected ~5.0%)
| Rebalance | P5 | Median | P95 | Realized | In band | VaR 95 (1d) | Breaches |
|---|---|---|---|---|---|---|---|
| 2013-01-01 → 2013-04-01 | -15.4202% | 6.0444% | 28.7447% | 11.8898% | yes | 2.5495% | 2 / 59 |
| 2013-04-01 → 2013-07-01 | -13.0306% | 8.493% | 32.7383% | 1.4283% | yes | 2.5442% | 3 / 63 |
| 2013-07-01 → 2013-10-01 | -16.6667% | 6.5401% | 33.3% | 10.936% | yes | 2.7129% | 1 / 63 |
| 2013-10-01 → 2014-01-01 | -3.4484% | 14.0642% | 32.7935% | 7.0947% | yes | 1.7194% | 4 / 63 |
| 2014-01-01 | no segment follows this rebalance, not scored | ||||||
Arm B
Portfolio book, rebalanced quarterly · 5 constructions · 52 names held · selection: reselect · 0.0% in cash
Projection accuracy, realized outcome fell inside the P5–P95 cone in 100.0% of 4 scored rebalances (a well-calibrated 90% band contains ~90.0%) · 95% VaR breached on 4.03% of 248 days (expected ~5.0%)
| Rebalance | P5 | Median | P95 | Realized | In band | VaR 95 (1d) | Breaches |
|---|---|---|---|---|---|---|---|
| 2013-01-01 → 2013-04-01 | -15.4202% | 6.0444% | 28.7447% | 11.8898% | yes | 2.5495% | 2 / 59 |
| 2013-04-01 → 2013-07-01 | -13.0306% | 8.493% | 32.7383% | 1.4283% | yes | 2.5442% | 3 / 63 |
| 2013-07-01 → 2013-10-01 | -16.6667% | 6.5401% | 33.3% | 10.936% | yes | 2.7129% | 1 / 63 |
| 2013-10-01 → 2014-01-01 | -3.4484% | 14.0642% | 32.7935% | 7.0947% | yes | 1.7194% | 4 / 63 |
| 2014-01-01 | no segment follows this rebalance, not scored | ||||||
Step 9 · 2014-01-02 → 2014-12-31
Arm A
Portfolio book, rebalanced quarterly · 5 constructions · 49 names held · selection: reselect · 0.0% in cash · turnover 4.8×
Projection accuracy, realized outcome fell inside the P5–P95 cone in 100.0% of 4 scored rebalances (a well-calibrated 90% band contains ~90.0%) · 95% VaR breached on 7.26% of 248 days (expected ~5.0%)
| Rebalance | P5 | Median | P95 | Realized | In band | VaR 95 (1d) | Breaches |
|---|---|---|---|---|---|---|---|
| 2014-01-01 → 2014-04-01 | -5.8717% | 11.2571% | 29.507% | 7.2665% | yes | 1.9675% | 2 / 60 |
| 2014-04-01 → 2014-07-01 | -1.8901% | 15.1559% | 35.2894% | 5.9766% | yes | 1.7447% | 6 / 62 |
| 2014-07-01 → 2014-10-01 | -5.9303% | 11.0243% | 29.14% | -3.0479% | yes | 1.9302% | 2 / 63 |
| 2014-10-01 → 2015-01-01 | -2.2098% | 12.1278% | 27.0307% | 2.424% | yes | 1.611% | 8 / 63 |
| 2015-01-01 | no segment follows this rebalance, not scored | ||||||
Arm B
Portfolio book, rebalanced quarterly · 5 constructions · 49 names held · selection: reselect · 0.0% in cash
Projection accuracy, realized outcome fell inside the P5–P95 cone in 100.0% of 4 scored rebalances (a well-calibrated 90% band contains ~90.0%) · 95% VaR breached on 7.26% of 248 days (expected ~5.0%)
| Rebalance | P5 | Median | P95 | Realized | In band | VaR 95 (1d) | Breaches |
|---|---|---|---|---|---|---|---|
| 2014-01-01 → 2014-04-01 | -5.8717% | 11.2571% | 29.507% | 7.2665% | yes | 1.9675% | 2 / 60 |
| 2014-04-01 → 2014-07-01 | -1.8901% | 15.1559% | 35.2894% | 5.9766% | yes | 1.7447% | 6 / 62 |
| 2014-07-01 → 2014-10-01 | -5.9303% | 11.0243% | 29.14% | -3.0479% | yes | 1.9302% | 2 / 63 |
| 2014-10-01 → 2015-01-01 | -2.2098% | 12.1278% | 27.0307% | 2.424% | yes | 1.611% | 8 / 63 |
| 2015-01-01 | no segment follows this rebalance, not scored | ||||||
Step 10 · 2015-01-02 → 2015-12-31
Arm A
Portfolio book, rebalanced quarterly · 5 constructions · 51 names held · selection: reselect · 6.3% in cash · turnover 6.7× · 4 names dropped at load (55 selected, 51 held across the window), weights renormalised onto the rest
Projection accuracy, realized outcome fell inside the P5–P95 cone in 75.0% of 4 scored rebalances (a well-calibrated 90% band contains ~90.0%) · 95% VaR breached on 6.45% of 248 days (expected ~5.0%)
| Rebalance | P5 | Median | P95 | Realized | In band | VaR 95 (1d) | Breaches |
|---|---|---|---|---|---|---|---|
| 2015-01-01 → 2015-04-01 | -2.7267% | 11.0732% | 25.3011% | 8.4953% | yes | 1.4523% | 3 / 60 |
| 2015-04-01 → 2015-07-01 | -0.9964% | 11.1723% | 24.9209% | -0.2868% | yes | 1.3866% | 3 / 62 |
| 2015-07-01 → 2015-10-01 | -3.8166% | 10.3218% | 25.0223% | -5.7082% | no | 1.6293% | 6 / 63 |
| 2015-10-01 → 2016-01-01 | -6.089% | 7.7988% | 22.2493% | 5.1729% | yes | 1.5706% | 4 / 63 |
| 2016-01-01 | no segment follows this rebalance, not scored | ||||||
Arm B
Portfolio book, rebalanced quarterly · 5 constructions · 51 names held · selection: reselect · 0.0% in cash · 4 names dropped at load (55 selected, 51 held across the window), weights renormalised onto the rest
Projection accuracy, realized outcome fell inside the P5–P95 cone in 75.0% of 4 scored rebalances (a well-calibrated 90% band contains ~90.0%) · 95% VaR breached on 6.45% of 248 days (expected ~5.0%)
| Rebalance | P5 | Median | P95 | Realized | In band | VaR 95 (1d) | Breaches |
|---|---|---|---|---|---|---|---|
| 2015-01-01 → 2015-04-01 | -2.7267% | 11.0732% | 25.3011% | 8.4953% | yes | 1.4523% | 3 / 60 |
| 2015-04-01 → 2015-07-01 | -0.9964% | 11.1723% | 24.9209% | -0.2868% | yes | 1.3866% | 3 / 62 |
| 2015-07-01 → 2015-10-01 | -3.8166% | 10.3218% | 25.0223% | -5.7082% | no | 1.6293% | 6 / 63 |
| 2015-10-01 → 2016-01-01 | -6.089% | 7.7988% | 22.2493% | 5.1729% | yes | 1.5706% | 4 / 63 |
| 2016-01-01 | no segment follows this rebalance, not scored | ||||||
Step 11 · 2016-01-04 → 2016-12-30
Arm A
Portfolio book, rebalanced quarterly · 4 constructions · 60 names held · selection: reselect · 0.0% in cash · turnover 5.7× · 4 names dropped at load (64 selected, 60 held across the window), weights renormalised onto the rest
Projection accuracy, realized outcome fell inside the P5–P95 cone in 100.0% of 4 scored rebalances (a well-calibrated 90% band contains ~90.0%) · 95% VaR breached on 6.85% of 248 days (expected ~5.0%)
| Rebalance | P5 | Median | P95 | Realized | In band | VaR 95 (1d) | Breaches |
|---|---|---|---|---|---|---|---|
| 2016-01-01 → 2016-04-01 | -6.5483% | 8.5585% | 24.3907% | -1.5155% | yes | 1.6586% | 9 / 60 |
| 2016-04-01 → 2016-07-01 | -6.3077% | 5.4801% | 17.5205% | 3.3157% | yes | 1.2573% | 5 / 63 |
| 2016-07-01 → 2016-10-01 | -10.9142% | 4.9032% | 21.7671% | 3.28% | yes | 1.947% | 2 / 63 |
| 2016-10-01 → window end | -12.35% | 3.3747% | 22.0376% | 4.7531% | yes | 2.0907% | 1 / 62 |
Arm B
Portfolio book, rebalanced quarterly · 4 constructions · 60 names held · selection: reselect · 0.0% in cash · 4 names dropped at load (64 selected, 60 held across the window), weights renormalised onto the rest
Projection accuracy, realized outcome fell inside the P5–P95 cone in 100.0% of 4 scored rebalances (a well-calibrated 90% band contains ~90.0%) · 95% VaR breached on 6.85% of 248 days (expected ~5.0%)
| Rebalance | P5 | Median | P95 | Realized | In band | VaR 95 (1d) | Breaches |
|---|---|---|---|---|---|---|---|
| 2016-01-01 → 2016-04-01 | -6.5483% | 8.5585% | 24.3907% | -1.5155% | yes | 1.6586% | 9 / 60 |
| 2016-04-01 → 2016-07-01 | -6.3077% | 5.4801% | 17.5205% | 3.3157% | yes | 1.2573% | 5 / 63 |
| 2016-07-01 → 2016-10-01 | -10.9142% | 4.9032% | 21.7671% | 3.28% | yes | 1.947% | 2 / 63 |
| 2016-10-01 → window end | -12.35% | 3.3747% | 22.0376% | 4.7531% | yes | 2.0907% | 1 / 62 |
Step 12 · 2017-01-03 → 2017-12-29
Arm A
Portfolio book, rebalanced quarterly · 5 constructions · 49 names held · selection: reselect · 0.0% in cash · turnover 4.9× · 5 names dropped at load (54 selected, 49 held across the window), weights renormalised onto the rest
Projection accuracy, realized outcome fell inside the P5–P95 cone in 100.0% of 4 scored rebalances (a well-calibrated 90% band contains ~90.0%) · 95% VaR breached on 3.24% of 247 days (expected ~5.0%)
| Rebalance | P5 | Median | P95 | Realized | In band | VaR 95 (1d) | Breaches |
|---|---|---|---|---|---|---|---|
| 2017-01-01 → 2017-04-01 | -14.5599% | 2.9763% | 26.2503% | -0.3768% | yes | 2.3772% | 2 / 61 |
| 2017-04-01 → 2017-07-01 | -13.6344% | 4.9336% | 27.638% | -0.2865% | yes | 2.6614% | 1 / 62 |
| 2017-07-01 → 2017-10-01 | -6.5353% | 9.0714% | 27.3985% | 15.3986% | yes | 1.941% | 3 / 62 |
| 2017-10-01 → 2018-01-01 | -7.6575% | 8.6135% | 27.8722% | 4.8924% | yes | 2.0841% | 2 / 62 |
| 2018-01-01 | no segment follows this rebalance, not scored | ||||||
Arm B
Portfolio book, rebalanced quarterly · 5 constructions · 49 names held · selection: reselect · 0.0% in cash · 5 names dropped at load (54 selected, 49 held across the window), weights renormalised onto the rest
Projection accuracy, realized outcome fell inside the P5–P95 cone in 100.0% of 4 scored rebalances (a well-calibrated 90% band contains ~90.0%) · 95% VaR breached on 3.24% of 247 days (expected ~5.0%)
| Rebalance | P5 | Median | P95 | Realized | In band | VaR 95 (1d) | Breaches |
|---|---|---|---|---|---|---|---|
| 2017-01-01 → 2017-04-01 | -14.5599% | 2.9763% | 26.2503% | -0.3768% | yes | 2.3772% | 2 / 61 |
| 2017-04-01 → 2017-07-01 | -13.6344% | 4.9336% | 27.638% | -0.2865% | yes | 2.6614% | 1 / 62 |
| 2017-07-01 → 2017-10-01 | -6.5353% | 9.0714% | 27.3985% | 15.3986% | yes | 1.941% | 3 / 62 |
| 2017-10-01 → 2018-01-01 | -7.6575% | 8.6135% | 27.8722% | 4.8924% | yes | 2.0841% | 2 / 62 |
| 2018-01-01 | no segment follows this rebalance, not scored | ||||||
Step 13 · 2018-01-02 → 2018-12-31
Arm A
Portfolio book, rebalanced quarterly · 5 constructions · 50 names held · selection: reselect · 5.2% in cash · turnover 8.1× · 9 names dropped at load (59 selected, 50 held across the window), weights renormalised onto the rest
Projection accuracy, realized outcome fell inside the P5–P95 cone in 75.0% of 4 scored rebalances (a well-calibrated 90% band contains ~90.0%) · 95% VaR breached on 12.55% of 247 days (expected ~5.0%)
| Rebalance | P5 | Median | P95 | Realized | In band | VaR 95 (1d) | Breaches |
|---|---|---|---|---|---|---|---|
| 2018-01-01 → 2018-04-01 | -5.1623% | 8.4026% | 22.4017% | 4.5438% | yes | 1.5706% | 6 / 60 |
| 2018-04-01 → 2018-07-01 | -2.7493% | 13.1846% | 29.9841% | 6.3045% | yes | 1.652% | 6 / 63 |
| 2018-07-01 → 2018-10-01 | -4.9239% | 10.0943% | 27.5934% | 12.1033% | yes | 1.7125% | 3 / 62 |
| 2018-10-01 → 2019-01-01 | -2.4448% | 10.1438% | 24.4446% | -19.0559% | no | 1.2777% | 16 / 62 |
| 2019-01-01 | no segment follows this rebalance, not scored | ||||||
Arm B
Portfolio book, rebalanced quarterly · 5 constructions · 50 names held · selection: reselect · 0.0% in cash · 9 names dropped at load (59 selected, 50 held across the window), weights renormalised onto the rest
Projection accuracy, realized outcome fell inside the P5–P95 cone in 75.0% of 4 scored rebalances (a well-calibrated 90% band contains ~90.0%) · 95% VaR breached on 12.55% of 247 days (expected ~5.0%)
| Rebalance | P5 | Median | P95 | Realized | In band | VaR 95 (1d) | Breaches |
|---|---|---|---|---|---|---|---|
| 2018-01-01 → 2018-04-01 | -5.1623% | 8.4026% | 22.4017% | 4.5438% | yes | 1.5706% | 6 / 60 |
| 2018-04-01 → 2018-07-01 | -2.7493% | 13.1846% | 29.9841% | 6.3045% | yes | 1.652% | 6 / 63 |
| 2018-07-01 → 2018-10-01 | -4.9239% | 10.0943% | 27.5934% | 12.1033% | yes | 1.7125% | 3 / 62 |
| 2018-10-01 → 2019-01-01 | -2.4448% | 10.1438% | 24.4446% | -19.0559% | no | 1.2777% | 16 / 62 |
| 2019-01-01 | no segment follows this rebalance, not scored | ||||||
Step 14 · 2019-01-02 → 2019-12-31
Arm A
Portfolio book, rebalanced quarterly · 5 constructions · 49 names held · selection: reselect · 0.0% in cash · turnover 5.7× · 15 names dropped at load (64 selected, 49 held across the window), weights renormalised onto the rest
Projection accuracy, realized outcome fell inside the P5–P95 cone in 75.0% of 4 scored rebalances (a well-calibrated 90% band contains ~90.0%) · 95% VaR breached on 5.65% of 248 days (expected ~5.0%)
| Rebalance | P5 | Median | P95 | Realized | In band | VaR 95 (1d) | Breaches |
|---|---|---|---|---|---|---|---|
| 2019-01-01 → 2019-04-01 | -5.776% | 5.0647% | 15.9915% | 16.6919% | no | 1.2424% | 0 / 60 |
| 2019-04-01 → 2019-07-01 | -6.0794% | 6.5053% | 20.8645% | -2.5412% | yes | 1.5203% | 5 / 62 |
| 2019-07-01 → 2019-10-01 | -5.8564% | 6.6209% | 19.4382% | 1.3964% | yes | 1.4201% | 6 / 63 |
| 2019-10-01 → 2020-01-01 | -4.7135% | 7.3328% | 19.6436% | 3.6832% | yes | 1.4281% | 3 / 63 |
| 2020-01-01 | no segment follows this rebalance, not scored | ||||||
Arm B
Portfolio book, rebalanced quarterly · 5 constructions · 49 names held · selection: reselect · 0.0% in cash · 15 names dropped at load (64 selected, 49 held across the window), weights renormalised onto the rest
Projection accuracy, realized outcome fell inside the P5–P95 cone in 75.0% of 4 scored rebalances (a well-calibrated 90% band contains ~90.0%) · 95% VaR breached on 5.65% of 248 days (expected ~5.0%)
| Rebalance | P5 | Median | P95 | Realized | In band | VaR 95 (1d) | Breaches |
|---|---|---|---|---|---|---|---|
| 2019-01-01 → 2019-04-01 | -5.776% | 5.0647% | 15.9915% | 16.6919% | no | 1.2424% | 0 / 60 |
| 2019-04-01 → 2019-07-01 | -6.0794% | 6.5053% | 20.8645% | -2.5412% | yes | 1.5203% | 5 / 62 |
| 2019-07-01 → 2019-10-01 | -5.8564% | 6.6209% | 19.4382% | 1.3964% | yes | 1.4201% | 6 / 63 |
| 2019-10-01 → 2020-01-01 | -4.7135% | 7.3328% | 19.6436% | 3.6832% | yes | 1.4281% | 3 / 63 |
| 2020-01-01 | no segment follows this rebalance, not scored | ||||||
Step 15 · 2020-01-02 → 2020-12-31
Arm A
Portfolio book, rebalanced quarterly · 4 constructions · 50 names held · selection: reselect · 69.6% in cash · turnover 4.6×
Projection accuracy, realized outcome fell inside the P5–P95 cone in 50.0% of 4 scored rebalances (a well-calibrated 90% band contains ~90.0%) · 95% VaR breached on 8.84% of 249 days (expected ~5.0%)
| Rebalance | P5 | Median | P95 | Realized | In band | VaR 95 (1d) | Breaches |
|---|---|---|---|---|---|---|---|
| 2020-01-01 → 2020-04-01 | -10.0949% | 5.4112% | 25.4048% | -20.597% | no | 2.1992% | 14 / 61 |
| 2020-04-01 → 2020-07-01 | -16.5217% | 3.6807% | 28.9346% | 31.9345% | no | 2.4297% | 3 / 62 |
| 2020-07-01 → 2020-10-01 | -12.792% | 9.7038% | 35.2468% | 9.0022% | yes | 2.3531% | 3 / 63 |
| 2020-10-01 → window end | -19.1278% | 8.0666% | 40.7729% | 11.4246% | yes | 3.1457% | 2 / 63 |
Arm B
Portfolio book, rebalanced quarterly · 4 constructions · 60 names held · selection: reselect · 0.0% in cash
Projection accuracy, realized outcome fell inside the P5–P95 cone in 50.0% of 4 scored rebalances (a well-calibrated 90% band contains ~90.0%) · 95% VaR breached on 8.84% of 249 days (expected ~5.0%)
| Rebalance | P5 | Median | P95 | Realized | In band | VaR 95 (1d) | Breaches |
|---|---|---|---|---|---|---|---|
| 2020-01-01 → 2020-04-01 | -10.0949% | 5.4112% | 25.4048% | -20.597% | no | 2.1992% | 14 / 61 |
| 2020-04-01 → 2020-07-01 | -16.5217% | 3.6807% | 28.9346% | 31.9345% | no | 2.4297% | 3 / 62 |
| 2020-07-01 → 2020-10-01 | -12.792% | 9.7038% | 35.2468% | 9.0022% | yes | 2.3531% | 3 / 63 |
| 2020-10-01 → window end | -19.1278% | 8.0666% | 40.7729% | 11.4246% | yes | 3.1457% | 2 / 63 |
Step 16 · 2021-01-04 → 2021-12-31
Arm A
Portfolio book, rebalanced quarterly · 5 constructions · 54 names held · selection: reselect · 4.0% in cash · turnover 10.6× · 5 names dropped at load (59 selected, 54 held across the window), weights renormalised onto the rest
Projection accuracy, realized outcome fell inside the P5–P95 cone in 100.0% of 4 scored rebalances (a well-calibrated 90% band contains ~90.0%) · 95% VaR breached on 1.21% of 248 days (expected ~5.0%)
| Rebalance | P5 | Median | P95 | Realized | In band | VaR 95 (1d) | Breaches |
|---|---|---|---|---|---|---|---|
| 2021-01-01 → 2021-04-01 | -21.2293% | 9.9512% | 48.8629% | 15.4513% | yes | 3.4576% | 2 / 60 |
| 2021-04-01 → 2021-07-01 | -28.8482% | 8.429% | 65.6413% | 7.0911% | yes | 3.9245% | 0 / 62 |
| 2021-07-01 → 2021-10-01 | -29.5627% | 7.6009% | 58.3636% | -0.6734% | yes | 3.9184% | 0 / 63 |
| 2021-10-01 → 2022-01-01 | -10.1903% | 18.0353% | 51.4497% | 4.8996% | yes | 2.7712% | 1 / 63 |
| 2022-01-01 | no segment follows this rebalance, not scored | ||||||
Arm B
Portfolio book, rebalanced quarterly · 5 constructions · 54 names held · selection: reselect · 0.0% in cash · 5 names dropped at load (59 selected, 54 held across the window), weights renormalised onto the rest
Projection accuracy, realized outcome fell inside the P5–P95 cone in 100.0% of 4 scored rebalances (a well-calibrated 90% band contains ~90.0%) · 95% VaR breached on 1.21% of 248 days (expected ~5.0%)
| Rebalance | P5 | Median | P95 | Realized | In band | VaR 95 (1d) | Breaches |
|---|---|---|---|---|---|---|---|
| 2021-01-01 → 2021-04-01 | -21.2293% | 9.9512% | 48.8629% | 15.4513% | yes | 3.4576% | 2 / 60 |
| 2021-04-01 → 2021-07-01 | -28.8482% | 8.429% | 65.6413% | 7.0911% | yes | 3.9245% | 0 / 62 |
| 2021-07-01 → 2021-10-01 | -29.5627% | 7.6009% | 58.3636% | -0.6734% | yes | 3.9184% | 0 / 63 |
| 2021-10-01 → 2022-01-01 | -10.1903% | 18.0353% | 51.4497% | 4.8996% | yes | 2.7712% | 1 / 63 |
| 2022-01-01 | no segment follows this rebalance, not scored | ||||||
Step 17 · 2022-01-03 → 2022-12-30
Arm A
Portfolio book, rebalanced quarterly · 5 constructions · 49 names held · selection: reselect · 52.6% in cash · turnover 8.5×
Projection accuracy, realized outcome fell inside the P5–P95 cone in 100.0% of 4 scored rebalances (a well-calibrated 90% band contains ~90.0%) · 95% VaR breached on 7.29% of 247 days (expected ~5.0%)
| Rebalance | P5 | Median | P95 | Realized | In band | VaR 95 (1d) | Breaches |
|---|---|---|---|---|---|---|---|
| 2022-01-01 → 2022-04-01 | -12.8441% | 15.3645% | 56.6728% | -4.3452% | yes | 2.8731% | 6 / 61 |
| 2022-04-01 → 2022-07-01 | -25.7087% | 9.2357% | 66.3853% | -13.8819% | yes | 4.0687% | 7 / 61 |
| 2022-07-01 → 2022-10-01 | -23.2613% | 12.2015% | 58.6655% | -1.2755% | yes | 3.9072% | 3 / 63 |
| 2022-10-01 → 2023-01-01 | -13.7707% | 12.39% | 46.7133% | 2.9682% | yes | 2.9624% | 2 / 62 |
| 2023-01-01 | no segment follows this rebalance, not scored | ||||||
Arm B
Portfolio book, rebalanced quarterly · 5 constructions · 49 names held · selection: reselect · 0.0% in cash
Projection accuracy, realized outcome fell inside the P5–P95 cone in 100.0% of 4 scored rebalances (a well-calibrated 90% band contains ~90.0%) · 95% VaR breached on 7.29% of 247 days (expected ~5.0%)
| Rebalance | P5 | Median | P95 | Realized | In band | VaR 95 (1d) | Breaches |
|---|---|---|---|---|---|---|---|
| 2022-01-01 → 2022-04-01 | -12.8441% | 15.3645% | 56.6728% | -4.3452% | yes | 2.8731% | 6 / 61 |
| 2022-04-01 → 2022-07-01 | -25.7087% | 9.2357% | 66.3853% | -13.8819% | yes | 4.0687% | 7 / 61 |
| 2022-07-01 → 2022-10-01 | -23.2613% | 12.2015% | 58.6655% | -1.2755% | yes | 3.9072% | 3 / 63 |
| 2022-10-01 → 2023-01-01 | -13.7707% | 12.39% | 46.7133% | 2.9682% | yes | 2.9624% | 2 / 62 |
| 2023-01-01 | no segment follows this rebalance, not scored | ||||||
Step 18 · 2023-01-03 → 2023-12-29
Arm A
Portfolio book, rebalanced quarterly · 5 constructions · 55 names held · selection: reselect · 0.0% in cash · turnover 5.4× · 6 names dropped at load (61 selected, 55 held across the window), weights renormalised onto the rest
Projection accuracy, realized outcome fell inside the P5–P95 cone in 100.0% of 4 scored rebalances (a well-calibrated 90% band contains ~90.0%) · 95% VaR breached on 1.63% of 246 days (expected ~5.0%)
| Rebalance | P5 | Median | P95 | Realized | In band | VaR 95 (1d) | Breaches |
|---|---|---|---|---|---|---|---|
| 2023-01-01 → 2023-04-01 | -11.0551% | 13.0297% | 46.8214% | 1.4062% | yes | 2.6613% | 1 / 61 |
| 2023-04-01 → 2023-07-01 | -12.0882% | 7.4148% | 33.6735% | 8.3123% | yes | 2.4506% | 1 / 61 |
| 2023-07-01 → 2023-10-01 | -17.4584% | 4.9158% | 33.5411% | -1.9845% | yes | 2.9243% | 0 / 62 |
| 2023-10-01 → 2024-01-01 | -15.1206% | 3.9442% | 27.4411% | 15.0229% | yes | 2.2219% | 2 / 62 |
| 2024-01-01 | no segment follows this rebalance, not scored | ||||||
Arm B
Portfolio book, rebalanced quarterly · 5 constructions · 55 names held · selection: reselect · 0.0% in cash · 6 names dropped at load (61 selected, 55 held across the window), weights renormalised onto the rest
Projection accuracy, realized outcome fell inside the P5–P95 cone in 100.0% of 4 scored rebalances (a well-calibrated 90% band contains ~90.0%) · 95% VaR breached on 1.63% of 246 days (expected ~5.0%)
| Rebalance | P5 | Median | P95 | Realized | In band | VaR 95 (1d) | Breaches |
|---|---|---|---|---|---|---|---|
| 2023-01-01 → 2023-04-01 | -11.0551% | 13.0297% | 46.8214% | 1.4062% | yes | 2.6613% | 1 / 61 |
| 2023-04-01 → 2023-07-01 | -12.0882% | 7.4148% | 33.6735% | 8.3123% | yes | 2.4506% | 1 / 61 |
| 2023-07-01 → 2023-10-01 | -17.4584% | 4.9158% | 33.5411% | -1.9845% | yes | 2.9243% | 0 / 62 |
| 2023-10-01 → 2024-01-01 | -15.1206% | 3.9442% | 27.4411% | 15.0229% | yes | 2.2219% | 2 / 62 |
| 2024-01-01 | no segment follows this rebalance, not scored | ||||||
Step 19 · 2024-01-02 → 2024-12-31
Arm A
Portfolio book, rebalanced quarterly · 4 constructions · 60 names held · selection: reselect · 1.6% in cash · turnover 8.4× · 1 name dropped at load (61 selected, 60 held across the window), weights renormalised onto the rest
Projection accuracy, realized outcome fell inside the P5–P95 cone in 100.0% of 4 scored rebalances (a well-calibrated 90% band contains ~90.0%) · 95% VaR breached on 4.84% of 248 days (expected ~5.0%)
| Rebalance | P5 | Median | P95 | Realized | In band | VaR 95 (1d) | Breaches |
|---|---|---|---|---|---|---|---|
| 2024-01-01 → 2024-04-01 | -18.5185% | 4.7379% | 31.5753% | 19.15% | yes | 2.7461% | 0 / 60 |
| 2024-04-01 → 2024-07-01 | -13.7415% | 10.8678% | 42.7061% | 4.4618% | yes | 2.835% | 1 / 62 |
| 2024-07-01 → 2024-10-01 | -7.72% | 12.9596% | 35.8378% | 2.1042% | yes | 1.9065% | 10 / 63 |
| 2024-10-01 → window end | -7.3444% | 9.0491% | 26.5184% | -0.7281% | yes | 1.6555% | 1 / 63 |
Arm B
Portfolio book, rebalanced quarterly · 4 constructions · 60 names held · selection: reselect · 0.0% in cash · 1 name dropped at load (61 selected, 60 held across the window), weights renormalised onto the rest
Projection accuracy, realized outcome fell inside the P5–P95 cone in 100.0% of 4 scored rebalances (a well-calibrated 90% band contains ~90.0%) · 95% VaR breached on 4.84% of 248 days (expected ~5.0%)
| Rebalance | P5 | Median | P95 | Realized | In band | VaR 95 (1d) | Breaches |
|---|---|---|---|---|---|---|---|
| 2024-01-01 → 2024-04-01 | -18.5185% | 4.7379% | 31.5753% | 19.15% | yes | 2.7461% | 0 / 60 |
| 2024-04-01 → 2024-07-01 | -13.7415% | 10.8678% | 42.7061% | 4.4618% | yes | 2.835% | 1 / 62 |
| 2024-07-01 → 2024-10-01 | -7.72% | 12.9596% | 35.8378% | 2.1042% | yes | 1.9065% | 10 / 63 |
| 2024-10-01 → window end | -7.3444% | 9.0491% | 26.5184% | -0.7281% | yes | 1.6555% | 1 / 63 |
Step 20 · 2025-01-02 → 2025-12-31
Arm A
Portfolio book, rebalanced quarterly · 5 constructions · 48 names held · selection: reselect · 10.0% in cash · turnover 6.9× · 9 names dropped at load (57 selected, 48 held across the window), weights renormalised onto the rest
Projection accuracy, realized outcome fell inside the P5–P95 cone in 100.0% of 4 scored rebalances (a well-calibrated 90% band contains ~90.0%) · 95% VaR breached on 10.16% of 246 days (expected ~5.0%)
| Rebalance | P5 | Median | P95 | Realized | In band | VaR 95 (1d) | Breaches |
|---|---|---|---|---|---|---|---|
| 2025-01-01 → 2025-04-01 | -5.2879% | 13.2623% | 32.0411% | -3.9018% | yes | 1.8048% | 12 / 59 |
| 2025-04-01 → 2025-07-01 | -4.183% | 9.4735% | 26.611% | 12.2527% | yes | 1.545% | 7 / 61 |
| 2025-07-01 → 2025-10-01 | -7.1917% | 14.5785% | 38.8596% | 11.3459% | yes | 1.8754% | 0 / 63 |
| 2025-10-01 → 2026-01-01 | -8.0837% | 17.7195% | 47.523% | 4.536% | yes | 2.4395% | 6 / 63 |
| 2026-01-01 | no segment follows this rebalance, not scored | ||||||
Arm B
Portfolio book, rebalanced quarterly · 5 constructions · 48 names held · selection: reselect · 0.0% in cash · 9 names dropped at load (57 selected, 48 held across the window), weights renormalised onto the rest
Projection accuracy, realized outcome fell inside the P5–P95 cone in 100.0% of 4 scored rebalances (a well-calibrated 90% band contains ~90.0%) · 95% VaR breached on 10.16% of 246 days (expected ~5.0%)
| Rebalance | P5 | Median | P95 | Realized | In band | VaR 95 (1d) | Breaches |
|---|---|---|---|---|---|---|---|
| 2025-01-01 → 2025-04-01 | -5.2879% | 13.2623% | 32.0411% | -3.9018% | yes | 1.8048% | 12 / 59 |
| 2025-04-01 → 2025-07-01 | -4.183% | 9.4735% | 26.611% | 12.2527% | yes | 1.545% | 7 / 61 |
| 2025-07-01 → 2025-10-01 | -7.1917% | 14.5785% | 38.8596% | 11.3459% | yes | 1.8754% | 0 / 63 |
| 2025-10-01 → 2026-01-01 | -8.0837% | 17.7195% | 47.523% | 4.536% | yes | 2.4395% | 6 / 63 |
| 2026-01-01 | no segment follows this rebalance, not scored | ||||||