
Rebuilding the Fama-French factor construction inside the point-in-time S&P 500: value, dividend yield, profitability and net issuance, 2006 to 2025
Fama and French sort every US stock on the signal at the end of June, hold the top thirty percent weighted by market value, and quote the spread against the bottom thirty percent. A fund that sells the factor holds something near that, restricted to large caps. A private investor who reads about the same factor buys thirty names and weights them equally. The three are assumed to be one trade at three sizes. A private investor can hold only one of them, so whether that holds is a practical question.
This paper tests that assumption for four signals: book-to-market, dividend yield, gross profitability and low net share issuance, each walked beside a plain earnings-yield screen built the same way, the comparison every walk tests. Twenty walk-forward runs of twenty one-year windows from January 2006 on the point-in-time S&P 500, each window registered before it ran, five constructions per signal, from thirty names at equal weight to the value-weighted long-short spread, in total returns with a cost charged on every trade. The Kenneth French library's own sorted portfolios are read beside them over the same calendar years.
I expected the three versions to disagree on return and agree on direction, so that a private investor's version would be a scaled copy of the fund's construction. Half of that held.
Whether a signal ends ahead of the plain earnings screen is a property of the signal and it is the same in every version. No construction of value or dividend yield ends ahead of the screen over these twenty years and no construction of profitability or low issuance ends behind it, in the library, inside the index at fund size and in thirty names. The sign never flips inside a signal. Five of the twenty comparisons land within a coin flip of the screen and all five are thirty-name portfolios, which is the construction a private investor holds.
How much the portfolio makes is a property of the construction, and the construction does not push the same way for every signal. For value the thirty equal-weighted names ended 3.5 points a year ahead of the construction a fund holds, and four rebound years, 2009, 2010, 2013 and 2020, carry the whole lead while the other sixteen are a wash. For profitability they ended 2.9 points behind it, because weighting thirty names by market value is a position in three or four companies, and Nvidia was most of that portfolio in the last two years of the sample.
The spread the literature quotes lost money inside the index for three of the four signals and only profitability's paid. Low net issuance is the one signal where the step from the library's universe to the S&P 500 flips the sign of the spread, and the library's large-half rows already carry most of the loss, so the buyback premium sits with the smaller repurchasers the index does not hold.
The question, and what was done
A factor, in the literature, is the return of a spread: every US stock sorted once a year on a signal, the top 30 percent held long against the bottom 30 percent short, both sides weighted by market value. The same signal is held two other ways. A factor fund holds the top slice of the large-cap universe weighted by market value, somewhere between a hundred and three hundred names. A private investor holds the thirty best-ranked names at equal weight. This paper calls the sorting variable the signal, the portfolio built from it the construction, and the spread the factor, and it asks two questions of each of four signals: whether the signal's verdict against a plain earnings-yield screen is the same in the three constructions people actually hold, and how much the construction changes what the portfolio makes. Both are answered by walking each signal through five constructions on the same windows inside the S&P 500 as it stood on each anchor date, and by reading the literature's own spread and top-30-percent portfolios beside the result.
The four signals are book-to-market, dividend yield, gross profitability and low net share issuance, each walked beside a plain earnings-yield screen built the same way, on the point-in-time S&P 500 over twenty one-year windows from January 2006: twenty walks, four hundred windows, on one data vintage, with the Kenneth French library's sorted portfolios read beside them over the same calendar years.
These four signals, and not others, because they are the sorts of the Fama-French cross-section that can be formed at a January anchor from one filing and one price: two price ratios, book-to-market and dividend yield, and two measures from the quality side of the five-factor model, gross profitability and net share issuance, each with a published library row on the same calendar years. The sorts left out need something else: momentum and the two reversals need monthly formation from a return history, beta and the two volatility sorts need the return history itself, asset growth needs two fiscal years of balance sheets. Cash flow to price and accruals meet the same rule and are the next paper's. Every walk pairs the signal with an earnings-yield screen built in the same construction, because that is the plainest price screen a private investor runs and the paired comparison is what the bootstrap tests.
The trade is the same in every walk. On the first trading day of each January from 2006 to 2025 the S&P 500 membership of that day is rebuilt from the vendor's change log, every member with a usable filing is scored, and the portfolio is formed at that day's close and held without change until the first trading day of the next January, when it is sold and the next window's portfolio is bought. Thirty names at equal weight is 3.33 percent in each; thirty names at market value is each name's point-in-time market value over the sum of the thirty; the top third is the highest-ranked third of the scored pool, 114 names in 2006 and 166 in 2025, at equal weight or at market value the same way; the spread holds the top 30 percent of the pool long and the bottom 30 percent short, each leg weighted by market value and the two legs dollar-balanced. Dividends are credited on the ex-date and held as cash. Every buy and every sell pays 0.05 percent of its value. Figure 1 draws the five constructions from the value portfolios of the last window.
Three conventions apply throughout. A year is January to January, and where a dollar's growth is quoted it is the twenty years chained, each year from its own registered window. Two numbers describe every comparison: the twenty-year level of each arm, and the share of 2,000 paired bootstrap paths on which the signal's arm ends ahead of the screen's; a construction is called ahead of the screen when its level is higher and the share is above 60 percent, behind when its level is lower and the share is below 40, and a tie in between. The ruler is RSP, the equal-weight S&P 500 fund, rebuilt as a total-return index, because equal weighting is half of what is being tested and the ruler has to be equal-weighted too; SPY with its dividends is drawn beside it in the figures, and the French library's rows are read beside both, gross, on the same calendar years.
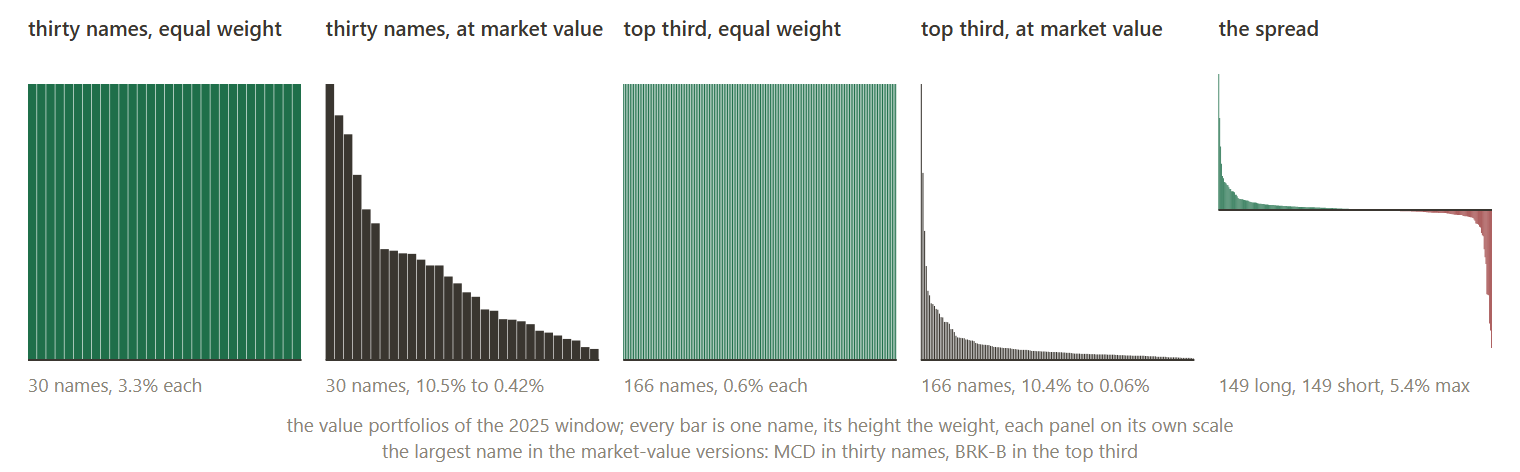
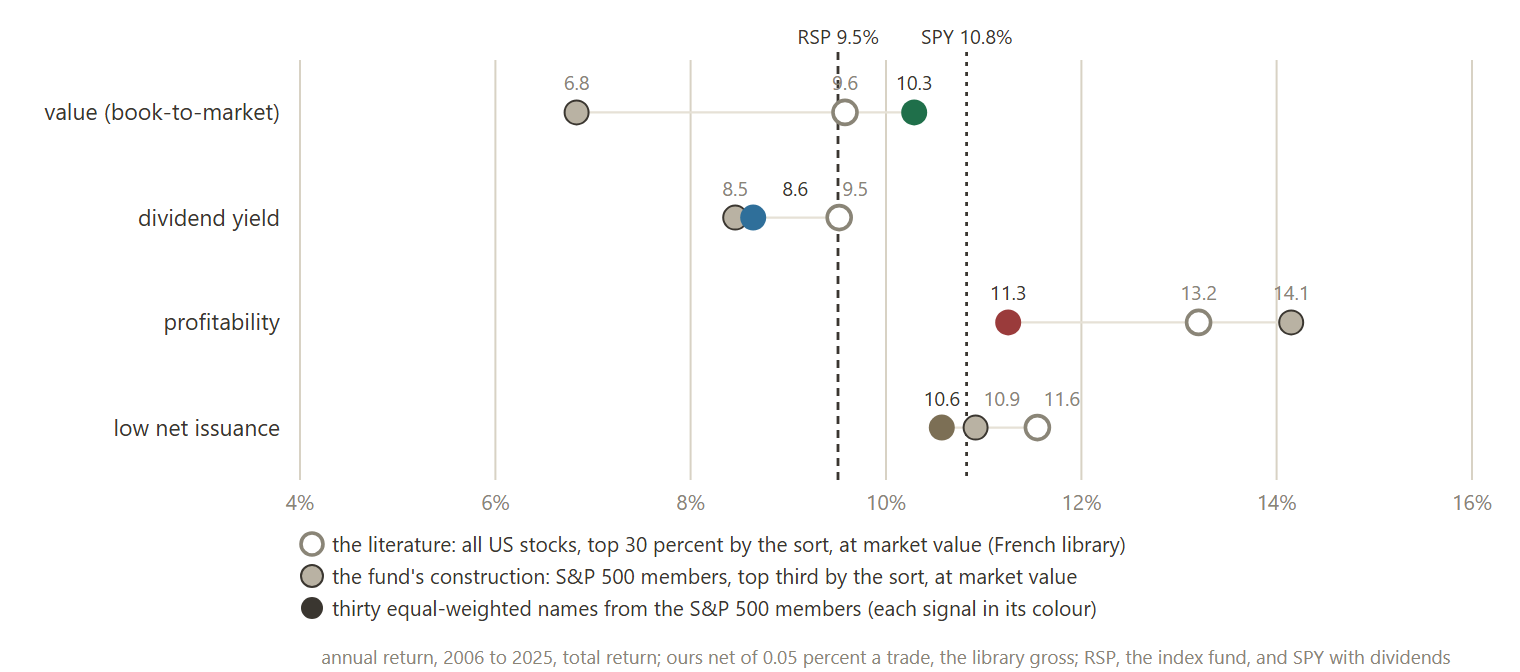
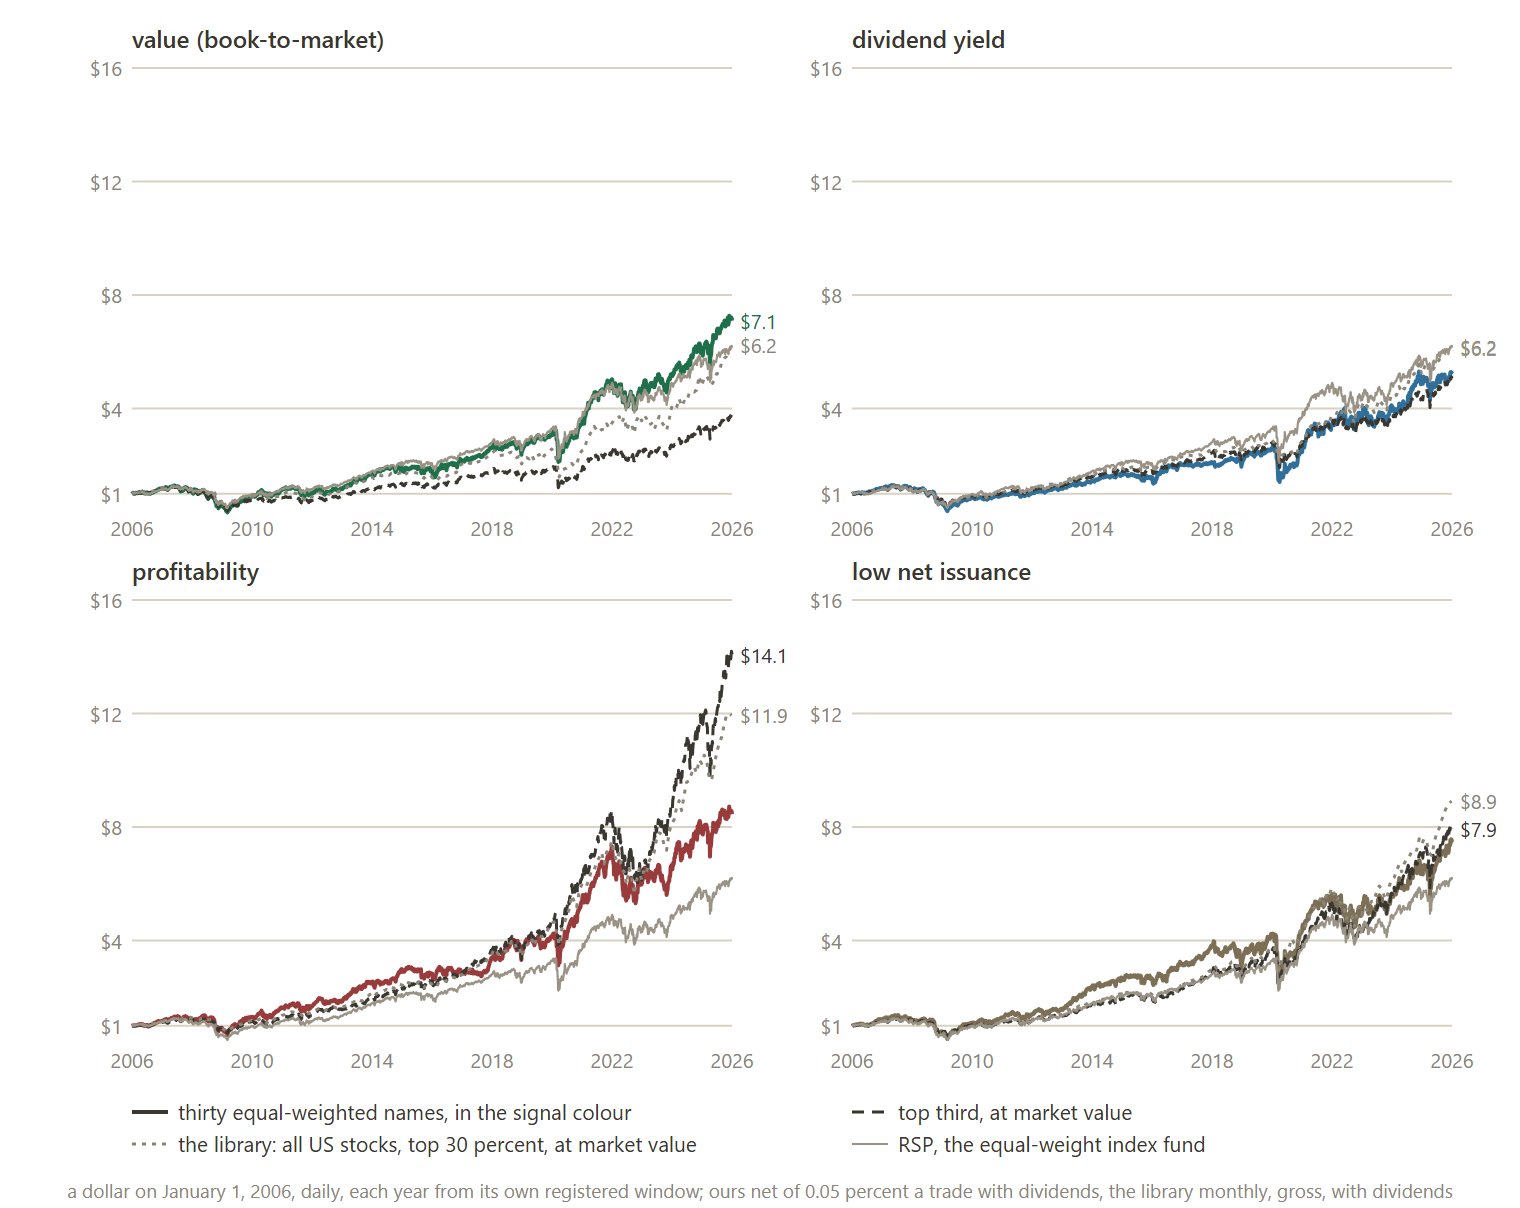
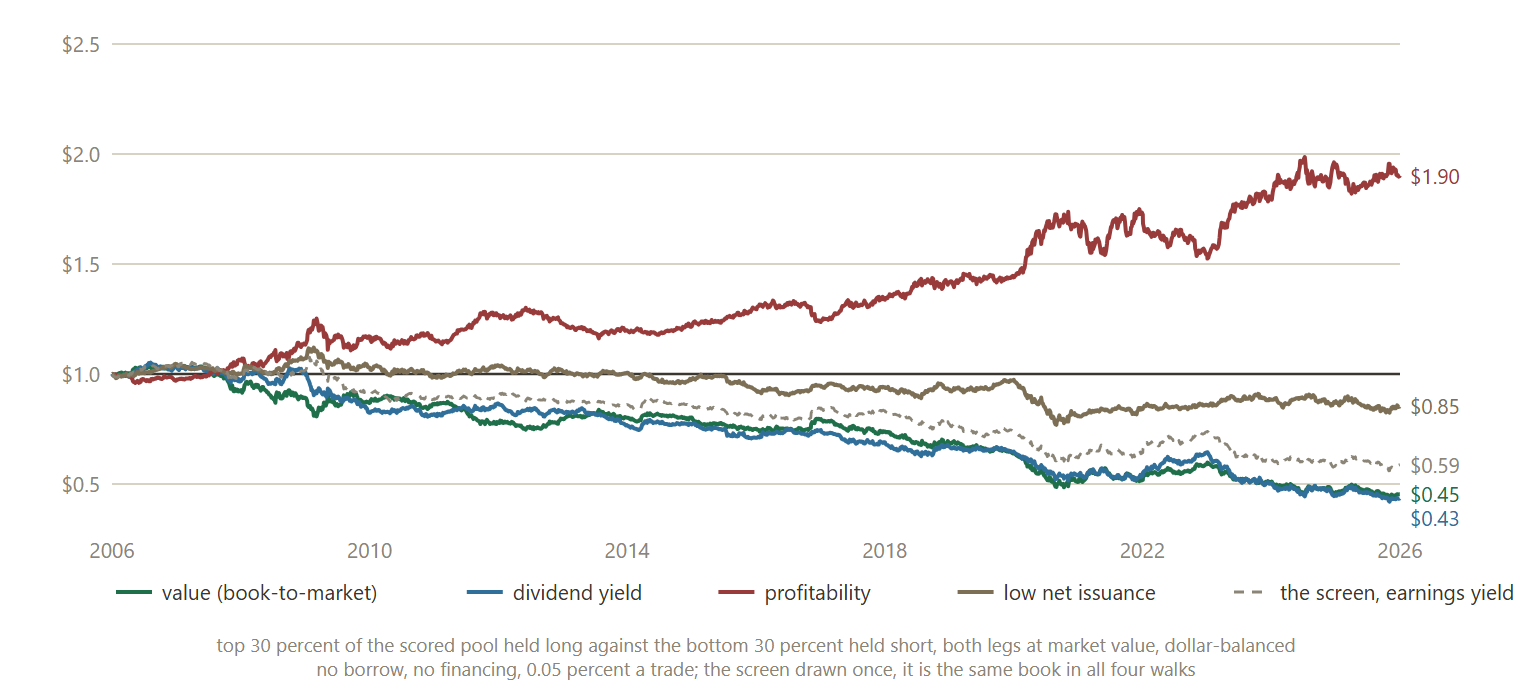
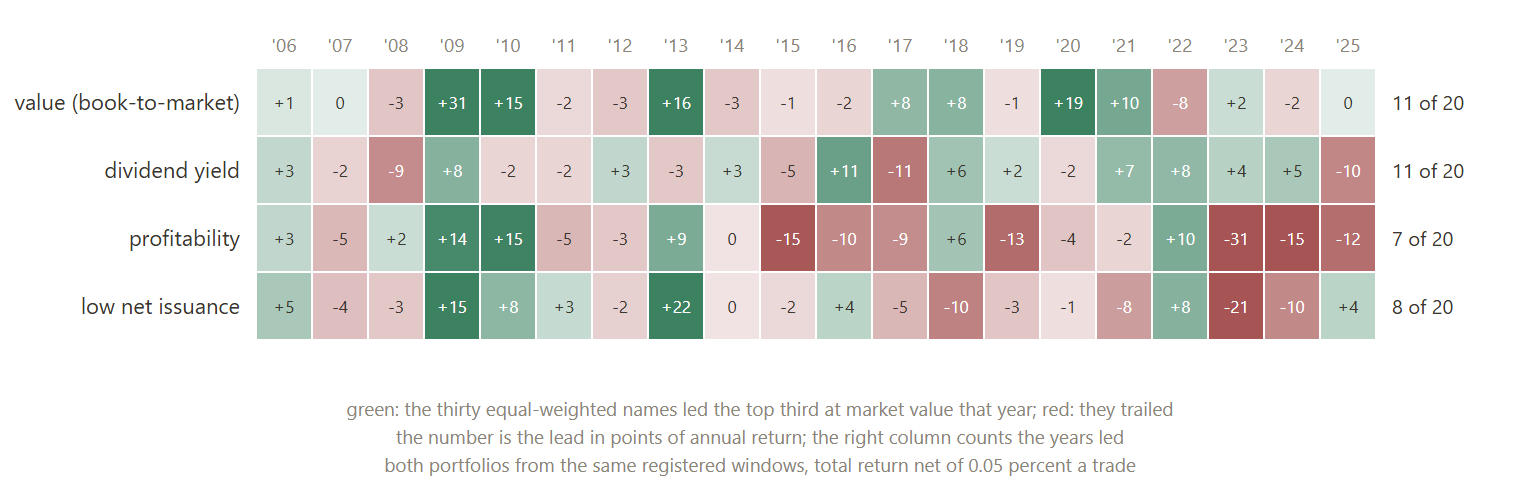
Table 1. The three versions: annual return over twenty years (a dollar became), the literature, the fund's construction and thirt
| signal | the library, all stocks, top 30% at market value | the library, large half | S&P 500, top third at market value | S&P 500, thirty names, equal weight | earnings yield, top third at market value | earnings yield, thirty names, equal weight |
|---|---|---|---|---|---|---|
| value, book-to-market | 9.6 ($6.23) | 9.7 ($6.33) | 6.8 ($3.75) | 10.3 ($7.09) | 9.1 ($5.71) | 9.8 ($6.45) |
| dividend yield | 9.5 ($6.16) | 9.5 ($6.10) | 8.5 ($5.07) | 8.6 ($5.25) | 9.1 ($5.71) | 9.8 ($6.45) |
| profitability, gross profit over assets | 13.2 ($11.94) | 13.3 ($12.09) | 14.1 ($14.11) | 11.3 ($8.43) | 9.1 ($5.71) | 9.8 ($6.45) |
| low net share issuance | 11.6 ($8.91) | 11.5 ($8.78) | 10.9 ($7.94) | 10.6 ($7.46) | 9.1 ($5.71) | 9.8 ($6.45) |
| value, July anchors, July 2006 to July 2026 | 10.3 ($7.06) | 10.4 ($7.20) | 7.7 ($4.44) | not walked | 10.2 ($7.00) | |
| the index fund, RSP | 9.5 ($6.15) | |||||
| SPY | 10.8 ($7.81) |
1 Methodology
The universe is the S&P 500 as it stood on each first of January from 2006 to 2025, reconstructed from the vendor's change log and held for the year; symbols the log cannot date, seats the log hands to the wrong company, and tickers the vendor has since reassigned are refused by name. Fundamentals are the vendor's SEC filings, each visible only from its acceptance date, with a 365-day lookback; a name without a usable score at the anchor is not in the scored pool, and the pool is reported per window in Table 2.
The signals are defined as follows: book-to-market, price against book equity; trailing dividend yield; gross profits over total assets; and net share issuance, the latest quarter's growth in weighted shares outstanding inverted so that buybacks rank first. Each arm ranks on one composite: for book-to-market and dividend yield the value family with one metric switched on, for profitability and issuance the value family and the second family computed identically in both arms with the composite weight moved from one to the other. The single difference between the arms of a walk is the metric or the weight; the construction is identical on both sides.
The five constructions are the ones of the opening section. Equal weight is one over the count; value weight is each name's point-in-time market value over the sum, with no cap on any one name; a name the vendor carries no market value for on the anchor date weighs nothing that year, and the count is in Table 2. The spread charges no borrow and no financing, the academic reading, and pays the same 0.05 percent on every trade; the portfolio is held at 100 percent gross. Every portfolio is bought at the anchor close, held for the year, and marked in total returns with dividends credited on the ex-date and held as cash; the benchmark is RSP with its own dividends.
Twenty walks, one per signal and construction, each twenty one-year windows anchored on January 1, 2006 to 2025, each window registered on the platform before it ran and its report frozen when it landed. The comparison inside a walk is the paired block bootstrap over the two arms' daily paths, 2,000 paths, block 10, which gives the share of paths on which the signal ends ahead of the screen; the comparison across constructions, thirty names against the fund's construction for the same signal, is a bootstrap over the twenty annual differences, since the two walks share their windows. The search record is the twenty registered walks themselves, counted as a declared family of twenty; the thirteen unregistered engine checks that preceded them are described under The record.
The literature's version comes from the Kenneth R. French data library, the files built on the July 2026 CRSP tape: the portfolios formed on book-to-market, dividend yield, earnings to price, operating profitability and net share issues, sorted once a year at the end of June on NYSE breakpoints across every NYSE, AMEX and NASDAQ stock, held twelve months, value-weighted, with calendar-year returns that line up with this paper's January windows. The large-half rows are the same sorts among stocks above the NYSE median market value. Their returns are gross of trading costs and include dividends; the library also publishes each sort without dividends, so the dividend part of each row is the difference. Two of the library's variables are not this paper's: its profitability is operating profit over book equity where this paper ranks on gross profit over assets, and its net share issues bucket is net repurchasers against the top 20 percent of issuers where this paper holds the lowest-issuance third against the highest. Those rows are the nearest published relatives, and are labelled so.
The library's rows are quoted, not reproduced: the universe, the breakpoints, the June formation on the prior December's accounts and the CRSP delisting returns are theirs. The step from their version to this paper's therefore carries the universe and the data source together. The cost part of it is bounded: reforming a whole portfolio once a year at 0.05 percent each way costs 0.1 points a year, and no spread in the tables is within a point of zero. The formation-month part is measured by two more walks, value's top third at market value and its spread on July anchors, reported under Limitations and in Table 7.
2 Results
2.1 Headline
This paper answers for a declared family of 20 sealed studies. 20 member walks are drawn as 40 lines (a comparative walk contributes one line per arm), each chained across its own out-of-sample windows, on one calendar axis, all rebased to 1× on the first session they share. 9 of them are shown to start, the ones the paper reads by; the others are switched off until their name is clicked. The paper’s own walk is the heavy line; the dashed grey line is the study’s own benchmark.
Table 2. Coverage by window: members, names with a usable score, the top third as held, and names without a point-in-time market
| window | members | scored, value | scored, dividend yield | scored, profitability | scored, net issuance | top third at market value, names held | no market value, value | no market value, profitability |
|---|---|---|---|---|---|---|---|---|
| 2006 | 493 | 343 | 343 | 343 | 343 | 111 | 1 | 0 |
| 2008 | 494 | 375 | 375 | 375 | 375 | 117 | 2 | 1 |
| 2010 | 495 | 400 | 400 | 400 | 400 | 131 | 1 | 1 |
| 2012 | 494 | 419 | 419 | 419 | 419 | 136 | 2 | 2 |
| 2014 | 494 | 434 | 434 | 434 | 434 | 144 | 0 | 0 |
| 2016 | 498 | 458 | 458 | 458 | 458 | 152 | 0 | 0 |
| 2018 | 499 | 479 | 479 | 479 | 479 | 160 | 0 | 0 |
| 2020 | 500 | 497 | 497 | 497 | 497 | 166 | 0 | 0 |
| 2022 | 500 | 498 | 498 | 498 | 498 | 165 | 0 | 0 |
| 2024 | 499 | 498 | 498 | 498 | 498 | 166 | 0 | 0 |
| 2025 | 499 | 498 | 498 | 498 | 498 | 166 | 0 | 0 |
Table 3. The four corners: the signal against the earnings-yield screen, annual return and the share of 2,000 paths on which the
| signal | thirty, equal | thirty, market value | top third, equal | top third, market value | breadth (thirty to top third, equal), pts | weighting (equal to market value, thirty), pts | both, pts | thirty equal led top third market value, years | chance of no lead, % | lead from 2010, pts a year (years led) |
|---|---|---|---|---|---|---|---|---|---|---|
| value, book-to-market | 10.3 v 9.8 (60) | 7.2 v 6.9 (58) | 8.2 v 9.6 (23) | 6.8 v 9.1 (14) | -2.1 | -3.1 | -3.5 | 11 of 20 | 1.1 | 3.6 (8 of 16) |
| dividend yield | 8.6 v 9.8 (33) | 7.0 v 6.9 (46) | 9.1 v 9.6 (29) | 8.5 v 9.1 (23) | 0.4 | -1.7 | -0.2 | 11 of 20 | 29.8 | 0.9 (9 of 16) |
| profitability, gross profit over assets | 11.3 v 9.8 (57) | 16.2 v 6.9 (99) | 11.3 v 9.6 (77) | 14.1 v 9.1 (96) | 0.0 | 5.0 | 2.9 | 7 of 20 | 90.8 | -4.9 (4 of 16) |
| low net share issuance | 10.6 v 9.8 (55) | 9.4 v 6.9 (77) | 10.3 v 9.6 (76) | 10.9 v 9.1 (83) | -0.3 | -1.2 | 0.3 | 8 of 20 | 52.1 | -0.9 (6 of 16) |
Table 4. The spreads: top 30 percent long against bottom 30 percent short, value-weighted legs, inside the S&P 500 and in the lib
| signal | S&P 500 spread, a year (a dollar became) | earnings-yield spread, same construction | signal ahead, % of paths | years up | library, all stocks: top v bottom, pts | library, large half, pts | library, equal-weighted, pts | library top ahead, years |
|---|---|---|---|---|---|---|---|---|
| value, book-to-market | -3.9 ($0.45) | -2.6 ($0.59) | 17 | 6 of 20 | 9.6 v 13.0: -3.5 | -3.5 | 2.0 | 7 of 20 |
| dividend yield | -4.1 ($0.43) | -2.6 ($0.59) | 10 | 6 of 20 | 9.5 v 11.0: -1.5 | -1.5 | 0.4 | 9 of 20 |
| profitability, gross profit over assets | 3.3 ($1.90) | -2.6 ($0.59) | 99 | 13 of 20 | 13.2 v 7.6: 5.6 | 5.6 | 4.3 | 14 of 20 |
| low net share issuance | -0.8 ($0.85) | -2.6 ($0.59) | 94 | 8 of 20 | 11.6 v 7.3: 4.3 | 2.8 | 12.1 | 12 of 20 |
| earnings yield (the screen) | 9.8 v 12.3: -2.5 | -2.6 | -0.1 | 9 of 20 |
Table 5. Dividends, cost and the ruler: the dividend part of the annual return, the cost charged, years the portfolio ended ahead
| signal | dividends, thirty equal, pts a year | dividends, top third market value | dividends, the spread | dividends, library top 30% | cost, thirty equal, pts a year | thirty equal ahead of RSP, years | top third market value ahead of RSP, years | worst window, thirty equal, % | worst window, top third market value, % |
|---|---|---|---|---|---|---|---|---|---|
| value, book-to-market | 2.0 | 2.3 | 0.4 | 2.4 | 0.10 | 14 of 20 | 7 of 20 | -62 | -57 |
| dividend yield | 4.2 | 3.4 | 1.5 | 4.3 | 0.10 | 7 of 20 | 9 of 20 | -52 | -42 |
| profitability, gross profit over assets | 1.3 | 1.5 | -0.4 | not published | 0.10 | 12 of 20 | 13 of 20 | -45 | -37 |
| low net share issuance | 1.9 | 1.9 | 0.2 | not published | 0.10 | 10 of 20 | 12 of 20 | -48 | -42 |
Table 6. The re-walk against the published thirty-name studies, window by window: windows that agree within a point, and the wors
| signal | basis compared | signal arm within 1 pt, windows | signal arm, worst window | earnings-yield arm within 1 pt | earnings-yield arm, worst window |
|---|---|---|---|---|---|
| value, book-to-market | price | 19 of 20 | 2013 (published 48.1, re-walk 46.1) | 13 of 20 | 2017 (20.3 v 12.0) |
| dividend yield | net | 17 of 20 | 2008 (published -37.2, re-walk -40.2) | 13 of 20 | 2017 (22.0 v 13.2) |
| profitability, gross profit over assets | net | 15 of 20 | 2017 (published 26.7, re-walk 18.4) | 13 of 20 | 2017 (22.0 v 13.2) |
| low net share issuance | net | 16 of 20 | 2022 (published -14.0, re-walk -11.7) | 13 of 20 | 2017 (22.0 v 13.2) |
Table 7. The two July-anchored value walks, July 2006 to July 2026: annual return (a dollar became) for the signal and for the ea
| construction | study | signal, % a year ($) | earnings yield, % a year ($) | signal ahead, % of paths | signal led, years | ahead of RSP, years | Sharpe, pooled | worst window, % |
|---|---|---|---|---|---|---|---|---|
| top third, at market value | a8e352433bee | 7.7 ($4.44) | 10.2 ($7.00) | 15 | 6 of 20 | 7 of 20 | 0.45 | -32 |
| the spread | 7ca30054282a | -2.6 ($0.60) | -1.2 ($0.78) | 18 | 8 of 20 | 3 of 20 | -0.32 | -19 |
2.2 Per-step results
| # | Out-of-sample window | Book-to-market SR | Earnings yield SR |
|---|---|---|---|
| 1 | 2006-01-03 → 2006-12-29 | 1.60 | 1.71 |
| 2 | 2007-01-03 → 2007-12-31 | -0.16 | 0.25 |
| 3 | 2008-01-02 → 2008-12-31 | -0.90 | -0.70 |
| 4 | 2009-01-02 → 2009-12-31 | 0.73 | 0.76 |
| 5 | 2010-01-04 → 2010-12-31 | 0.60 | 0.68 |
| 6 | 2011-01-03 → 2011-12-30 | -0.27 | 0.13 |
| 7 | 2012-01-03 → 2012-12-31 | 1.32 | 0.89 |
| 8 | 2013-01-02 → 2013-12-31 | 2.25 | 2.42 |
| 9 | 2014-01-02 → 2014-12-31 | 1.06 | 1.23 |
| 10 | 2015-01-02 → 2015-12-31 | -0.10 | -0.14 |
| 11 | 2016-01-04 → 2016-12-30 | 1.26 | 1.11 |
| 12 | 2017-01-03 → 2017-12-29 | 1.64 | 2.18 |
| 13 | 2018-01-02 → 2018-12-31 | -0.80 | -0.61 |
| 14 | 2019-01-02 → 2019-12-31 | 1.91 | 1.75 |
| 15 | 2020-01-02 → 2020-12-31 | 0.07 | 0.17 |
| 16 | 2021-01-04 → 2021-12-31 | 1.84 | 1.87 |
| 17 | 2022-01-03 → 2022-12-30 | 0.02 | 0.03 |
| 18 | 2023-01-03 → 2023-12-29 | 0.94 | 0.82 |
| 19 | 2024-01-02 → 2024-12-31 | 1.33 | 1.28 |
| 20 | 2025-01-02 → 2025-12-31 | 1.21 | 1.72 |
2.2b The family, walk by walk
Figure 6 draws these walks; here is every one of them in numbers, the paper’s own walk first and the study’s benchmark last.
| Walk | Windows | Span | Growth | CAGR | Worst drawdown | Pooled Sharpe |
|---|---|---|---|---|---|---|
| book-to-market · top third, value weight · Book-to-market (this paper) | 20 | 2006-01-03 → 2025-12-31 | +275.1% | +6.8% | -69.3% | 0.41 |
| book-to-market · top third, value weight · Earnings yield (this paper) | 20 | 2006-01-03 → 2025-12-31 | +471.7% | +9.1% | -54.9% | 0.54 |
| book-to-market · thirty names, equal weight · Book-to-market | 20 | 2006-01-03 → 2025-12-31 | +610.0% | +10.3% | -74.0% | 0.54 |
| book-to-market · thirty names, equal weight · Earnings yield | 20 | 2006-01-03 → 2025-12-31 | +544.8% | +9.8% | -58.2% | 0.53 |
| book-to-market · thirty names, value weight · Book-to-market | 20 | 2006-01-03 → 2025-12-31 | +299.6% | +7.2% | -73.0% | 0.42 |
| book-to-market · thirty names, value weight · Earnings yield | 20 | 2006-01-03 → 2025-12-31 | +280.4% | +6.9% | -57.1% | 0.41 |
| book-to-market · top third, equal weight · Book-to-market | 20 | 2006-01-03 → 2025-12-31 | +380.9% | +8.2% | -66.7% | 0.47 |
| book-to-market · top third, equal weight · Earnings yield | 20 | 2006-01-03 → 2025-12-31 | +521.7% | +9.6% | -55.9% | 0.55 |
| book-to-market · the spread, top third against bottom third · Book-to-market | 20 | 2006-01-03 → 2025-12-31 | -54.6% | -3.9% | -57.8% | -0.51 |
| book-to-market · the spread, top third against bottom third · Earnings yield | 20 | 2006-01-03 → 2025-12-31 | -41.3% | -2.6% | -48.3% | -0.39 |
| gross profitability · thirty names, equal weight · Gross profitability | 20 | 2006-01-03 → 2025-12-31 | +745.4% | +11.3% | -51.7% | 0.64 |
| gross profitability · thirty names, equal weight · Earnings yield | 20 | 2006-01-03 → 2025-12-31 | +544.8% | +9.8% | -58.2% | 0.53 |
| dividend yield · thirty names, equal weight · Dividend yield | 20 | 2006-01-03 → 2025-12-31 | +424.1% | +8.6% | -70.6% | 0.48 |
| dividend yield · thirty names, equal weight · Earnings yield | 20 | 2006-01-03 → 2025-12-31 | +544.8% | +9.8% | -58.2% | 0.53 |
| dividend yield · thirty names, value weight · Dividend yield | 20 | 2006-01-03 → 2025-12-31 | +284.5% | +7.0% | -73.5% | 0.42 |
| dividend yield · thirty names, value weight · Earnings yield | 20 | 2006-01-03 → 2025-12-31 | +280.4% | +6.9% | -57.1% | 0.41 |
| gross profitability · thirty names, value weight · Gross profitability | 20 | 2006-01-03 → 2025-12-31 | +1915.5% | +16.2% | -41.2% | 0.83 |
| gross profitability · thirty names, value weight · Earnings yield | 20 | 2006-01-03 → 2025-12-31 | +280.4% | +6.9% | -57.1% | 0.41 |
| dividend yield · top third, equal weight · Dividend yield | 20 | 2006-01-03 → 2025-12-31 | +468.4% | +9.1% | -59.9% | 0.54 |
| dividend yield · top third, equal weight · Earnings yield | 20 | 2006-01-03 → 2025-12-31 | +521.7% | +9.6% | -55.9% | 0.55 |
| dividend yield · top third, value weight · Dividend yield | 20 | 2006-01-03 → 2025-12-31 | +407.2% | +8.5% | -59.4% | 0.54 |
| dividend yield · top third, value weight · Earnings yield | 20 | 2006-01-03 → 2025-12-31 | +471.7% | +9.1% | -54.9% | 0.54 |
| dividend yield · the spread, top third against bottom third · Dividend yield | 20 | 2006-01-03 → 2025-12-31 | -56.6% | -4.1% | -60.1% | -0.53 |
| dividend yield · the spread, top third against bottom third · Earnings yield | 20 | 2006-01-03 → 2025-12-31 | -41.3% | -2.6% | -48.3% | -0.39 |
| gross profitability · top third, equal weight · Gross profitability | 20 | 2006-01-03 → 2025-12-31 | +748.6% | +11.3% | -50.3% | 0.67 |
| gross profitability · top third, equal weight · Earnings yield | 20 | 2006-01-03 → 2025-12-31 | +521.7% | +9.6% | -55.9% | 0.55 |
| low net issuance · the spread, top third against bottom third · Low net issuance | 20 | 2006-01-03 → 2025-12-31 | -14.7% | -0.8% | -32.5% | -0.11 |
| low net issuance · the spread, top third against bottom third · Earnings yield | 20 | 2006-01-03 → 2025-12-31 | -41.3% | -2.6% | -48.3% | -0.39 |
| gross profitability · top third, value weight · Gross profitability | 20 | 2006-01-03 → 2025-12-31 | +1307.2% | +14.1% | -43.7% | 0.80 |
| gross profitability · top third, value weight · Earnings yield | 20 | 2006-01-03 → 2025-12-31 | +471.7% | +9.1% | -54.9% | 0.54 |
| low net issuance · top third, value weight · Low net issuance | 20 | 2006-01-03 → 2025-12-31 | +694.7% | +10.9% | -50.7% | 0.63 |
| low net issuance · top third, value weight · Earnings yield | 20 | 2006-01-03 → 2025-12-31 | +471.7% | +9.1% | -54.9% | 0.54 |
| gross profitability · the spread, top third against bottom third · Gross profitability | 20 | 2006-01-03 → 2025-12-31 | +90.2% | +3.3% | -12.8% | 0.54 |
| gross profitability · the spread, top third against bottom third · Earnings yield | 20 | 2006-01-03 → 2025-12-31 | -41.3% | -2.6% | -48.3% | -0.39 |
| low net issuance · top third, equal weight · Low net issuance | 20 | 2006-01-03 → 2025-12-31 | +605.9% | +10.3% | -57.7% | 0.59 |
| low net issuance · top third, equal weight · Earnings yield | 20 | 2006-01-03 → 2025-12-31 | +521.7% | +9.6% | -55.9% | 0.55 |
| low net issuance · thirty names, value weight · Low net issuance | 20 | 2006-01-03 → 2025-12-31 | +502.1% | +9.4% | -51.3% | 0.55 |
| low net issuance · thirty names, value weight · Earnings yield | 20 | 2006-01-03 → 2025-12-31 | +280.4% | +6.9% | -57.1% | 0.41 |
| low net issuance · thirty names, equal weight · Low net issuance | 20 | 2006-01-03 → 2025-12-31 | +647.3% | +10.6% | -62.1% | 0.58 |
| low net issuance · thirty names, equal weight · Earnings yield | 20 | 2006-01-03 → 2025-12-31 | +544.8% | +9.8% | -58.2% | 0.53 |
| platform reference (SPY) (benchmark) | 2006-01-03 → 2025-12-31 | +515.1% | +9.5% | -60.7% |
2.3 Search accounting
This paper's search is a declared family: a declared family, counted at N = 20 evaluated books. Every member is either a registered walk with its own sealed hypothesis and frozen record, or a derived average computed from those frozen records; every member is reported, in the family matrix table and the robustness figure, and none was selected away. The count is declared by the author rather than derived from one project's ledger, because the members are sibling registered studies; the declaration names them and is frozen in this artifact. What the source strategy's author searched before publishing is not knowable from here and is not counted. The registered per-step record below still guarantees each window's hypothesis was hashed and registered before that window was scored.
2.4 The comparison
Both arms trade the same registered windows, so their returns can be PAIRED: inside each window the two return series are inner-joined date by date and the difference rBook-to-market − rEarnings yield is the object under test. Because this is ONE pre-declared contrast, frozen at registration before any window was scored, the paired statistic needs no multiple-testing deflation; the arm-level records carry the declared family count of §2.3 as their search accounting, and this contrast, sealed per window before scoring, is not multiplied by it.
| # | Window | Paired bars | Book-to-market | Earnings yield | Δ | Leader |
|---|---|---|---|---|---|---|
| 1 | 2006-01-04 → 2006-12-29 | 250 | +17.2% | +18.4% | -1.2 pp | Earnings yield |
| 2 | 2007-01-04 → 2007-12-31 | 250 | -4.3% | +2.9% | -7.1 pp | Earnings yield |
| 3 | 2008-01-03 → 2008-12-31 | 252 | -44.5% | -33.9% | -10.6 pp | Earnings yield |
| 4 | 2009-01-05 → 2009-12-31 | 251 | +23.3% | +18.2% | +5.0 pp | Book-to-market |
| 5 | 2010-01-05 → 2010-12-31 | 251 | +11.5% | +10.8% | +0.7 pp | Book-to-market |
| 6 | 2011-01-04 → 2011-12-30 | 251 | -10.9% | +0.3% | -11.2 pp | Earnings yield |
| 7 | 2012-01-04 → 2012-12-31 | 249 | +21.1% | +12.7% | +8.4 pp | Book-to-market |
| 8 | 2013-01-03 → 2013-12-31 | 251 | +31.8% | +30.3% | +1.5 pp | Book-to-market |
| 9 | 2014-01-03 → 2014-12-31 | 251 | +12.4% | +14.3% | -1.9 pp | Earnings yield |
| 10 | 2015-01-05 → 2015-12-31 | 251 | -3.0% | -3.6% | +0.6 pp | Book-to-market |
| 11 | 2016-01-05 → 2016-12-30 | 251 | +19.8% | +16.3% | +3.6 pp | Book-to-market |
| 12 | 2017-01-04 → 2017-12-29 | 250 | +14.5% | +19.9% | -5.3 pp | Earnings yield |
| 13 | 2018-01-03 → 2018-12-31 | 250 | -13.2% | -10.2% | -2.9 pp | Earnings yield |
| 14 | 2019-01-03 → 2019-12-31 | 251 | +25.0% | +24.4% | +0.6 pp | Book-to-market |
| 15 | 2020-01-03 → 2020-12-31 | 252 | -5.8% | -0.9% | -4.9 pp | Earnings yield |
| 16 | 2021-01-05 → 2021-12-31 | 251 | +34.6% | +29.0% | +5.6 pp | Book-to-market |
| 17 | 2022-01-04 → 2022-12-30 | 250 | -1.8% | -1.5% | -0.3 pp | Earnings yield |
| 18 | 2023-01-04 → 2023-12-29 | 249 | +12.3% | +11.7% | +0.5 pp | Book-to-market |
| 19 | 2024-01-03 → 2024-12-31 | 251 | +16.0% | +15.7% | +0.4 pp | Book-to-market |
| 20 | 2025-01-03 → 2025-12-31 | 249 | +19.3% | +34.7% | -15.4 pp | Earnings yield |
Paired Sharpe of the difference track: -0.23 · block bootstrap (2000 paths, block 10, seed 1234): P(Book-to-market beats Earnings yield) = 14.3%.
Window win-rate. Book-to-market led 10 of 20 windows (50.0%), Earnings yield led 10, and the mean window gap of -1.71 pp points the same way. Widest single window: 2025 at -15.4 pp.
| Period | Windows | Book-to-market | Earnings yield | Mean gap | Book-to-market led |
|---|---|---|---|---|---|
| All windows | 20 | +8.77% | +10.47% | -1.71 pp | 10/20 |
| Before 2010 | 4 | -2.08% | +1.40% | -3.47 pp | 1/4 |
| 2010 onward | 16 | +11.48% | +12.74% | -1.27 pp | 9/16 |
3 The circuit
The strategy is a circuit of platform primitives, frozen when the study is registered. Below is the circuit as wired on the canvas, the objective it encodes and how the search runs through it, followed by the mathematics each primitive actually computes, the same formulas the execution engine runs. The complete parameterisation is preserved in the study ledger (Appendix A).
The sentence below is the registration record, generated when the circuit was sealed and printed verbatim; the authored description of the design is Section 1.
A COMPARATIVE study: Book-to-market vs Earnings yield, walked on the same registered out-of-sample windows. Book-to-market: S&P 500, held as a buy-and-hold basket, and run out-of-sample from the anchor: anything the design estimates from history, where it estimates at all, is re-estimated at each anchor from pre-anchor data only, and the walk advances through registered out-of-sample windows; its disposition is the realized forward path versus the benchmark. Earnings yield: S&P 500, held as a buy-and-hold basket, and run out-of-sample from the anchor: anything the design estimates from history, where it estimates at all, is re-estimated at each anchor from pre-anchor data only, and the walk advances through registered out-of-sample windows; its disposition is the realized forward path versus the benchmark. The arms differ in: Value Factor, earnings_yield: off → high; Value Factor, pb_ratio: high → off. The contrast under test: whether Book-to-market generates better risk-adjusted returns than Earnings yield over the identical out-of-sample windows.
Every walk runs on the platform's own blocks: the point-in-time universe, the fundamentals loader, the factor families and composite, the factor select (with a fraction cut for the top third), the portfolio builder (value weights on point-in-time market caps), the long/short node (with 30 percent tails and value-weighted legs), the portfolio forward test in total returns and the transaction-cost overlay. The three knobs added for this paper default to the old behaviour, so every earlier registered circuit executes unchanged.
Envelopes show counts, ratios, dates, and the parameters the author chose. Full price and per-name data series are not republished: the underlying market data is licensed to QuanterLab. Point figures quoted in the prose, a named holding's return over a stated span, are summary facts derived from public market prices, not redistributed series.
The objective and the search
Book-to-market
| Universe | S&P 500 index constituents. |
|---|---|
| Validation & out-of-sample | portfolio forward test (buy-and-hold book) (1y horizon from the anchor, held (no rebalance)); overlays: Transaction Cost. |
| Other components | Combine: Portfolio Σ; Factor models: Factor Composite, Factor Select, Fundamentals Loader (PIT), Value Factor. |
Earnings yield
The specification is identical to Book-to-market's table above, row for row; the one sealed difference between the arms is itemized below.
What differs between the arms, one manipulated variable, expressed as 2 paired settings on one node:
- paramValue Factor, earnings_yield: off → high
- paramValue Factor, pb_ratio: high → off
Everything else is held identical, so an out-of-sample gap between the arms is attributable to this one change.
Cost elements are wired into the circuit, the realised drag is reported per step in Appendix B.
Show the mathematics, 10 primitives, formulas and parity notes
3.1 Universe
The starting set of tickers, resolved point-in-time from the index change-log, so names delisted or removed later still compete on the dates they traded.
Before any math, you need a list of stocks. An index preset (S&P 500, Nasdaq-100, Dow 30) is reconstructed as it stood ON your anchor date by replaying the historical add/drop change-log backwards, so a 2018 backtest sees the 2018 membership, not today's winners.
Start from today's constituents and un-apply every membership change after the anchor t:
\mathcal{U}(t) = \mathcal{U}_{\text{now}} \;\ominus\; \{\text{adds after } t\} \;\oplus\; \{\text{drops after } t\}3.2 Price Loader
Bulk OHLCV fetch for the whole universe, point-in-time, no future bars.
Momentum, volatility, trend, every price-based metric needs history. This loads open/high/low/close/volume for all names in parallel, clipped so nothing after the anchor can leak in. The lookback window is derived automatically from the deepest metric you wired.
It loads exactly enough history for the hungriest downstream metric plus a warm-up buffer:
W = \max_k(\text{lookback}_k) + \text{buffer}, \qquad \text{bars} \le \text{anchor } t3.3 Factor Loader
Point-in-time fundamentals, never let the user see a number before the SEC did.
Loads ~23 fundamental metrics (valuation, quality, growth) per name, but with one inviolable rule: a financial statement becomes visible only on or after its SEC acceptedDate. A 2020 backtest sees only what was actually filed by 2020, no look-ahead, ever.
\text{visible}(f, t) \iff \text{acceptedDate}(f) \le t3.4 Factor Value
Value, how cheap is the stock, cross-sectionally?
Blends cheapness metrics, P/E, P/B, P/S, EV/EBITDA (lower is better) plus free-cash-flow and earnings yields (higher is better). Each metric is z-scored across the universe, winsorized against outliers, weighted by the importance you set (Off/Low/Med/High), and averaged.
z_{i,k} = \pm\,\frac{x_{i,k} - \bar x_k}{s_k}\text{Value}_i = \frac{\sum_k \omega_k\,z_{i,k}}{\sum_k \omega_k}, \quad \omega \in \{0,\,0.5,\,1,\,2\}3.5 Factor Composite
The weighting console, blend Value, Quality, Momentum, Growth into one 0–100 score.
Where the four factor families become a single ranking. Each family score is standardized across the universe, blended with your slider weights (or the radar's suggested tilt), and min-max scaled to 0–100. Winsorizing tames outliers; z-score or percentile normalization is your choice.
z_{i,f} = \frac{x_{i,f} - \bar x_f}{s_f}\quad(\text{clipped at the 1st / 99th percentile})C_i = \sum_f W_f\,z_{i,f}, \qquad \text{score}_i = 100\cdot\frac{C_i - \min_j C_j}{\max_j C_j - \min_j C_j}3.6 Factor Top Tier
The cut out of the factor lane, keep the top-ranked names.
Takes the composite-ranked factor set and keeps the best N, carrying the composite score, the four family scores and the point-in-time market cap for each survivor. Feed 10–20 to a direct portfolio, or 30–100 as an optimizer pool.
\{\, i : \operatorname{rank}(C_i) \le N\,\}, \quad C_i = \text{composite score}3.7 Portfolio Builder
From "which names" to "how much of each", the weighting rules.
Turns a basket into capital weights by a simple rule: equal weight, score-weighted, inverse-volatility, or cap-weighted. An optional max-weight cap waterfills the excess onto the under-cap names so nothing is over-concentrated.
w_i^{\text{eq}}=\tfrac1N,\quad w_i^{\text{score}}\propto \text{score}_i,\quad w_i^{\text{ivol}}\propto \tfrac{1}{\sigma_i},\quad w_i^{\text{cap}}\propto \text{mktcap}_iClip any weight above the cap, redistribute the excess proportionally to names still under the cap, and repeat until none exceed it (≤ 24 rounds).
w_i \leftarrow \min(w_i, w_{\max}); \;\; \text{redistribute excess} \propto w_j\,[w_j < w_{\max}]3.8 Portfolio Backtest
Replay the portfolio forward, rebalanced, point-in-time, with costs.
Holds the basket and rebalances on schedule, re-selecting and re-optimizing point-in-time at each rebalance (so it only ever uses information available then), and reports the equity curve, Sharpe, drawdown and trade stats, optionally net of cost and risk overlays.
E_t = E_{t-1}\big(1 + \mathbf w_{t}^{\top}\mathbf r_t - \text{costs}_t\big)\text{DD}_t = \frac{E_t}{\max_{\tau\le t}E_\tau} - 1, \qquad \text{MaxDD} = \min_t \text{DD}_t\text{charge}_t \;=\; \text{loan}_t \cdot \frac{\text{spread}}{252}, \qquad \text{loan}_t = \begin{cases}\max(0,\,-\text{cash}_t) & \text{institutional (netted)}\\ \max(0,\,\text{long MV}_t - E_t) & \text{retail (no netting)}\end{cases}3.9 Portfolio Forward Autopsy
The post-mortem, where the forward test’s return actually came from.
Runs after the Portfolio Forward Test and dissects its realized path: per-rebalance contributions, winners and losers, exposure and cash periods, and how the realized route compares to what the risk cones projected. It computes nothing new about the future, it explains the past the book just lived.
Depth I–IV: headline attribution, per-segment breakdown, per-name contributions, and the calibration ledger (projected cone vs realized, segment by segment). In a study, this is the node that fills the appendices.
3.10 Transaction Cost
Charge for trading, slippage + commission on every turn.
Real trading isn't free. This deducts a cost proportional to how much you trade (turnover), in basis points, so the backtest reflects net, not gross, performance.
\text{cost}_t = \frac{\text{bps}}{10{,}000}\;\times\;\text{turnover}_t, \qquad \text{turnover}_t = \tfrac12\sum_i \lvert w_{i,t}-w_{i,t^-}\rvert4 Discussion
4.1 Findings
Figure 2 puts the three versions on one axis and Table 1 carries their returns. For value the literature's top 30 percent made 9.6 percent a year, the same construction inside the S&P 500 made 6.8, and the thirty equal-weighted names 10.3, against 9.5 for the index fund and 10.8 for SPY. For dividend yield the three versions sit at 9.5, 8.5 and 8.6, all below the index fund. For profitability they sit at 13.2, 14.1 and 11.3, all above SPY. For low net issuance at 11.6, 10.9 and 10.6, within a point of each other and of SPY. The screen, earnings yield, made 9.8 a year in the library and 9.1 as the top third at market value here.
Value. The thirty equal-weighted names ended 0.5 points a year ahead of the thirty-name earnings-yield screen, on 60 percent of paths, a tie by the rule of the opening section. Three of the other four ended behind the screen: the top third at equal weight on 23 percent of paths, the top third at market value on 14 percent of paths, the spread on 17 percent of paths. Thirty names at market value ended 0.3 points a year ahead on 58 percent of paths, a second tie. Table 3 has the four corners. From thirty names to the top third at equal weight the portfolio gives up 2.1 points a year; from equal to market-value weight in thirty names it gives up 3.1; both moves together give up 3.5. The thirty names led the fund's construction in 11 of 20 years by 4.3 points a year on average, with the median year a wash at 0.2, and the bootstrap of the twenty annual differences puts the chance of no lead at 1.1 percent. The lead is four years: 2009, 2010, 2013 and 2020, the rebounds, when the smaller and cheaper names in a thirty-name portfolio move further than the banks that dominate a value portfolio at market value; Citigroup, General Electric, Bank of America and AIG were 33 percent of that portfolio in 2006, Berkshire Hathaway and JPMorgan 16 percent of it in 2025. From 2010 on, where the scored pool covers at least 81 percent of the members, the lead is 3.6 points a year on 8 of 16 years, the median -0.4, the chance of no lead 2.3 percent: the magnitude survives the cut and the sign test does not.
Dividend yield. No construction ended ahead of the screen: the thirty equal-weighted names on 33 percent of paths, the top third at equal weight on 29 percent of paths, the top third at market value on 23 percent of paths, the spread on 10 percent of paths. Thirty names at market value ended 0.1 points a year ahead on 46 percent of paths, a tie. The dividend part is the largest of the four signals, 4.2 points a year in the thirty names and 4.3 in the library's top 30 percent, and the price part is what the portfolio gives back: the library's high-yield top 30 percent made 5.3 percent a year before dividends against 9.5 for the whole. The four long portfolios land between 7.0 and 9.1 a year, so the construction moves dividend yield very little and the signal is what falls short.
Profitability. No construction ended behind the screen: the thirty equal-weighted names on 57 percent of paths, a tie by the rule of the opening section, then the top third at equal weight on 77 percent of paths, the top third at market value on 96 percent of paths and in 15 of 20 years, the spread on 99 percent of paths. The spread is the only one of the four that made money, $1.90 on a dollar, 3.3 percent a year against -2.6 for the screen's, and the library's operating-profitability spread made 5.6 a year on all stocks. The construction moves this signal the other way from value: the thirty names trailed the fund's construction in 13 of 20 years by 3.2 points a year, and thirty names at market value made $20.17 on a dollar, 16.2 a year. That portfolio is a position in a handful of companies: the five largest weights were 38 to 84 percent of it, Amazon was 48 percent of it in 2020, Nvidia 37 percent in 2024 and 62 percent in 2025, and those three years returned 50, 77 and 25 percent. The 16.2 a year is what the most profitable large companies at market value did in these twenty years. From 2010 on the thirty names trailed the fund's construction by 4.9 points a year on 12 of 16 years, a larger deficit than the full sample's and in the same direction.
Low net issuance. No construction ended behind the screen. The thirty equal-weighted names ended 0.8 points a year ahead on 55 percent of paths, a tie; the other three long constructions ended ahead by 0.7 to 2.5 points on 76 to 83 percent of paths; the spread lost 0.8 a year against 2.6 for the screen's, the one spread that ended ahead of the screen's while losing money. In the library net repurchasers made 11.6 a year against 7.3 for the heaviest issuers, a spread of 4.3 points on all stocks and 2.8 in the large half; inside the S&P 500 the lowest third against the highest third gave -0.8. The corners are within 1.5 points of each other, and the thirty names and the fund's construction split the years 8 to 12. Buybacks are a signal whose return sits with the smaller issuers and repurchasers outside the index, which is where the library's equal-weighted spread of 12.1 points a year comes from.
Figure 4 chains the four spreads inside the S&P 500 and Table 4 sets them beside the library's. Three lost money over twenty years: value $0.45 on a dollar, dividend yield $0.43, net issuance $0.85, against $0.59 for the earnings-yield spread, which is the same portfolio in all four walks. Profitability's made $1.90. The library's spreads on all stocks over the same calendar years: value -3.5 points a year, dividend yield -1.5, earnings yield -2.5, profitability 5.6, net issues 4.3. The signs agree on four of five; net issuance is the one that flips between the library and the index.
Figure 5 colours each year by the thirty names' lead over the fund's construction. Value's lead comes from four rebound years and is small or negative in the other sixteen; profitability's deficit comes from 2015 and 2016 and from 2023 to 2025, the years the largest companies ran; dividend yield and net issuance alternate.
4.2 Interpretation
Two things separate thirty equal-weighted names from the top third at market value: breadth, thirty names against 114 to 166, and weighting, one over thirty against market value with no cap. For value both subtract, 2.1 points a year for breadth and 3.1 for weighting. For profitability both add return, and the weighting adds 5.0 points. The mechanism is the same in both: market-value weighting hands the portfolio to its largest names, and in a value portfolio those were banks, in a profitability portfolio the technology and consumer companies that outgrew the market from 2015 on. Equal weight pays when the smaller names in the portfolio do as well as the larger; over these twenty years they did in a value portfolio and did not in a profitability portfolio.
Three of the four signals give about the same number in the library and inside the S&P 500 on the same construction: value 9.6 against 6.8, dividend yield 9.5 against 8.5, profitability 13.2 against 14.1. Net issuance's spread does not survive the step, 4.3 points a year in the library, -0.8 inside the index, and the library's large half already shows most of the loss, 2.8. The buyback premium lives among the smaller repurchasers, and the index does not hold them.
A buyer of a large-cap factor fund holds something near the middle version, the top third at market value, and over these twenty years it ended ahead of the index fund for profitability and net issuance and behind it for value and dividend yield. A private investor running thirty names holds the thirty-name version, which ended ahead of the index fund for value, profitability and net issuance and behind it for dividend yield, and which is a different trade from the fund's construction. The plain screen made 9.8 a year as thirty names and 9.1 as the top third at market value: it sits within a point of every value and dividend construction and above all of them except the thirty equal-weighted value names, and only the profitability portfolios clear it by more than a point.
This study is one member of a declared search family: the same design walked at several sealed settings across sibling registered projects, every member either a registered walk with its own frozen record or a derived average of those records, and every member reported. The family size is declared by the author and named in the lineage; it is the search-accounting count for this paper. What was searched before the source strategy was published is not knowable from here and is not counted.
The record
Every window of the twenty walks was registered on the platform before it ran, with its circuit hash and prospectus, and its report was frozen when it landed; no window was re-run after its report landed, and no result in this paper was recomputed after the walks finished. The twenty walks are declared as one search family of twenty on the host study, so the count behind every comparison is public. Thirteen unregistered runs of the book-to-market pair at the 2006 anchor preceded the registered walks: engine checks of the three constructions that were new to the platform, with one record-keeping change between them, holding the anchor portfolio for the year instead of re-selecting it on the last day. They are counted in the family's declaration and none of their numbers appears here.
During the walks a second copy of one supervisor started a second run on the 2006 window of the net-issuance spread. The platform refused the duplicate's registrations, the two runs of that window are identical, and the extraction keeps one. Two further walks, value's top third at market value and its spread on July anchors, were registered the same way after the family had finished and are reported under Limitations and in Table 7; they are not members of the family count. The twenty-two study identifiers are in the appendix table. The records they name are held on the platform: the published paper's page at quanterlab.com carries every walk's chained curve and numbers in its family figure and table, and any walk's per-window reports, frozen circuit and search accounting are available from the author.
Conclusion
Two findings. Whether a signal ends ahead of a plain earnings-yield screen is decided by the signal and is the same in every version: value and dividend yield never end ahead of it in the library, inside the index at fund size or in thirty names, and profitability and low issuance never end behind it. How much a portfolio makes is decided by the construction, and the construction pushes value and profitability in opposite directions through one mechanism, market-value weighting handing the portfolio to its largest names. A private investor's thirty names are therefore a different trade from a fund's construction, better for value over these twenty years by 3.5 points a year on the strength of four rebound years, worse for profitability by 2.9 points because the largest profitable companies were the decade's winners.
Where the story stops. The July-anchored value walks reported under Limitations put the formation-month step between the library's version and this paper's at a fraction of a point; the universe and data-source steps remain joined at about two and a half points for value. A different twenty years would change the returns and could change the sign of value's lead, which rests on four years; they would not change the first finding unless the earnings-yield screen itself stopped tying the price signals, and on the library's own numbers it has tied them since 2006.
Data availability, funding and disclosure
The French library files are public (reference 15). The vendor is Financial Modeling Prep; the point-in-time membership, filings and prices used here are the vendor's tables as frozen on 13 September 2026, and the twenty-two registered walks with their per-window reports, frozen circuits and search accounting are the platform records named in this paper's tables; the paper's page at quanterlab.com carries every walk's chained curve and numbers in its family figure, and the per-window reports are available from the author. No external funding was received. The author owns QuanterLab, the platform on which the walks ran, and holds no position in any security named in the paper.
This paper is research. It is not investment advice, and nothing in it is a recommendation to buy or sell any security or fund.
4.3 Limitations
A point-in-time result is vintage-dependent even when the method is frozen. An earlier set of thirty-name walks of the same four signals against the same screen (references 11 to 14) was made in August 2026 on the vendor's tables of that month; the twenty walks here were made in September on one vintage, and Table 6 compares the thirty-name walks with those published rows window by window. Value matches to within a point in 19 of 20 windows on the price basis the published study used; dividend yield in 17, net issuance in 16, profitability in 15. The earnings-yield screen differs by eight points in the 2017 window in all four (published 20.3 percent, re-walk 12.0), and the profitability portfolio by eight in the same window: the vendor's filing tables moved between the two months. This is why the twenty walks here sit on one vintage, and why the published rows are quoted for the comparison and nowhere else. The re-walk also changes one of the four earlier verdicts: on one vintage with dividends and costs charged, dividend yield stops tying the screen in the thirty-name construction and ends behind it, on 33 percent of paths; value, profitability and low issuance still tie there.
The scored pool is 343 names of the 493 members in 2006 and 498 of 499 in 2025, so the early top thirds are 114 names drawn from the two thirds of the index that carried a usable filing, and the early portfolios lean toward companies the vendor covers back to 2006. Two of value's four lead years, 2009 and 2010, fall inside that period; the cut from 2010 in Table 3 keeps the magnitude of the lead and loses the sign test. Among the top thirds at market value, one or two names a year carried no point-in-time market value from 2006 to 2013 (value and profitability) and weighed nothing that year; dividend yield and net issuance carried none. Two share classes of one company count as two names.
Twenty comparisons are reported and no multiplicity correction is applied to them; the two July walks were registered after the family closed and are not in the count of twenty. All twenty were registered before they ran and are declared as one family, so the count is public and the reader can apply the correction of their choice; the paired shares are reported for every construction in place of a single verdict.
The spreads charge no borrow and no financing, the way the literature quotes a factor, and pay the same 0.05 percent a trade as the long portfolios; a spread that lost 3.9 percent a year gross of borrow loses more net of it. The library's rows are gross of all costs; at 0.05 percent each way the whole annual reformation costs 0.1 points, which moves no comparison in the tables.
The library forms at the end of June on the prior December's accounts; this paper forms on January 1 on the latest accepted filing, fresher than theirs. Two more registered walks measure that step: value's top third at market value and its spread on July anchors, twenty windows from July 2006 to July 2026, everything else as in the family. On July anchors the top third made 7.7 percent a year against 6.8 on January, the earnings-yield screen 10.2 against 9.1, the index fund 10.2 against 9.5 over the shifted years, and the verdict is the same on both anchors, behind the screen on 15 and 14 percent of paths. The library's value top 30 percent over the same July-to-June years made 10.3, so the gap to the library is 2.6 points on July anchors against 2.8 on January: the formation month accounts for a fraction of a point of the step from the library's version to this paper's, and the universe and the data source for the rest. The spread on July anchors lost 2.6 a year against 3.9 on January and 3.0 in the library over the July-to-June years. The library's profitability and net-issues sorts are the nearest published relatives of this paper's variables, and the text says so where they are compared.
Computed, not featured
The run produced the results below. The author chose not to feature them in this paper; they were computed all the same, are part of the frozen record, and are reproducible from the study's frozen circuit.
- Projection calibration, 40 rebalance projections, 10,022 VaR days. The forward tester itself. Every portfolio backtest fits a Monte Carlo cone and a VaR estimate before each rebalance and scores them against what happened, it is instrumentation on the test, not a primitive on the canvas. No Monte Carlo primitive is required, and adding one would be a separate, standalone analysis.
- The measurement ladder, 20 windows. The forward tester, per window: the same walk chained price-only, with dividends and net of costs, against the benchmark measured both ways.
References
- Gelman, A., & Loken, E. (2013). The garden of forking paths: Why multiple comparisons can be a problem, even when there is no “fishing expedition.” Working paper, Columbia University.
- Harvey, C. R., Liu, Y., & Zhu, H. (2016). … and the Cross-Section of Expected Returns. Review of Financial Studies, 29(1), 5–68. doi:10.1093/rfs/hhv059
- Lo, A. W. (2002). The Statistics of Sharpe Ratios. Financial Analysts Journal, 58(4), 36–52. doi:10.2469/faj.v58.n4.2453
- Fama, E. F. and K. R. French (1992), The cross-section of expected stock returns, Journal of Finance 47(2), 427-465: book-to-market and size absorb the roles of leverage and earnings yield in the cross-section; the portfolios are sorted on NYSE breakpoints and value-weighted.
- Fama, E. F. and K. R. French (1993), Common risk factors in the returns on stocks and bonds, Journal of Financial Economics 33(1), 3-56: HML built as the top 30 percent of book-to-market against the bottom 30 percent, value-weighted, formed at the end of June.
- Fama, E. F. and K. R. French (1996), Multifactor explanations of asset pricing anomalies, Journal of Finance 51(1), 55-84: the three-factor model absorbs the sorts on earnings to price, cash flow to price and sales growth.
- Fama, E. F. and K. R. French (2008), Dissecting anomalies, Journal of Finance 63(4), 1653-1678: net share issuance among the strongest anomalies in the cross-section, and the anomalies that live only in microcaps.
- Fama, E. F. and K. R. French (2015), A five-factor asset pricing model, Journal of Financial Economics 116(1), 1-22: profitability (RMW) and investment (CMA) added to the three factors.
- Novy-Marx, R. (2013), The other side of value: the gross profitability premium, Journal of Financial Economics 108(1), 1-28: gross profits over assets as the profitability measure.
- Loughran, T. (1997), Book-to-market across firm size, exchange, and seasonality: is there an effect?, Journal of Financial and Quantitative Analysis 32(3), 249-268: the book-to-market effect is weak among large caps; this paper's universe is that case.
- Litzenberger, R. H. and K. Ramaswamy (1979), The effect of personal taxes and dividends on capital asset prices: theory and empirical evidence, Journal of Financial Economics 7(2), 163-195: dividend yield priced in the cross-section.
- Miller, M. H. and F. Modigliani (1961), Dividend policy, growth, and the valuation of shares, Journal of Business 34(4), 411-433: the dividend irrelevance argument the dividend-yield portfolio is tested against.
- Plyakha, Y., R. Uppal and G. Vilkov (2012), Why does an equal-weighted portfolio outperform value- and price-weighted portfolios?, working paper: an equal-weighted portfolio of the same names outperforms the value-weighted one through its tilt to smaller names and the contrarian trade its rebalancing makes.
- QuanterLab (2026a), The choice that washes out: book-to-market against the earnings yield it displaces, research study bb0d8e579cb9, published 19 August 2026, quanterlab.com/research/the-choice-that-washes-out-book-to-market-against-the-earnings-yield-it-displace: thirty names at equal weight, price returns, no costs; a tie.
- QuanterLab (2026b), Paid to wait, paid less: dividend yield against earnings yield in total returns, research study e936a4c583f2, published 19 August 2026, quanterlab.com/research/paid-to-wait-paid-less-dividend-yield-against-earnings-yield-in-total-returns-tw: thirty names at equal weight, total returns, 0.05 percent a trade.
- QuanterLab (2026c), The compounders and the cigar butts: gross profitability against earnings yield in total returns, research study c161f435806d, published 19 August 2026, quanterlab.com/research/the-compounders-and-the-cigar-butts-gross-profitability-against-earnings-yield-i.
- QuanterLab (2026d), Paid in fewer shares: net issuance against earnings yield in total returns, research study 4a27f12c3841, published 19 August 2026, quanterlab.com/research/paid-in-fewer-shares-net-issuance-against-earnings-yield-in-total-returns-twenty.
- French, K. R. (2026), Data Library, Tuck School of Business at Dartmouth, mba.tuck.dartmouth.edu/pages/faculty/ken.french/data_library.html: portfolios formed on book-to-market, dividend yield, earnings/price, operating profitability and net share issues, and the size splits; files built on the July 2026 CRSP tape, accessed 14 September 2026.
Appendix A Reproducibility in QuanterLab
Each step is backed by a frozen run report. The study is re-derivable from the ledger below.
| # | Commit | Report | Anchor | OOS window |
|---|---|---|---|---|
| 1 | 392831a3a113 | 10363 | 2006-01-01 | 2006-01-03 → 2006-12-29 |
| 2 | 3c9a5c627a5a | 10364 | 2007-01-01 | 2007-01-03 → 2007-12-31 |
| 3 | 1833bdd6a359 | 10365 | 2008-01-01 | 2008-01-02 → 2008-12-31 |
| 4 | f178b2c66010 | 10366 | 2009-01-01 | 2009-01-02 → 2009-12-31 |
| 5 | 53119b580496 | 10367 | 2010-01-01 | 2010-01-04 → 2010-12-31 |
| 6 | 2bb8f48963a0 | 10368 | 2011-01-01 | 2011-01-03 → 2011-12-30 |
| 7 | ad0de1a27347 | 10369 | 2012-01-01 | 2012-01-03 → 2012-12-31 |
| 8 | 4fa0ca7e20fc | 10370 | 2013-01-01 | 2013-01-02 → 2013-12-31 |
| 9 | 5d3c3123fc5c | 10371 | 2014-01-01 | 2014-01-02 → 2014-12-31 |
| 10 | 2514f41f2278 | 10372 | 2015-01-01 | 2015-01-02 → 2015-12-31 |
| 11 | 89d74824b61d | 10373 | 2016-01-01 | 2016-01-04 → 2016-12-30 |
| 12 | e019b664ad6b | 10374 | 2017-01-01 | 2017-01-03 → 2017-12-29 |
| 13 | ed4a9e14f52a | 10375 | 2018-01-01 | 2018-01-02 → 2018-12-31 |
| 14 | b2b551b52ba9 | 10376 | 2019-01-01 | 2019-01-02 → 2019-12-31 |
| 15 | c8e1e8ed4364 | 10377 | 2020-01-01 | 2020-01-02 → 2020-12-31 |
| 16 | 905861762306 | 10378 | 2021-01-01 | 2021-01-04 → 2021-12-31 |
| 17 | 203e2e50eb71 | 10379 | 2022-01-01 | 2022-01-03 → 2022-12-30 |
| 18 | ea09409ca9de | 10380 | 2023-01-01 | 2023-01-03 → 2023-12-29 |
| 19 | 792710a60f5c | 10381 | 2024-01-01 | 2024-01-02 → 2024-12-31 |
| 20 | 8832ea7363b7 | 10382 | 2025-01-01 | 2025-01-02 → 2025-12-31 |
Appendix A2 Registration record
What this record does and does not establish. Every window in this study is historical: the data existed before the study began, so this is sequential sealing on past windows, not pre-registration in the clinical-trial sense, and no procedure could make it so. What the platform does enforce is order, each step's specification was frozen and hashed before that step was scored, and the walk cannot advance past a step that was never run or close one with a result registered for a different window. The two timestamp columns below are the evidence: read them together and each seal precedes its own run, and each run precedes the next seal. A study whose seals all post-date its runs would show it here. Wall-clock spacing between seals varies with the author's schedule and queue latency; the ordering, not the tempo, is the claim.
“A COMPARATIVE study: Book-to-market vs Earnings yield, walked on the same registered out-of-sample windows. Book-to-market: S&P 500, held as a buy-and-hold basket, and run out-of-sample from the anchor: anything the design estimates from history, where it estimates at all, is re-estimated at each anchor from pre-anchor data only, and the walk advances through registered out-of-sample windows; its disposition is the realized forward path versus the benchmark. Earnings yield: S&P 500, held as a buy-and-hold basket, and run out-of-sample from the anchor: anything the design estimates from history, where it estimates at all, is re-estimated at each anchor from pre-anchor data only, and the walk advances through registered out-of-sample windows; its disposition is the realized forward path versus the benchmark. The arms differ in: Value Factor, earnings_yield: off → high; Value Factor, pb_ratio: high → off. The contrast under test: whether Book-to-market generates better risk-adjusted returns than Earnings yield over the identical out-of-sample windows.”
The same hypothesis was registered independently at every step, hashed before each step's out-of-sample window was scored:
| # | Anchor | Registered at (UTC) | Run completed (UTC) |
|---|---|---|---|
| 1 | 2006-01-01 | 2026-09-14 07:48:51 | 2026-09-14 07:49:54 |
| 2 | 2007-01-01 | 2026-09-14 07:49:59 | 2026-09-14 07:51:20 |
| 3 | 2008-01-01 | 2026-09-14 07:51:25 | 2026-09-14 07:52:45 |
| 4 | 2009-01-01 | 2026-09-14 07:52:50 | 2026-09-14 07:54:10 |
| 5 | 2010-01-01 | 2026-09-14 07:54:16 | 2026-09-14 07:55:36 |
| 6 | 2011-01-01 | 2026-09-14 07:55:41 | 2026-09-14 07:57:02 |
| 7 | 2012-01-01 | 2026-09-14 07:57:07 | 2026-09-14 07:58:27 |
| 8 | 2013-01-01 | 2026-09-14 07:58:32 | 2026-09-14 07:59:53 |
| 9 | 2014-01-01 | 2026-09-14 07:59:58 | 2026-09-14 08:01:18 |
| 10 | 2015-01-01 | 2026-09-14 08:01:23 | 2026-09-14 08:02:44 |
| 11 | 2016-01-01 | 2026-09-14 08:02:49 | 2026-09-14 08:04:29 |
| 12 | 2017-01-01 | 2026-09-14 08:04:34 | 2026-09-14 08:06:15 |
| 13 | 2018-01-01 | 2026-09-14 08:06:20 | 2026-09-14 08:08:00 |
| 14 | 2019-01-01 | 2026-09-14 08:08:05 | 2026-09-14 08:09:46 |
| 15 | 2020-01-01 | 2026-09-14 08:09:51 | 2026-09-14 08:11:31 |
| 16 | 2021-01-01 | 2026-09-14 08:11:36 | 2026-09-14 08:13:17 |
| 17 | 2022-01-01 | 2026-09-14 08:13:22 | 2026-09-14 08:15:02 |
| 18 | 2023-01-01 | 2026-09-14 08:15:07 | 2026-09-14 08:16:48 |
| 19 | 2024-01-01 | 2026-09-14 08:16:53 | 2026-09-14 08:18:33 |
| 20 | 2025-01-01 | 2026-09-14 08:18:38 | 2026-09-14 08:20:19 |
Appendix B Per-step diagnostics
Realized in the projection tables below is the risk engine scoring its own forecast: the buy-and-hold return of the segment that followed each rebalance, on the same gross basis the cone was projected on. It is deliberately not the charged, calendar-window total return the study’s tables print, so the two will not reconcile line by line; the cone and its outcome share one basis, which is what a calibration test requires. Each row names its segment’s span so a boundary session is visible.
Names held is the union across the window: the count of distinct instruments the book touched between the window’s first and last session, not the number it held at one time. A book that rotates monthly touches more names than it holds.
What each step's run actually did beyond its return: capital allocation across lanes and regimes, the portfolio book's rebalancing and cost drag, and how positions were sized. Harvested from the frozen run reports, present where the circuit produced them.
Open the full per-step grid (20 steps: every rebalance, capital routing and sizing, per window)
Step 1 · 2006-01-03 → 2006-12-29
Book-to-market
Portfolio book, rebalanced annual · 2 constructions · 111 names held · selection: hold · 0.0% in cash · turnover 1.0× · cost drag 0.1% · 2 names dropped at load (113 selected, 111 held across the window), weights renormalised onto the rest
Projection accuracy, realized outcome fell inside the P5–P95 cone in 100.0% of 1 scored rebalances (a well-calibrated 90% band contains ~90.0%) · 95% VaR breached on 3.2% of 250 days (expected ~5.0%)
| Rebalance | P5 | Median | P95 | Realized | In band | VaR 95 (1d) | Breaches |
|---|---|---|---|---|---|---|---|
| 2006-01-01 → 2007-01-01 | -11.2898% | 6.5132% | 28.3081% | 15.6121% | yes | 1.2603% | 8 / 250 |
| 2007-01-01 | no segment follows this rebalance, not scored | ||||||
Earnings yield
Portfolio book, rebalanced annual · 2 constructions · 112 names held · selection: hold · 0.0% in cash · turnover 1.0× · cost drag 0.1% · 1 name dropped at load (113 selected, 112 held across the window), weights renormalised onto the rest
Projection accuracy, realized outcome fell inside the P5–P95 cone in 100.0% of 1 scored rebalances (a well-calibrated 90% band contains ~90.0%) · 95% VaR breached on 2.4% of 250 days (expected ~5.0%)
| Rebalance | P5 | Median | P95 | Realized | In band | VaR 95 (1d) | Breaches |
|---|---|---|---|---|---|---|---|
| 2006-01-01 → 2007-01-01 | -9.2602% | 8.9226% | 31.1768% | 16.3068% | yes | 1.2659% | 6 / 250 |
| 2007-01-01 | no segment follows this rebalance, not scored | ||||||
Step 2 · 2007-01-03 → 2007-12-31
Book-to-market
Portfolio book, rebalanced annual · 2 constructions · 115 names held · selection: hold · 0.0% in cash · turnover 1.0× · cost drag 0.1% · 2 names dropped at load (117 selected, 115 held across the window), weights renormalised onto the rest
Projection accuracy, realized outcome fell inside the P5–P95 cone in 0.0% of 1 scored rebalances (a well-calibrated 90% band contains ~90.0%) · 95% VaR breached on 14.4% of 250 days (expected ~5.0%)
| Rebalance | P5 | Median | P95 | Realized | In band | VaR 95 (1d) | Breaches |
|---|---|---|---|---|---|---|---|
| 2007-01-01 → 2008-01-01 | -3.7119% | 13.9215% | 35.1899% | -8.2141% | no | 1.0918% | 36 / 250 |
| 2008-01-01 | no segment follows this rebalance, not scored | ||||||
Earnings yield
Portfolio book, rebalanced annual · 2 constructions · 115 names held · selection: hold · 0.0% in cash · turnover 1.0× · cost drag 0.1% · 2 names dropped at load (117 selected, 115 held across the window), weights renormalised onto the rest
Projection accuracy, realized outcome fell inside the P5–P95 cone in 0.0% of 1 scored rebalances (a well-calibrated 90% band contains ~90.0%) · 95% VaR breached on 14.4% of 250 days (expected ~5.0%)
| Rebalance | P5 | Median | P95 | Realized | In band | VaR 95 (1d) | Breaches |
|---|---|---|---|---|---|---|---|
| 2007-01-01 → 2008-01-01 | -1.5434% | 17.798% | 41.3918% | -3.0738% | no | 1.0754% | 36 / 250 |
| 2008-01-01 | no segment follows this rebalance, not scored | ||||||
Step 3 · 2008-01-02 → 2008-12-31
Book-to-market
Portfolio book, rebalanced annual · 1 constructions · 117 names held · selection: hold · 0.0% in cash · turnover 1.0× · cost drag 0.1% · 6 names dropped at load (123 selected, 117 held across the window), weights renormalised onto the rest
Projection accuracy, realized outcome fell inside the P5–P95 cone in 0.0% of 1 scored rebalances (a well-calibrated 90% band contains ~90.0%) · 95% VaR breached on 31.35% of 252 days (expected ~5.0%)
| Rebalance | P5 | Median | P95 | Realized | In band | VaR 95 (1d) | Breaches |
|---|---|---|---|---|---|---|---|
| 2008-01-01 → window end | -17.426% | 4.5649% | 30.7308% | -46.3725% | no | 1.4681% | 79 / 252 |
Earnings yield
Portfolio book, rebalanced annual · 1 constructions · 118 names held · selection: hold · 0.0% in cash · turnover 1.0× · cost drag 0.1% · 6 names dropped at load (124 selected, 118 held across the window), weights renormalised onto the rest
Projection accuracy, realized outcome fell inside the P5–P95 cone in 0.0% of 1 scored rebalances (a well-calibrated 90% band contains ~90.0%) · 95% VaR breached on 23.41% of 252 days (expected ~5.0%)
| Rebalance | P5 | Median | P95 | Realized | In band | VaR 95 (1d) | Breaches |
|---|---|---|---|---|---|---|---|
| 2008-01-01 → window end | -8.775% | 16.4036% | 46.585% | -35.6752% | no | 1.4982% | 59 / 252 |
Step 4 · 2009-01-02 → 2009-12-31
Book-to-market
Portfolio book, rebalanced annual · 2 constructions · 126 names held · selection: hold · 0.0% in cash · turnover 1.0× · cost drag 0.1% · 2 names dropped at load (128 selected, 126 held across the window), weights renormalised onto the rest
Projection accuracy, realized outcome fell inside the P5–P95 cone in 100.0% of 1 scored rebalances (a well-calibrated 90% band contains ~90.0%) · 95% VaR breached on 6.77% of 251 days (expected ~5.0%)
| Rebalance | P5 | Median | P95 | Realized | In band | VaR 95 (1d) | Breaches |
|---|---|---|---|---|---|---|---|
| 2009-01-01 → 2010-01-01 | -59.2977% | -24.0438% | 43.0944% | 30.9797% | yes | 3.6303% | 17 / 251 |
| 2010-01-01 | no segment follows this rebalance, not scored | ||||||
Earnings yield
Portfolio book, rebalanced annual · 2 constructions · 127 names held · selection: hold · 0.0% in cash · turnover 1.0× · cost drag 0.1% · 2 names dropped at load (129 selected, 127 held across the window), weights renormalised onto the rest
Projection accuracy, realized outcome fell inside the P5–P95 cone in 100.0% of 1 scored rebalances (a well-calibrated 90% band contains ~90.0%) · 95% VaR breached on 5.18% of 251 days (expected ~5.0%)
| Rebalance | P5 | Median | P95 | Realized | In band | VaR 95 (1d) | Breaches |
|---|---|---|---|---|---|---|---|
| 2009-01-01 → 2010-01-01 | -43.3578% | -5.9597% | 57.3377% | 17.5605% | yes | 2.9022% | 13 / 251 |
| 2010-01-01 | no segment follows this rebalance, not scored | ||||||
Step 5 · 2010-01-04 → 2010-12-31
Book-to-market
Portfolio book, rebalanced annual · 2 constructions · 131 names held · selection: hold · 0.0% in cash · turnover 1.0× · cost drag 0.1% · 1 name dropped at load (132 selected, 131 held across the window), weights renormalised onto the rest
Projection accuracy, realized outcome fell inside the P5–P95 cone in 100.0% of 1 scored rebalances (a well-calibrated 90% band contains ~90.0%) · 95% VaR breached on 0.0% of 251 days (expected ~5.0%)
| Rebalance | P5 | Median | P95 | Realized | In band | VaR 95 (1d) | Breaches |
|---|---|---|---|---|---|---|---|
| 2010-01-01 → 2011-01-01 | -59.4377% | -7.7443% | 112.4638% | 10.9553% | yes | 4.6238% | 0 / 251 |
| 2011-01-01 | no segment follows this rebalance, not scored | ||||||
Earnings yield
Portfolio book, rebalanced annual · 2 constructions · 131 names held · selection: hold · 0.0% in cash · turnover 1.0× · cost drag 0.1% · 1 name dropped at load (132 selected, 131 held across the window), weights renormalised onto the rest
Projection accuracy, realized outcome fell inside the P5–P95 cone in 100.0% of 1 scored rebalances (a well-calibrated 90% band contains ~90.0%) · 95% VaR breached on 0.4% of 251 days (expected ~5.0%)
| Rebalance | P5 | Median | P95 | Realized | In band | VaR 95 (1d) | Breaches |
|---|---|---|---|---|---|---|---|
| 2010-01-01 → 2011-01-01 | -45.1126% | -1.9982% | 76.5303% | 9.2126% | yes | 3.4097% | 1 / 251 |
| 2011-01-01 | no segment follows this rebalance, not scored | ||||||
Step 6 · 2011-01-03 → 2011-12-30
Book-to-market
Portfolio book, rebalanced annual · 2 constructions · 135 names held · selection: hold · 0.0% in cash · turnover 1.0× · cost drag 0.1% · 1 name dropped at load (136 selected, 135 held across the window), weights renormalised onto the rest
Projection accuracy, realized outcome fell inside the P5–P95 cone in 100.0% of 1 scored rebalances (a well-calibrated 90% band contains ~90.0%) · 95% VaR breached on 5.18% of 251 days (expected ~5.0%)
| Rebalance | P5 | Median | P95 | Realized | In band | VaR 95 (1d) | Breaches |
|---|---|---|---|---|---|---|---|
| 2011-01-01 → 2012-01-01 | -21.0321% | 38.4874% | 144.9492% | -14.0939% | yes | 3.1141% | 13 / 251 |
| 2012-01-01 | no segment follows this rebalance, not scored | ||||||
Earnings yield
Portfolio book, rebalanced annual · 2 constructions · 134 names held · selection: hold · 0.0% in cash · turnover 1.0× · cost drag 0.1% · 2 names dropped at load (136 selected, 134 held across the window), weights renormalised onto the rest
Projection accuracy, realized outcome fell inside the P5–P95 cone in 100.0% of 1 scored rebalances (a well-calibrated 90% band contains ~90.0%) · 95% VaR breached on 3.59% of 251 days (expected ~5.0%)
| Rebalance | P5 | Median | P95 | Realized | In band | VaR 95 (1d) | Breaches |
|---|---|---|---|---|---|---|---|
| 2011-01-01 → 2012-01-01 | -29.4473% | 20.0185% | 105.8201% | -2.2861% | yes | 3.0505% | 9 / 251 |
| 2012-01-01 | no segment follows this rebalance, not scored | ||||||
Step 7 · 2012-01-03 → 2012-12-31
Book-to-market
Portfolio book, rebalanced annual · 1 constructions · 136 names held · selection: hold · 0.0% in cash · turnover 1.0× · cost drag 0.1% · 2 names dropped at load (138 selected, 136 held across the window), weights renormalised onto the rest
Projection accuracy, realized outcome fell inside the P5–P95 cone in 100.0% of 1 scored rebalances (a well-calibrated 90% band contains ~90.0%) · 95% VaR breached on 0.8% of 249 days (expected ~5.0%)
| Rebalance | P5 | Median | P95 | Realized | In band | VaR 95 (1d) | Breaches |
|---|---|---|---|---|---|---|---|
| 2012-01-01 → window end | -29.7604% | 5.1453% | 54.4666% | 18.2545% | yes | 2.6837% | 2 / 249 |
Earnings yield
Portfolio book, rebalanced annual · 1 constructions · 137 names held · selection: hold · 0.0% in cash · turnover 1.0× · cost drag 0.1% · 1 name dropped at load (138 selected, 137 held across the window), weights renormalised onto the rest
Projection accuracy, realized outcome fell inside the P5–P95 cone in 100.0% of 1 scored rebalances (a well-calibrated 90% band contains ~90.0%) · 95% VaR breached on 1.2% of 249 days (expected ~5.0%)
| Rebalance | P5 | Median | P95 | Realized | In band | VaR 95 (1d) | Breaches |
|---|---|---|---|---|---|---|---|
| 2012-01-01 → window end | -25.352% | 8.3937% | 54.6829% | 9.6782% | yes | 2.3902% | 3 / 249 |
Step 8 · 2013-01-02 → 2013-12-31
Book-to-market
Portfolio book, rebalanced annual · 2 constructions · 141 names held · selection: hold · 0.0% in cash · turnover 1.0× · cost drag 0.1% · 1 name dropped at load (142 selected, 141 held across the window), weights renormalised onto the rest
Projection accuracy, realized outcome fell inside the P5–P95 cone in 100.0% of 1 scored rebalances (a well-calibrated 90% band contains ~90.0%) · 95% VaR breached on 1.2% of 251 days (expected ~5.0%)
| Rebalance | P5 | Median | P95 | Realized | In band | VaR 95 (1d) | Breaches |
|---|---|---|---|---|---|---|---|
| 2013-01-01 → 2014-01-01 | -27.1702% | 6.1516% | 55.607% | 29.737% | yes | 2.1922% | 3 / 251 |
| 2014-01-01 | no segment follows this rebalance, not scored | ||||||
Earnings yield
Portfolio book, rebalanced annual · 2 constructions · 141 names held · selection: hold · 0.0% in cash · turnover 1.0× · cost drag 0.1% · 1 name dropped at load (142 selected, 141 held across the window), weights renormalised onto the rest
Projection accuracy, realized outcome fell inside the P5–P95 cone in 100.0% of 1 scored rebalances (a well-calibrated 90% band contains ~90.0%) · 95% VaR breached on 1.2% of 251 days (expected ~5.0%)
| Rebalance | P5 | Median | P95 | Realized | In band | VaR 95 (1d) | Breaches |
|---|---|---|---|---|---|---|---|
| 2013-01-01 → 2014-01-01 | -21.2214% | 9.9363% | 54.1958% | 27.8141% | yes | 1.9407% | 3 / 251 |
| 2014-01-01 | no segment follows this rebalance, not scored | ||||||
Step 9 · 2014-01-02 → 2014-12-31
Book-to-market
Portfolio book, rebalanced annual · 2 constructions · 144 names held · selection: hold · 0.0% in cash · turnover 1.0× · cost drag 0.1% · 1 name dropped at load (145 selected, 144 held across the window), weights renormalised onto the rest
Projection accuracy, realized outcome fell inside the P5–P95 cone in 100.0% of 1 scored rebalances (a well-calibrated 90% band contains ~90.0%) · 95% VaR breached on 3.59% of 251 days (expected ~5.0%)
| Rebalance | P5 | Median | P95 | Realized | In band | VaR 95 (1d) | Breaches |
|---|---|---|---|---|---|---|---|
| 2014-01-01 → 2015-01-01 | -1.9465% | 23.9976% | 57.3664% | 9.7572% | yes | 1.4285% | 9 / 251 |
| 2015-01-01 | no segment follows this rebalance, not scored | ||||||
Earnings yield
Portfolio book, rebalanced annual · 2 constructions · 143 names held · selection: hold · 0.0% in cash · turnover 1.0× · cost drag 0.1% · 1 name dropped at load (144 selected, 143 held across the window), weights renormalised onto the rest
Projection accuracy, realized outcome fell inside the P5–P95 cone in 100.0% of 1 scored rebalances (a well-calibrated 90% band contains ~90.0%) · 95% VaR breached on 3.98% of 251 days (expected ~5.0%)
| Rebalance | P5 | Median | P95 | Realized | In band | VaR 95 (1d) | Breaches |
|---|---|---|---|---|---|---|---|
| 2014-01-01 → 2015-01-01 | -1.1297% | 23.1795% | 53.9791% | 11.3688% | yes | 1.3677% | 10 / 251 |
| 2015-01-01 | no segment follows this rebalance, not scored | ||||||
Step 10 · 2015-01-02 → 2015-12-31
Book-to-market
Portfolio book, rebalanced annual · 2 constructions · 144 names held · selection: hold · 0.0% in cash · turnover 1.0× · cost drag 0.1% · 2 names dropped at load (146 selected, 144 held across the window), weights renormalised onto the rest
Projection accuracy, realized outcome fell inside the P5–P95 cone in 0.0% of 1 scored rebalances (a well-calibrated 90% band contains ~90.0%) · 95% VaR breached on 8.37% of 251 days (expected ~5.0%)
| Rebalance | P5 | Median | P95 | Realized | In band | VaR 95 (1d) | Breaches |
|---|---|---|---|---|---|---|---|
| 2015-01-01 → 2016-01-01 | -2.217% | 19.8653% | 47.3896% | -5.7043% | no | 1.2735% | 21 / 251 |
| 2016-01-01 | no segment follows this rebalance, not scored | ||||||
Earnings yield
Portfolio book, rebalanced annual · 2 constructions · 144 names held · selection: hold · 0.0% in cash · turnover 1.0× · cost drag 0.1% · 1 name dropped at load (145 selected, 144 held across the window), weights renormalised onto the rest
Projection accuracy, realized outcome fell inside the P5–P95 cone in 0.0% of 1 scored rebalances (a well-calibrated 90% band contains ~90.0%) · 95% VaR breached on 8.76% of 251 days (expected ~5.0%)
| Rebalance | P5 | Median | P95 | Realized | In band | VaR 95 (1d) | Breaches |
|---|---|---|---|---|---|---|---|
| 2015-01-01 → 2016-01-01 | -2.0546% | 20.0936% | 47.7069% | -6.6543% | no | 1.3149% | 22 / 251 |
| 2016-01-01 | no segment follows this rebalance, not scored | ||||||
Step 11 · 2016-01-04 → 2016-12-30
Book-to-market
Portfolio book, rebalanced annual · 1 constructions · 152 names held · selection: hold · 0.0% in cash · turnover 1.0× · cost drag 0.1% · 1 name dropped at load (153 selected, 152 held across the window), weights renormalised onto the rest
Projection accuracy, realized outcome fell inside the P5–P95 cone in 100.0% of 1 scored rebalances (a well-calibrated 90% band contains ~90.0%) · 95% VaR breached on 6.37% of 251 days (expected ~5.0%)
| Rebalance | P5 | Median | P95 | Realized | In band | VaR 95 (1d) | Breaches |
|---|---|---|---|---|---|---|---|
| 2016-01-01 → window end | -16.0058% | 6.6995% | 36.0361% | 18.218% | yes | 1.5876% | 16 / 251 |
Earnings yield
Portfolio book, rebalanced annual · 1 constructions · 152 names held · selection: hold · 0.0% in cash · turnover 1.0× · cost drag 0.1% · 1 name dropped at load (153 selected, 152 held across the window), weights renormalised onto the rest
Projection accuracy, realized outcome fell inside the P5–P95 cone in 100.0% of 1 scored rebalances (a well-calibrated 90% band contains ~90.0%) · 95% VaR breached on 4.38% of 251 days (expected ~5.0%)
| Rebalance | P5 | Median | P95 | Realized | In band | VaR 95 (1d) | Breaches |
|---|---|---|---|---|---|---|---|
| 2016-01-01 → window end | -12.207% | 11.1013% | 41.1015% | 14.6348% | yes | 1.5368% | 11 / 251 |
Step 12 · 2017-01-03 → 2017-12-29
Book-to-market
Portfolio book, rebalanced annual · 2 constructions · 156 names held · selection: hold · 0.0% in cash · turnover 1.0× · cost drag 0.1% · 2 names dropped at load (158 selected, 156 held across the window), weights renormalised onto the rest
Projection accuracy, realized outcome fell inside the P5–P95 cone in 100.0% of 1 scored rebalances (a well-calibrated 90% band contains ~90.0%) · 95% VaR breached on 0.4% of 250 days (expected ~5.0%)
| Rebalance | P5 | Median | P95 | Realized | In band | VaR 95 (1d) | Breaches |
|---|---|---|---|---|---|---|---|
| 2017-01-01 → 2018-01-01 | -18.64% | 7.3408% | 42.3216% | 11.553% | yes | 1.8754% | 1 / 250 |
| 2018-01-01 | no segment follows this rebalance, not scored | ||||||
Earnings yield
Portfolio book, rebalanced annual · 2 constructions · 157 names held · selection: hold · 0.0% in cash · turnover 1.0× · cost drag 0.1% · 1 name dropped at load (158 selected, 157 held across the window), weights renormalised onto the rest
Projection accuracy, realized outcome fell inside the P5–P95 cone in 100.0% of 1 scored rebalances (a well-calibrated 90% band contains ~90.0%) · 95% VaR breached on 0.8% of 250 days (expected ~5.0%)
| Rebalance | P5 | Median | P95 | Realized | In band | VaR 95 (1d) | Breaches |
|---|---|---|---|---|---|---|---|
| 2017-01-01 → 2018-01-01 | -17.1659% | 7.6929% | 40.6705% | 17.5492% | yes | 1.6812% | 2 / 250 |
| 2018-01-01 | no segment follows this rebalance, not scored | ||||||
Step 13 · 2018-01-02 → 2018-12-31
Book-to-market
Portfolio book, rebalanced annual · 2 constructions · 160 names held · selection: hold · 0.0% in cash · turnover 1.0× · cost drag 0.1%
Projection accuracy, realized outcome fell inside the P5–P95 cone in 0.0% of 1 scored rebalances (a well-calibrated 90% band contains ~90.0%) · 95% VaR breached on 8.0% of 250 days (expected ~5.0%)
| Rebalance | P5 | Median | P95 | Realized | In band | VaR 95 (1d) | Breaches |
|---|---|---|---|---|---|---|---|
| 2018-01-01 → 2019-01-01 | -8.9588% | 12.7917% | 40.275% | -15.5852% | no | 1.3999% | 20 / 250 |
| 2019-01-01 | no segment follows this rebalance, not scored | ||||||
Earnings yield
Portfolio book, rebalanced annual · 2 constructions · 160 names held · selection: hold · 0.0% in cash · turnover 1.0× · cost drag 0.1%
Projection accuracy, realized outcome fell inside the P5–P95 cone in 0.0% of 1 scored rebalances (a well-calibrated 90% band contains ~90.0%) · 95% VaR breached on 7.6% of 250 days (expected ~5.0%)
| Rebalance | P5 | Median | P95 | Realized | In band | VaR 95 (1d) | Breaches |
|---|---|---|---|---|---|---|---|
| 2018-01-01 → 2019-01-01 | -8.4584% | 13.469% | 41.19% | -12.1769% | no | 1.4317% | 19 / 250 |
| 2019-01-01 | no segment follows this rebalance, not scored | ||||||
Step 14 · 2019-01-02 → 2019-12-31
Book-to-market
Portfolio book, rebalanced annual · 2 constructions · 163 names held · selection: hold · 0.0% in cash · turnover 1.0× · cost drag 0.1%
Projection accuracy, realized outcome fell inside the P5–P95 cone in 100.0% of 1 scored rebalances (a well-calibrated 90% band contains ~90.0%) · 95% VaR breached on 4.78% of 251 days (expected ~5.0%)
| Rebalance | P5 | Median | P95 | Realized | In band | VaR 95 (1d) | Breaches |
|---|---|---|---|---|---|---|---|
| 2019-01-01 → 2020-01-01 | -12.514% | 7.499% | 32.504% | 23.0456% | yes | 1.296% | 12 / 251 |
| 2020-01-01 | no segment follows this rebalance, not scored | ||||||
Earnings yield
Portfolio book, rebalanced annual · 2 constructions · 163 names held · selection: hold · 0.0% in cash · turnover 1.0× · cost drag 0.1%
Projection accuracy, realized outcome fell inside the P5–P95 cone in 100.0% of 1 scored rebalances (a well-calibrated 90% band contains ~90.0%) · 95% VaR breached on 6.37% of 251 days (expected ~5.0%)
| Rebalance | P5 | Median | P95 | Realized | In band | VaR 95 (1d) | Breaches |
|---|---|---|---|---|---|---|---|
| 2019-01-01 → 2020-01-01 | -12.6576% | 7.9765% | 33.916% | 22.4437% | yes | 1.2793% | 16 / 251 |
| 2020-01-01 | no segment follows this rebalance, not scored | ||||||
Step 15 · 2020-01-02 → 2020-12-31
Book-to-market
Portfolio book, rebalanced annual · 1 constructions · 166 names held · selection: hold · 0.0% in cash · turnover 1.0× · cost drag 0.1%
Projection accuracy, realized outcome fell inside the P5–P95 cone in 100.0% of 1 scored rebalances (a well-calibrated 90% band contains ~90.0%) · 95% VaR breached on 19.84% of 252 days (expected ~5.0%)
| Rebalance | P5 | Median | P95 | Realized | In band | VaR 95 (1d) | Breaches |
|---|---|---|---|---|---|---|---|
| 2020-01-01 → window end | -16.2911% | 7.1074% | 35.23% | -5.1308% | yes | 1.6348% | 50 / 252 |
Earnings yield
Portfolio book, rebalanced annual · 1 constructions · 166 names held · selection: hold · 0.0% in cash · turnover 1.0× · cost drag 0.1%
Projection accuracy, realized outcome fell inside the P5–P95 cone in 100.0% of 1 scored rebalances (a well-calibrated 90% band contains ~90.0%) · 95% VaR breached on 17.06% of 252 days (expected ~5.0%)
| Rebalance | P5 | Median | P95 | Realized | In band | VaR 95 (1d) | Breaches |
|---|---|---|---|---|---|---|---|
| 2020-01-01 → window end | -15.1859% | 8.4099% | 36.7413% | 0.3003% | yes | 1.5485% | 43 / 252 |
Step 16 · 2021-01-04 → 2021-12-31
Book-to-market
Portfolio book, rebalanced annual · 2 constructions · 165 names held · selection: hold · 0.0% in cash · turnover 1.0× · cost drag 0.1% · 1 name dropped at load (166 selected, 165 held across the window), weights renormalised onto the rest
Projection accuracy, realized outcome fell inside the P5–P95 cone in 100.0% of 1 scored rebalances (a well-calibrated 90% band contains ~90.0%) · 95% VaR breached on 0.4% of 251 days (expected ~5.0%)
| Rebalance | P5 | Median | P95 | Realized | In band | VaR 95 (1d) | Breaches |
|---|---|---|---|---|---|---|---|
| 2021-01-01 → 2022-01-01 | -41.0671% | 3.3194% | 82.6879% | 33.1302% | yes | 2.9779% | 1 / 251 |
| 2022-01-01 | no segment follows this rebalance, not scored | ||||||
Earnings yield
Portfolio book, rebalanced annual · 2 constructions · 166 names held · selection: hold · 0.0% in cash · turnover 1.0× · cost drag 0.1%
Projection accuracy, realized outcome fell inside the P5–P95 cone in 100.0% of 1 scored rebalances (a well-calibrated 90% band contains ~90.0%) · 95% VaR breached on 0.4% of 251 days (expected ~5.0%)
| Rebalance | P5 | Median | P95 | Realized | In band | VaR 95 (1d) | Breaches |
|---|---|---|---|---|---|---|---|
| 2021-01-01 → 2022-01-01 | -30.5422% | 12.156% | 82.4253% | 27.4791% | yes | 2.6049% | 1 / 251 |
| 2022-01-01 | no segment follows this rebalance, not scored | ||||||
Step 17 · 2022-01-03 → 2022-12-30
Book-to-market
Portfolio book, rebalanced annual · 2 constructions · 165 names held · selection: hold · 0.0% in cash · turnover 1.0× · cost drag 0.1% · 1 name dropped at load (166 selected, 165 held across the window), weights renormalised onto the rest
Projection accuracy, realized outcome fell inside the P5–P95 cone in 0.0% of 1 scored rebalances (a well-calibrated 90% band contains ~90.0%) · 95% VaR breached on 4.8% of 250 days (expected ~5.0%)
| Rebalance | P5 | Median | P95 | Realized | In band | VaR 95 (1d) | Breaches |
|---|---|---|---|---|---|---|---|
| 2022-01-01 → 2023-01-01 | -2.0789% | 50.1931% | 132.1377% | -4.8621% | no | 2.3936% | 12 / 250 |
| 2023-01-01 | no segment follows this rebalance, not scored | ||||||
Earnings yield
Portfolio book, rebalanced annual · 2 constructions · 165 names held · selection: hold · 0.0% in cash · turnover 1.0× · cost drag 0.1% · 1 name dropped at load (166 selected, 165 held across the window), weights renormalised onto the rest
Projection accuracy, realized outcome fell inside the P5–P95 cone in 100.0% of 1 scored rebalances (a well-calibrated 90% band contains ~90.0%) · 95% VaR breached on 4.4% of 250 days (expected ~5.0%)
| Rebalance | P5 | Median | P95 | Realized | In band | VaR 95 (1d) | Breaches |
|---|---|---|---|---|---|---|---|
| 2022-01-01 → 2023-01-01 | -26.1278% | 18.6341% | 92.1397% | -5.2019% | yes | 2.3953% | 11 / 250 |
| 2023-01-01 | no segment follows this rebalance, not scored | ||||||
Step 18 · 2023-01-03 → 2023-12-29
Book-to-market
Portfolio book, rebalanced annual · 2 constructions · 164 names held · selection: hold · 0.0% in cash · turnover 1.0× · cost drag 0.1% · 2 names dropped at load (166 selected, 164 held across the window), weights renormalised onto the rest
Projection accuracy, realized outcome fell inside the P5–P95 cone in 100.0% of 1 scored rebalances (a well-calibrated 90% band contains ~90.0%) · 95% VaR breached on 2.81% of 249 days (expected ~5.0%)
| Rebalance | P5 | Median | P95 | Realized | In band | VaR 95 (1d) | Breaches |
|---|---|---|---|---|---|---|---|
| 2023-01-01 → 2024-01-01 | -12.5018% | 18.8772% | 59.2194% | 9.7868% | yes | 1.8263% | 7 / 249 |
| 2024-01-01 | no segment follows this rebalance, not scored | ||||||
Earnings yield
Portfolio book, rebalanced annual · 2 constructions · 163 names held · selection: hold · 0.0% in cash · turnover 1.0× · cost drag 0.1% · 3 names dropped at load (166 selected, 163 held across the window), weights renormalised onto the rest
Projection accuracy, realized outcome fell inside the P5–P95 cone in 100.0% of 1 scored rebalances (a well-calibrated 90% band contains ~90.0%) · 95% VaR breached on 3.21% of 249 days (expected ~5.0%)
| Rebalance | P5 | Median | P95 | Realized | In band | VaR 95 (1d) | Breaches |
|---|---|---|---|---|---|---|---|
| 2023-01-01 → 2024-01-01 | -8.109% | 28.3799% | 76.5852% | 7.7832% | yes | 1.8862% | 8 / 249 |
| 2024-01-01 | no segment follows this rebalance, not scored | ||||||
Step 19 · 2024-01-02 → 2024-12-31
Book-to-market
Portfolio book, rebalanced annual · 1 constructions · 166 names held · selection: hold · 0.0% in cash · turnover 1.0× · cost drag 0.1%
Projection accuracy, realized outcome fell inside the P5–P95 cone in 100.0% of 1 scored rebalances (a well-calibrated 90% band contains ~90.0%) · 95% VaR breached on 1.2% of 251 days (expected ~5.0%)
| Rebalance | P5 | Median | P95 | Realized | In band | VaR 95 (1d) | Breaches |
|---|---|---|---|---|---|---|---|
| 2024-01-01 → window end | -23.3563% | 2.3167% | 37.1898% | 12.9351% | yes | 1.8829% | 3 / 251 |
Earnings yield
Portfolio book, rebalanced annual · 1 constructions · 166 names held · selection: hold · 0.0% in cash · turnover 1.0× · cost drag 0.1%
Projection accuracy, realized outcome fell inside the P5–P95 cone in 100.0% of 1 scored rebalances (a well-calibrated 90% band contains ~90.0%) · 95% VaR breached on 1.2% of 251 days (expected ~5.0%)
| Rebalance | P5 | Median | P95 | Realized | In band | VaR 95 (1d) | Breaches |
|---|---|---|---|---|---|---|---|
| 2024-01-01 → window end | -22.5559% | 4.4156% | 41.4211% | 13.0952% | yes | 1.8162% | 3 / 251 |
Step 20 · 2025-01-02 → 2025-12-31
Book-to-market
Portfolio book, rebalanced annual · 2 constructions · 166 names held · selection: hold · 0.0% in cash · turnover 1.0× · cost drag 0.1%
Projection accuracy, realized outcome fell inside the P5–P95 cone in 100.0% of 1 scored rebalances (a well-calibrated 90% band contains ~90.0%) · 95% VaR breached on 5.22% of 249 days (expected ~5.0%)
| Rebalance | P5 | Median | P95 | Realized | In band | VaR 95 (1d) | Breaches |
|---|---|---|---|---|---|---|---|
| 2025-01-01 → 2026-01-01 | -8.3521% | 14.1764% | 40.7936% | 17.3058% | yes | 1.3808% | 13 / 249 |
| 2026-01-01 | no segment follows this rebalance, not scored | ||||||
Earnings yield
Portfolio book, rebalanced annual · 2 constructions · 166 names held · selection: hold · 0.0% in cash · turnover 1.0× · cost drag 0.1%
Projection accuracy, realized outcome fell inside the P5–P95 cone in 100.0% of 1 scored rebalances (a well-calibrated 90% band contains ~90.0%) · 95% VaR breached on 4.82% of 249 days (expected ~5.0%)
| Rebalance | P5 | Median | P95 | Realized | In band | VaR 95 (1d) | Breaches |
|---|---|---|---|---|---|---|---|
| 2025-01-01 → 2026-01-01 | -1.1506% | 27.1745% | 61.7065% | 32.6199% | yes | 1.4964% | 12 / 249 |
| 2026-01-01 | no segment follows this rebalance, not scored | ||||||