
The overnight gain is real, no trade keeps it, and the rule that chases it buys wrecks
The overnight gain is real. Since 1993 nearly everything the S&P 500 paid came between the close and the next morning's open, and a dollar held in SPY only overnight ended more than ten times above a dollar held only through the trading day. Every year someone puts this back into circulation as a discovery, with a table of small stocks whose night returns run to thousands of times and a rule for picking them. I wanted three answers: whether the night's gain is real, whether anyone can collect it, and what that table is made of.
Nobody collects it. Holding only the night earns less than holding the stock through the day as well, before any trading cost at all, so the trade starts behind whoever just held the stock and did nothing. Then it pays five hundred trades a year against a night's gain of a few hundredths of a percent, and at the cost these claims usually assume it lost money in 25 of the 26 years.
The table that doubles every year is made of prices nobody can trade at. Across 1,046 US stocks under three hundred million dollars, the median one turned a dollar into 3.75 at night since 2020, gave it back by day, and ended at a quarter of where it started. The day's last trade prints at the bid and the next morning's first at the ask, which shows in the bars as a gain every night and a loss the same size every day.
The rule that buys the strongest recent night movers does beat holding the same names over twenty-six years, at what a per-share broker charges. Take out July 2008 and most of the lead goes with it. The crash made a penny stock of Freddie Mac and the rule put almost the whole book into it. At the cost these claims assume, the rule ends the last ten years below where it started while holding the same names tripled.
The market has already run this trade. Two exchange-traded funds held index futures, the cheapest instrument there is, from each close to the next open and sat in cash by day. They tracked the night as designed, and both closed fourteen months after opening, each behind the index it was built on.
The night's gain belongs to whoever already holds the stock through it. They get the night for free and the day on top, and they pay for neither.
Why this study, and what was done
Buy at the close, sell at the open, sleep through the money. It has been in the journals since 2008 and in the newspapers since 2018. Two funds sold it to the public in 2022 and closed in 2023, and it keeps coming round with a table of small stocks whose overnight gains run to thousands of times, and a rule for picking them. Figure 1 is the whole mechanic: one night of the trade, and the two trades that pay for it.
What I did. Three censuses, with no registration: SPY split into its night and its day since 1993; every member of the S&P 500 split the same way since 2000, 10,921 name-years; and 1,046 US stocks under 300 million dollars split the same way since 2020. Then eight tests on the S&P 500, each 26 years long, July 2000 to July 2025, each year registered on the platform before it ran: every member of the index bought at every close and sold at every open, and the rule that picks the strongest recent night movers, at five trading costs from none to the estimated bid-ask spread, against holding the same names. The rule: every week, take each name's overnight gain over the last ninety sessions, keep the names that gained, weight them by the fourth power of that gain, and hold that book every night. It averages 15 names, the largest of them 36 percent of the book.
How to read the numbers. A year here is July to July. A trade is one buy or one sell. The costs are assumptions. Each is paid on every buy and every sell: nothing; 0.01 percent a trade; 0.05 percent a trade, the figure the claims usually assume; half a cent a share, what a per-share broker charges, which is a quarter of a percent on a two-dollar stock and the 0.01 percent floor on anything above fifty dollars; and the bid-ask spread estimated from each day's high and low, which overstates for liquid names and is the dearest of the five. Where a dollar's growth is quoted it is the 26 years chained, each year from its own registered run.
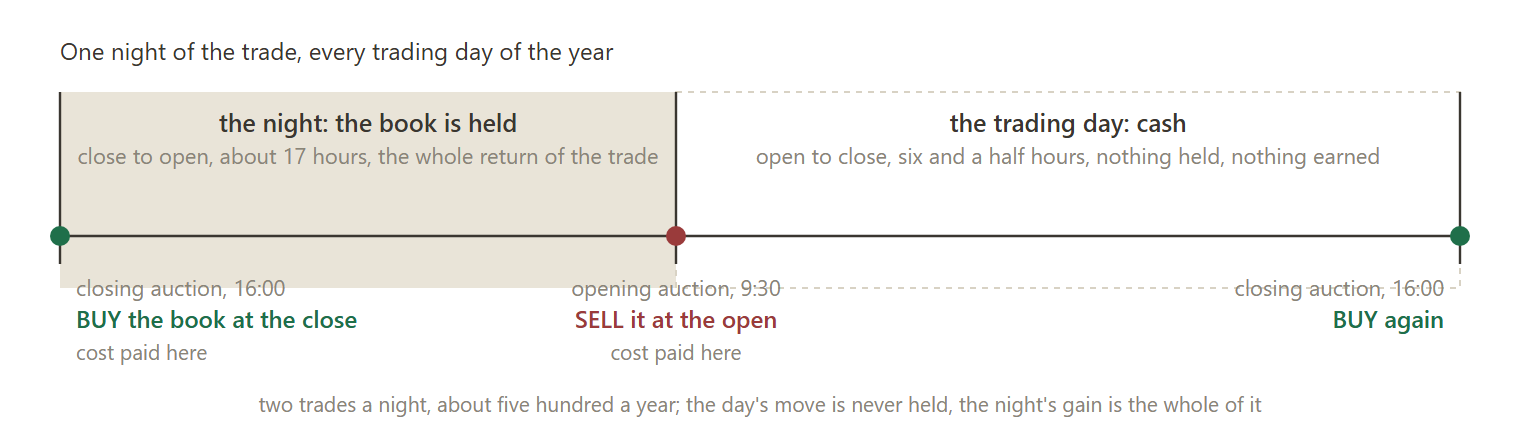
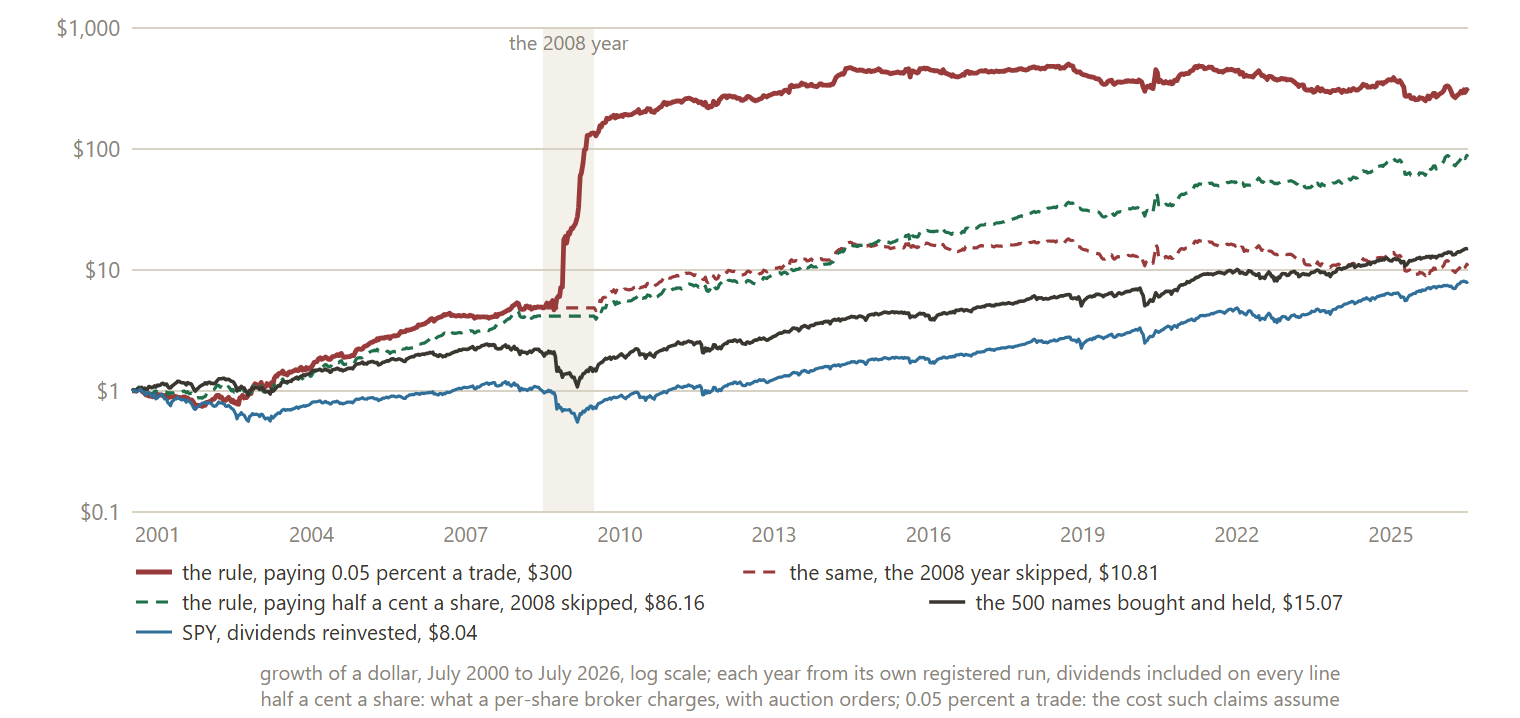
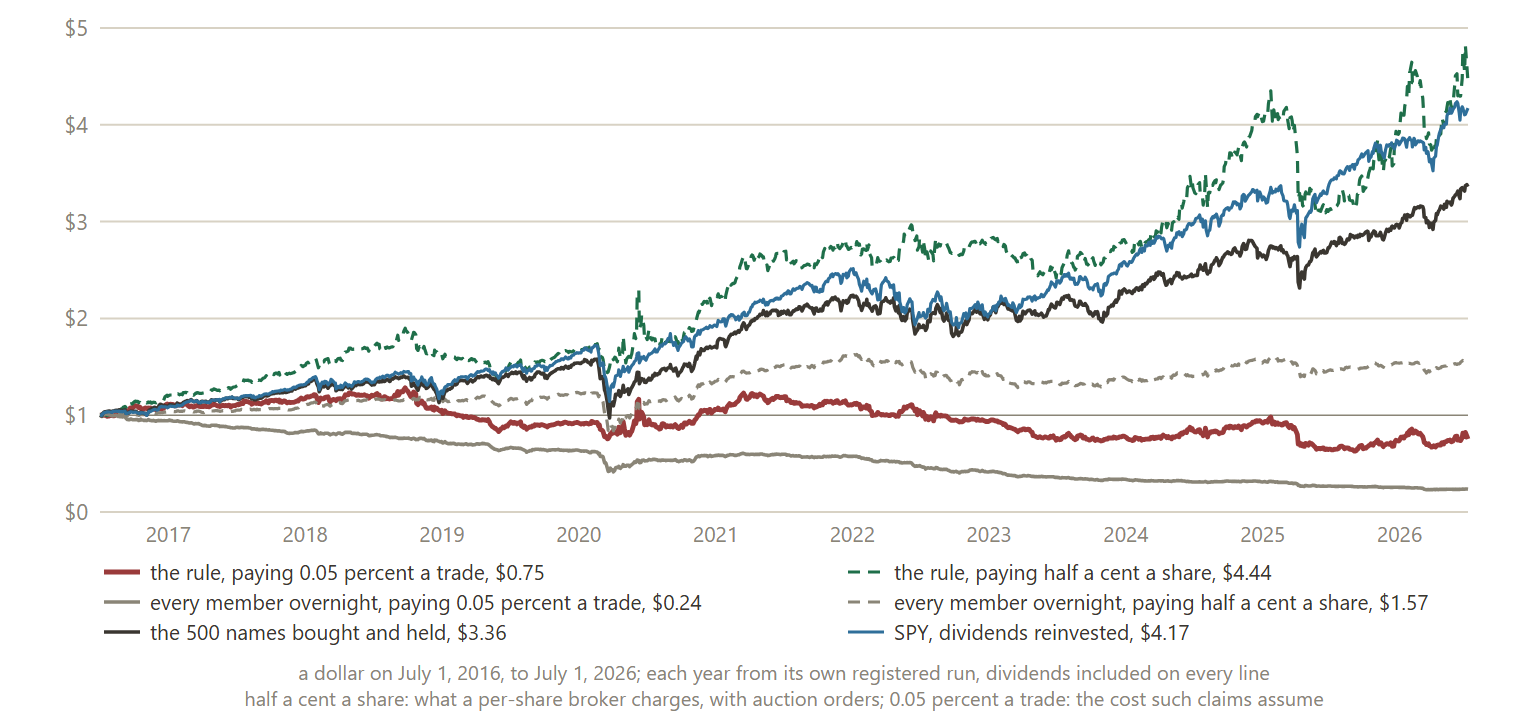
Table 1. What a dollar became, July 2000 to July 2026: the rule and every member, bought at every close and sold at every open
| cost on every buy and every sell | rule, mean % a year | rule, median % a year | rule, years up of 26 | rule, $1 became | rule, $1 became without 2008 | every member, mean % a year | every member, years up | every member, $1 became | rule beat holding, years of 26 | rule, cost a night, % | every member, cost a night, % |
|---|---|---|---|---|---|---|---|---|---|---|---|
| no trading cost | 176.5 | 42.5 | 24 | 200,586 | 5,625 | 7.7 | 20 | 5.99 | 22 | 0.00 | 0.00 |
| 0.01 percent a trade | 163.1 | 35.5 | 23 | 54,660 | 1,611 | 2.4 | 15 | 1.62 | 22 | 0.02 | 0.02 |
| 0.05 percent a trade, usual figure | 115.4 | 11.0 | 16 | 301 | 10.81 | -16.2 | 1 | 0.00 | 10 | 0.10 | 0.10 |
| half a cent a share a trade | 37.7 | 24.4 | 21 | 480 | 86.15 | -0.6 | 15 | 0.74 | 17 | 0.09 | 0.03 |
| the estimated bid-ask spread a trade | -47.5 | -46.5 | 0 | 0.00 | 0.00 | -50.0 | 0 | 0.00 | 0 | 0.46 | 0.32 |
| every member bought and held | 12.1 | 13.3 | 20 | 14.88 | 0.05 once each way | ||||||
| SPY held only overnight, no cost | 7.2 | 8.7 | 20 | 5.40 | 0 |
1 Methodology
The universe is the S&P 500 as it stood on each first of July from 2000 to 2025, reconstructed from the vendor's change log, held fixed for the year that follows; a name that leaves the index in the year stays in the book until its series ends. The bars are one frozen table of 1,013 split-adjusted daily series, pulled once and never refreshed; SPY's dates are the calendar. On average 38 member-years a July have no series at the vendor and are counted as such. A dividend is paid on the night when the ex-date is the next session, from the payment record, never from an adjusted close.
The rule as walked: at the anchor and every seven sessions after it, each name's overnight growth over the last ninety sessions, R, is the product of open over prior close; names with R above one score (ln R) to the fourth power, weights are the scores' shares, weights under one percent are dropped and the rest renormalised. Only a name that printed at that close can be bought at it, and the ninety sessions are the calendar's, so a series that ended is not scored on its last bars. Held overnight means every name of the book is bought at the close and sold at the next open, every night, flat during the day, the cost paid on both trades. Every member means the same, equal weight across every name with a print at that close. Bought and held means equal weight at the anchor close to the end of the year, dividends reinvested, 0.05 percent once at entry and once at exit. The rule holds 15.3 names a night on average against 410 for every member.
Five costs, one test each. Nothing; 0.01 percent a trade; 0.05 percent a trade; half a cent a share, where a trade pays the larger of 0.01 percent and half a cent at the price that printed, recovered through the split record, so a two-dollar stock pays a quarter of a percent a trade; and the spread, where a trade pays the larger of those and half the Corwin and Schultz (2012) estimate from two consecutive days' highs and lows, the median of the last 21 sessions' estimates. The last overstates for a liquid name: the same estimator gives SPY, whose quoted spread is a cent, 10 to 28 hundredths of a percent in the years to 2010 and a median of zero in most years since 2011. The closing and opening auctions fill at one price, so a small order pays none of these, only the auction's own move; the five costs bracket what a real fill would cost. The registration record in section 3 prints the half-cent setting by its floor, 1.0 basis point a leg; the half cent applied throughout.
The engine's reliability gate runs on every series over the ninety sessions before the anchor and the year: refused when any close-to-close move is up more than 80 percent, when three or more days move more than 60 percent, when a close is under a cent, when one log move is at least 1.0 and eight times the next largest, when the series has a hole inside its own span, when an overnight move is over 100 percent, or when an overnight move over 50 percent reverses more than 30 percent by the same close. Symbols the vendor has since handed to another company are refused by name from the engine's taxonomy, with the evidence beside each: EP, WM and BBBY from earlier studies, and from replaying these walks KMG (the vendor's series is KMG Chemicals, the seat was Kerr-McGee's), SII (Sprott's series, Smith International's seat), GENZ (an ETF's series, Genzyme's seat), RMG (a seat the log gives to Cablevision, which traded as CVC) and ETFC, whose split record the vendor left empty so its pre-2010 prints cannot be priced at the half cent. On average 3.5 names a year are refused. Fewer than ten names would exclude a year; none was.
Eight walks were registered before any ran, each 26 years, each year a prospectus, a run and a frozen report: the rule against every member at each of the five costs, every member overnight against holding, and the rule at half a cent and at the spread against holding. The record keeps every pick's five largest names and weights and the nightly equity of both arms, so Tables 2 to 4 are read from the reports; the same rule replayed offline from the same bars matched every year's book size and its gross return within the dividends. The benchmark of an overnight arm is SPY's own night; the family figure chains the years, each from its own run.
Beside the walks: the census of the night and the day for every member-year and for SPY (Table 5), the microcap census from the vendor's screener (Tables 6 and 7; the list is today's, so a name that died since 2020 is not in it), and the two NightShares funds over their life against their index's night on the same sessions (Table 5).
2 Results
2.1 Headline
This paper answers for a declared family of 8 sealed studies. 8 member walks are drawn as 16 lines (a comparative walk contributes one line per arm), each chained across its own out-of-sample windows, on one calendar axis, all rebased to 1× on the first session they share. 6 of them are shown to start, the ones the paper reads by; the others are switched off until their name is clicked. The paper’s own walk is the heavy line; the dashed grey line is the study’s own benchmark.
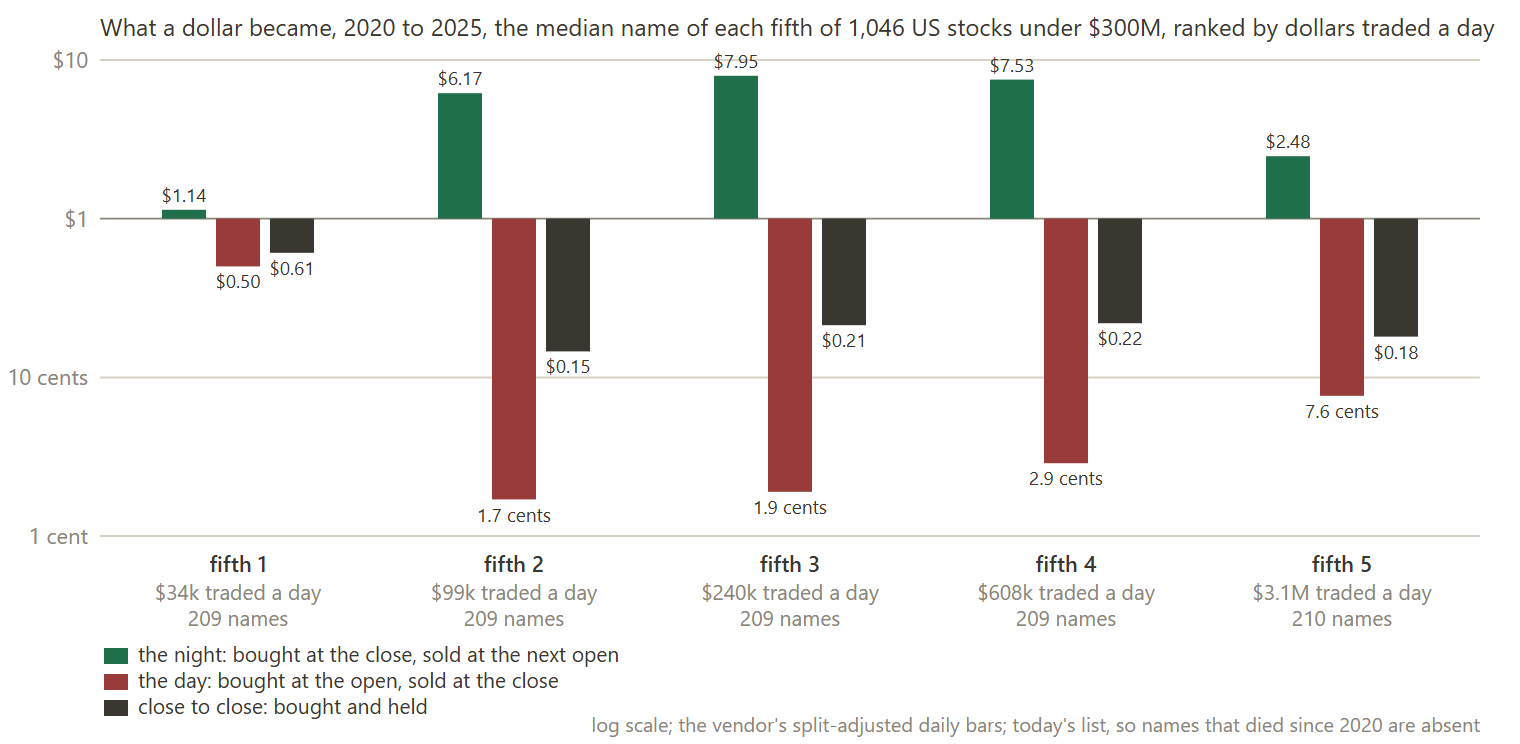
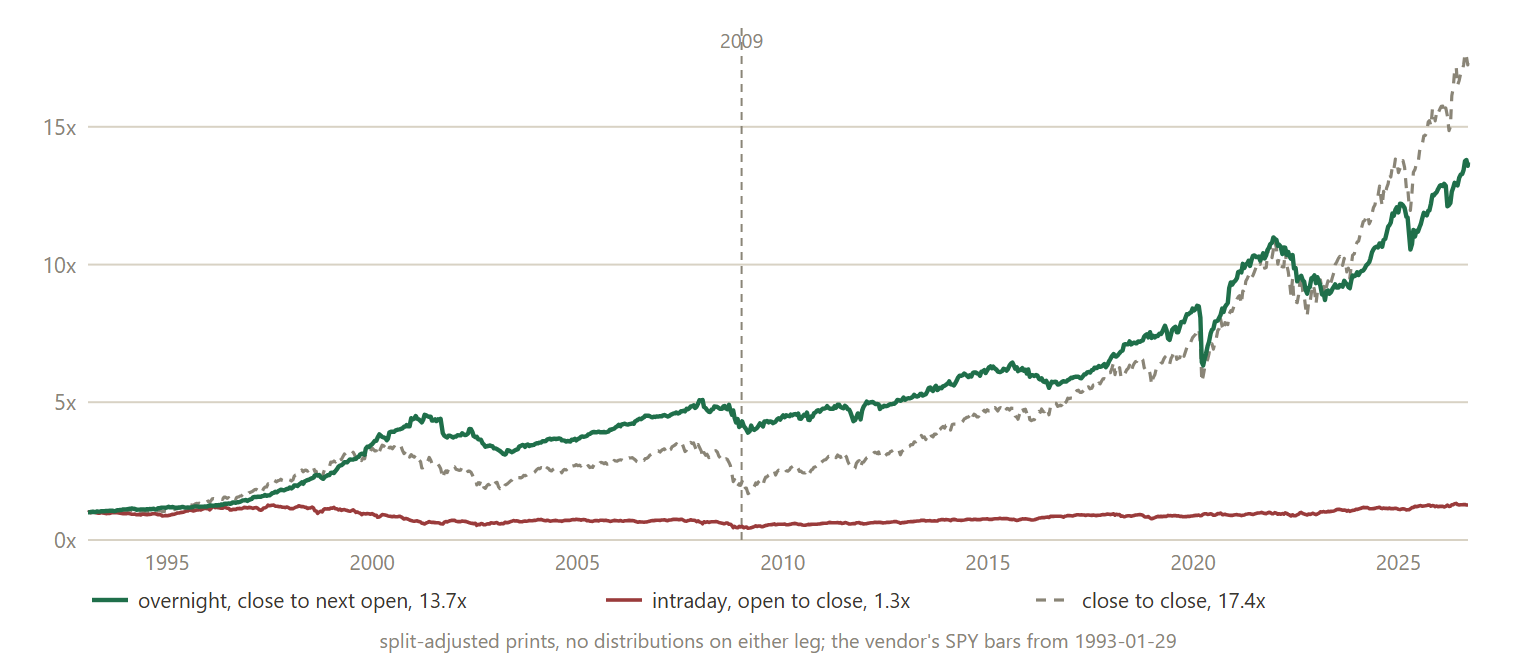
Table 2. What the rule held, 2000 to 2012: the name with the largest average weight over the year, and what the year paid
| year from July | names a night | the name it leaned on | its share of the book, % | its price then, $ | its trading a day, $M | nights held | median night, % | rule, %, half a cent a share | every member overnight, % | every member held, % | cost a night, % |
|---|---|---|---|---|---|---|---|---|---|---|---|
| 2000 | 15.8 | MU | 10 | 80.50 | 555 | 62 | 0.04 | -0.4 | -13.7 | 16.7 | 0.06 |
| 2001 | 12.0 | HAL | 20 | 16.76 | 94 | 140 | -0.02 | -2.1 | -17.5 | -1.4 | 0.06 |
| 2002 | 8.2 | VIAV | 23 | 2.68 | 69 | 161 | -0.05 | 21.9 | -9.3 | 2.9 | 0.24 |
| 2003 | 15.6 | AMCC | 13 | 23.36 | 35 | 140 | 0.16 | 47.1 | 8.4 | 30.1 | 0.09 |
| 2004 | 14.4 | CIEN | 18 | 2.22 | 22 | 211 | 0.07 | 21.4 | 2.9 | 14.0 | 0.16 |
| 2005 | 18.7 | VIAV | 26 | 2.55 | 105 | 251 | 0.15 | 33.9 | 4.5 | 13.2 | 0.13 |
| 2006 | 19.4 | F | 10 | 8.13 | 237 | 116 | 0.07 | 14.1 | 0.4 | 19.2 | 0.05 |
| 2007 | 13.6 | AAPL | 20 | 158.48 | 5936 | 146 | 0.13 | 27.9 | -9.4 | -14.5 | 0.07 |
| 2008 | 8.9 | FMCC | 31 | 0.74 | 8 | 169 | 0.34 | 457.0 | -17.7 | -25.7 | 0.75 |
| 2009 | 15.1 | C | 21 | 4.05 | 2324 | 161 | 0.27 | 41.4 | 1.1 | 23.5 | 0.12 |
| 2010 | 15.7 | ODP | 14 | 4.71 | 30 | 140 | 0.05 | 27.2 | 1.3 | 37.1 | 0.09 |
| 2011 | 14.0 | BAC | 21 | 6.45 | 1684 | 119 | -0.03 | 10.0 | -6.9 | -1.0 | 0.10 |
| 2012 | 10.4 | FSLR | 17 | 24.20 | 124 | 112 | 0.12 | 26.8 | 1.0 | 28.1 | 0.09 |
Table 3. What the rule held, 2013 to 2025: the name with the largest average weight over the year, and what the year paid
| year from July | names a night | the name it leaned on | its share of the book, % | its price then, $ | its trading a day, $M | nights held | median night, % | rule, %, half a cent a share | every member overnight, % | every member held, % | cost a night, % |
|---|---|---|---|---|---|---|---|---|---|---|---|
| 2013 | 15.9 | JCP | 29 | 8.70 | 173 | 162 | 0.08 | 54.5 | 7.0 | 26.5 | 0.06 |
| 2014 | 17.9 | MNST | 9 | 98.64 | 109 | 98 | 0.07 | 10.8 | -2.0 | 7.4 | 0.02 |
| 2015 | 9.3 | GMCR | 22 | 89.88 | 280 | 63 | -0.01 | 9.2 | -17.5 | 1.2 | 0.04 |
| 2016 | 18.5 | MU | 21 | 20.35 | 508 | 189 | 0.14 | 30.8 | 5.4 | 17.5 | 0.03 |
| 2017 | 17.7 | NVDA | 10 | 191.20 | 2609 | 153 | 0.16 | 30.4 | 9.4 | 12.1 | 0.02 |
| 2018 | 16.6 | AMD | 18 | 27.41 | 1995 | 145 | 0.03 | -8.8 | 1.8 | 8.5 | 0.04 |
| 2019 | 13.8 | GILD | 12 | 76.13 | 1357 | 70 | 0.06 | 14.4 | -5.0 | -5.1 | 0.03 |
| 2020 | 20.1 | AAL | 9 | 17.99 | 854 | 160 | 0.21 | 51.1 | 36.5 | 52.8 | 0.05 |
| 2021 | 20.1 | CTRA | 15 | 27.40 | 285 | 106 | 0.08 | 3.8 | -4.3 | -7.9 | 0.03 |
| 2022 | 13.2 | BIIB | 17 | 284.98 | 309 | 91 | -0.00 | -11.0 | -8.1 | 13.3 | 0.02 |
| 2023 | 17.1 | NVDA | 25 | 471.20 | 32921 | 165 | 0.15 | 34.8 | 4.7 | 12.2 | 0.02 |
| 2024 | 17.7 | AVGO | 12 | 185.15 | 4913 | 132 | 0.13 | -6.8 | 4.6 | 14.2 | 0.02 |
| 2025 | 17.1 | ORCL | 10 | 243.80 | 4998 | 91 | 0.18 | 42.2 | 7.3 | 20.9 | 0.02 |
Table 4. The year from July 2008: every night the rule made ten percent or more, and the book that made it
| night | rule, % | every member, % | names held | largest name, share %, its night % | second | third |
|---|---|---|---|---|---|---|
| 2008-10-01 | 10.2 | -0.9 | 3 | FMCC 93% +12% | MTG 4% -3% | DDS 3% -1% |
| 2008-10-07 | 10.7 | 1.3 | 3 | FMCC 93% +12% | MTG 4% +3% | DDS 3% +2% |
| 2008-10-13 | 27.0 | 5.9 | 4 | FMCC 96% +28% | MTG 2% +10% | CIT 2% +19% |
| 2008-10-28 | 12.5 | 3.3 | 4 | FMCC 70% +15% | F 24% +8% | CIT 4% +12% |
| 2008-10-30 | 11.4 | 3.4 | 4 | FMCC 70% +14% | F 22% +5% | MTG 4% +9% |
| 2008-11-21 | 13.1 | 2.9 | 4 | FMCC 82% +16% | F 14% +6% | MTG 3% +12% |
| 2008-11-25 | 36.1 | 2.2 | 4 | FMCC 82% +44% | F 14% +8% | MTG 3% -2% |
| 2008-11-26 | 17.2 | -2.0 | 4 | FMCC 82% +23% | F 14% +4% | MTG 3% -7% |
| 2008-11-28 | 20.7 | -0.3 | 4 | FMCC 82% +24% | F 14% +15% | MTG 3% -3% |
| 2009-03-19 | 24.6 | 1.6 | 8 | UIS 27% +11% | FMCC 21% +49% | F 21% +12% |
| 2009-03-23 | 16.8 | 3.3 | 8 | UIS 27% +12% | FMCC 21% +40% | F 21% +5% |
| 2009-04-16 | 10.0 | 1.0 | 10 | UIS 40% +18% | AIG 28% +8% | FMCC 12% +2% |
Table 5. The night and the day: the S&P 500 members and SPY by decade, % a year, and the two funds that held only the night
| line | span | nights | the night, % a year | the day, % a year | nights up, % | mean night, % | mean day, % | the fund against its index |
|---|---|---|---|---|---|---|---|---|
| S&P 500 members, equal weight | 2000 to 2009 | 2389 | 10.7 | 5.5 | 53.5 | 0.045 | 0.029 | |
| S&P 500 members, equal weight | 2010 to 2019 | 2516 | 5.3 | 6.2 | 54.9 | 0.022 | 0.027 | |
| S&P 500 members, equal weight | 2020 to 2026 | 1682 | 8.4 | 1.8 | 55.0 | 0.036 | 0.011 | |
| SPY | 2000 to 2009 | 2389 | 1.5 | -4.2 | ||||
| SPY | 2010 to 2019 | 2516 | 6.5 | 4.5 | ||||
| SPY | 2020 to 2026 | 1682 | 7.6 | 5.8 | ||||
| NSPY, the fund | 2022-06 to 2023-08 | 278 | -7.6 | 25.9 | NSPY -5.6, SPY close to close 18.2 | |||
| NIWM, the fund | 2022-06 to 2023-08 | 276 | -5.4 | 15.3 | NIWM -8.5, IWM close to close 10.9 |
Table 6. The microcaps, 1,046 US names under 300 million dollars, 2020 to 2025: a dollar at night, by day, and close to close
| fifth by trading a day | names | trading a day, $k | market cap, $M | daily range, % | the night, $1 became | the day, $1 became | close to close, $1 became | night over 10x, % | night over 10x and the stock down, % | night beat close to close, % | reverse splits a name |
|---|---|---|---|---|---|---|---|---|---|---|---|
| 1 (least traded) | 209 | 34 | 44 | 4.2 | 1.14 | 0.500 | 0.609 | 22 | 18 | 59 | 0.44 |
| 2 | 209 | 99 | 30 | 6.7 | 6.17 | 0.017 | 0.146 | 43 | 37 | 86 | 0.75 |
| 3 | 209 | 240 | 64 | 6.4 | 7.95 | 0.019 | 0.213 | 47 | 40 | 92 | 0.68 |
| 4 | 209 | 608 | 93 | 6.1 | 7.53 | 0.029 | 0.219 | 44 | 38 | 94 | 0.47 |
| 5 (most traded) | 210 | 3119 | 152 | 5.3 | 2.48 | 0.076 | 0.181 | 21 | 15 | 97 | 0.29 |
| all | 1046 | 3.75 | 0.060 | 0.240 | 35 | 30 | 86 |
Table 7. The fourteen largest night gains among the microcaps, 2020 to 2025, and what the stock did close to close
| name | company | market cap, $M | trading a day, $k | daily range, % | the night, $1 became | the day, $1 became | close to close, $1 became | reverse splits |
|---|---|---|---|---|---|---|---|---|
| SCWO | 374Water Inc. | 57 | 77 | 7.8 | 8,770,228 | 0.0000 | 2.267 | 1 |
| BRTX | BioRestorative Therapies, Inc. | 4 | 65 | 8.8 | 7,466,479 | 0.0000 | 0.059 | 1 |
| IQST | iQSTEL Inc. | 9 | 134 | 10.0 | 570,503 | 0.0000 | 0.948 | 1 |
| LODE | Comstock Inc. | 104 | 553 | 7.6 | 355,040 | 0.0000 | 0.872 | 1 |
| UAVS | AgEagle Aerial Systems, Inc. | 55 | 1092 | 8.0 | 298,539 | 0.0000 | 0.002 | 2 |
| GPUS | Hyperscale Data, Inc. | 18 | 1151 | 9.3 | 204,354 | 0.0000 | 0.000 | 3 |
| WKSP | Worksport Ltd. | 7 | 199 | 8.6 | 167,767 | 0.0000 | 0.161 | 2 |
| CELZ | Creative Medical Technology Ho | 2 | 94 | 9.9 | 98,677 | 0.0000 | 0.005 | 3 |
| OPTT | Ocean Power Technologies, Inc. | 21 | 679 | 7.6 | 78,623 | 0.0000 | 0.341 | 0 |
| BTCS | BTCS Inc. | 66 | 221 | 8.9 | 64,051 | 0.0001 | 4.106 | 1 |
| GOVX | GeoVax Labs, Inc. | 3 | 434 | 8.8 | 56,801 | 0.0000 | 0.001 | 3 |
| GTBP | GT Biopharma, Inc. | 11 | 95 | 9.3 | 41,469 | 0.0000 | 0.016 | 2 |
| PHGE | BiomX Inc. | 2 | 60 | 7.9 | 35,749 | 0.0000 | 0.001 | 2 |
| TENX | Tenax Therapeutics, Inc. | 49 | 124 | 7.1 | 28,154 | 0.0000 | 0.005 | 2 |
2.2 Per-step results
| # | Out-of-sample window | The rule, overnight, half a cent a share SR | Every member bought and held SR |
|---|---|---|---|
| 1 | 2000-07-03 → 2001-06-29 | 0.05 | 1.09 |
| 2 | 2001-07-02 → 2002-07-01 | -0.01 | 0.00 |
| 3 | 2002-07-01 → 2003-07-01 | 0.73 | 0.24 |
| 4 | 2003-07-01 → 2004-06-30 | 2.28 | 2.16 |
| 5 | 2004-07-01 → 2005-07-01 | 1.47 | 1.19 |
| 6 | 2005-07-01 → 2006-06-30 | 2.67 | 1.13 |
| 7 | 2006-07-03 → 2007-06-29 | 1.56 | 1.69 |
| 8 | 2007-07-02 → 2008-06-30 | 1.32 | -0.64 |
| 9 | 2008-07-01 → 2009-07-01 | 2.36 | -0.37 |
| 10 | 2009-07-01 → 2010-07-01 | 1.52 | 1.05 |
| 11 | 2010-07-01 → 2011-07-01 | 1.61 | 2.07 |
| 12 | 2011-07-01 → 2012-06-29 | 0.51 | 0.09 |
| 13 | 2012-07-02 → 2013-07-01 | 1.40 | 1.93 |
| 14 | 2013-07-01 → 2014-07-01 | 2.89 | 2.19 |
| 15 | 2014-07-01 → 2015-07-01 | 1.15 | 0.65 |
| 16 | 2015-07-01 → 2016-06-30 | 0.52 | 0.16 |
| 17 | 2016-07-01 → 2017-06-30 | 2.81 | 1.74 |
| 18 | 2017-07-03 → 2018-06-29 | 2.57 | 1.04 |
| 19 | 2018-07-02 → 2019-07-01 | -0.45 | 0.65 |
| 20 | 2019-07-01 → 2020-06-30 | 0.53 | 0.03 |
| 21 | 2020-07-01 → 2021-07-01 | 2.27 | 2.61 |
| 22 | 2021-07-01 → 2022-07-01 | 0.30 | -0.35 |
| 23 | 2022-07-01 → 2023-06-30 | -0.72 | 0.74 |
| 24 | 2023-07-03 → 2024-06-28 | 2.19 | 1.07 |
| 25 | 2024-07-01 → 2025-07-01 | -0.15 | 0.86 |
| 26 | 2025-07-01 → 2026-07-01 | 1.50 | 1.64 |
2.2b The family, walk by walk
Figure 4 draws these walks; here is every one of them in numbers, the paper’s own walk first and the study’s benchmark last.
| Walk | Windows | Span | Growth | CAGR | Worst drawdown | Pooled Sharpe |
|---|---|---|---|---|---|---|
| the rule against holding every member · The rule, overnight, half a cent a share (this paper) | 26 | 2000-07-03 → 2026-07-01 | +47893.3% | +26.8% | -31.6% | 1.03 |
| the rule against holding every member · Every member bought and held (this paper) | 26 | 2000-07-03 → 2026-07-01 | +1387.7% | +10.9% | -57.3% | 0.63 |
| every member overnight against holding them · Every member overnight, half a cent a share | 26 | 2000-07-03 → 2026-07-01 | -26.1% | -1.2% | -61.2% | -0.05 |
| every member overnight against holding them · Every member bought and held | 26 | 2000-07-03 → 2026-07-01 | +1387.7% | +10.9% | -57.3% | 0.63 |
| the rule at the estimated spread against holding · The rule, overnight, the estimated spread | 26 | 2000-07-03 → 2026-07-01 | -100.0% | -49.7% | -100.0% | -2.45 |
| the rule at the estimated spread against holding · Every member bought and held | 26 | 2000-07-03 → 2026-07-01 | +1387.7% | +10.9% | -57.3% | 0.63 |
| the rule, 0.01 percent a trade · The rule, overnight, 0.01 percent a trade | 26 | 2000-07-03 → 2026-07-01 | +5465511.1% | +52.1% | -29.6% | 1.70 |
| the rule, 0.01 percent a trade · Every member overnight, 0.01 percent a trade | 26 | 2000-07-03 → 2026-07-01 | +62.5% | +1.9% | -32.2% | 0.22 |
| the rule, 0.05 percent a trade · The rule, overnight, 0.05 percent a trade | 26 | 2000-07-03 → 2026-07-01 | +29947.5% | +24.5% | -51.1% | 0.95 |
| the rule, 0.05 percent a trade · Every member overnight, 0.05 percent a trade | 26 | 2000-07-03 → 2026-07-01 | -99.1% | -16.7% | -99.2% | -1.57 |
| the rule, half a cent a share a trade · The rule, overnight, half a cent a share | 26 | 2000-07-03 → 2026-07-01 | +47893.3% | +26.8% | -31.6% | 1.03 |
| the rule, half a cent a share a trade · Every member overnight, half a cent a share | 26 | 2000-07-03 → 2026-07-01 | -26.1% | -1.2% | -61.2% | -0.05 |
| the rule, no trading cost · The rule, overnight, no cost | 26 | 2000-07-03 → 2026-07-01 | +20059125.7% | +60.0% | -28.4% | 1.89 |
| the rule, no trading cost · Every member overnight, no cost | 26 | 2000-07-03 → 2026-07-01 | +498.8% | +7.1% | -31.7% | 0.67 |
| the rule, the estimated bid-ask spread a trade · The rule, overnight, the estimated spread | 26 | 2000-07-03 → 2026-07-01 | -100.0% | -49.7% | -100.0% | -2.45 |
| the rule, the estimated bid-ask spread a trade · Every member overnight, the estimated spread | 26 | 2000-07-03 → 2026-07-01 | -100.0% | -52.1% | -100.0% | -6.39 |
| platform reference (SPY) (benchmark) | 2000-07-03 → 2026-07-01 | +439.9% | +6.7% | -32.9% |
2.3 Search accounting
This paper's search is a declared family: a declared family, counted at N = 8 evaluated books. Every member is either a registered walk with its own sealed hypothesis and frozen record, or a derived average computed from those frozen records; every member is reported, in the family matrix table and the robustness figure, and none was selected away. The count is declared by the author rather than derived from one project's ledger, because the members are sibling registered studies; the declaration names them and is frozen in this artifact. What the source strategy's author searched before publishing is not knowable from here and is not counted. The registered per-step record below still guarantees each window's hypothesis was hashed and registered before that window was scored.
2.4 The comparison
Both arms trade the same registered windows, so their returns can be PAIRED: inside each window the two return series are inner-joined date by date and the difference rThe rule, overnight, half a cent a share − rEvery member bought and held is the object under test. Because this is ONE pre-declared contrast, frozen at registration before any window was scored, the paired statistic needs no multiple-testing deflation; the arm-level records carry the declared family count of §2.3 as their search accounting, and this contrast, sealed per window before scoring, is not multiplied by it.
In the table: Arm A = The rule, overnight, half a cent a share · Arm B = Every member bought and held.
| # | Window | Paired bars | Arm A | Arm B | Δ | Leader |
|---|---|---|---|---|---|---|
| 1 | 2000-07-05 → 2001-06-29 | 250 | -0.4% | +16.8% | -17.2 pp | Arm B |
| 2 | 2001-07-03 → 2002-07-01 | 247 | -2.1% | -1.4% | -0.8 pp | Arm B |
| 3 | 2002-07-02 → 2003-07-01 | 252 | +21.9% | +3.0% | +19.0 pp | Arm A |
| 4 | 2003-07-02 → 2004-06-30 | 251 | +47.1% | +30.2% | +17.0 pp | Arm A |
| 5 | 2004-07-02 → 2005-07-01 | 253 | +21.4% | +14.1% | +7.3 pp | Arm A |
| 6 | 2005-07-05 → 2006-06-30 | 251 | +33.9% | +13.3% | +20.6 pp | Arm A |
| 7 | 2006-07-05 → 2007-06-29 | 249 | +14.1% | +19.3% | -5.2 pp | Arm B |
| 8 | 2007-07-03 → 2008-06-30 | 251 | +27.9% | -14.4% | +42.3 pp | Arm A |
| 9 | 2008-07-02 → 2009-07-01 | 252 | +457.0% | -25.7% | +482.7 pp | Arm A |
| 10 | 2009-07-02 → 2010-07-01 | 252 | +41.4% | +23.6% | +17.8 pp | Arm A |
| 11 | 2010-07-02 → 2011-07-01 | 253 | +27.2% | +37.2% | -10.0 pp | Arm B |
| 12 | 2011-07-05 → 2012-06-29 | 251 | +10.0% | -1.0% | +10.9 pp | Arm A |
| 13 | 2012-07-03 → 2013-07-01 | 249 | +26.8% | +28.2% | -1.4 pp | Arm B |
| 14 | 2013-07-02 → 2014-07-01 | 252 | +54.5% | +26.5% | +27.9 pp | Arm A |
| 15 | 2014-07-02 → 2015-07-01 | 252 | +10.8% | +7.5% | +3.3 pp | Arm A |
| 16 | 2015-07-02 → 2016-06-30 | 252 | +9.2% | +1.2% | +8.0 pp | Arm A |
| 17 | 2016-07-05 → 2017-06-30 | 251 | +30.8% | +17.5% | +13.3 pp | Arm A |
| 18 | 2017-07-05 → 2018-06-29 | 250 | +30.4% | +12.1% | +18.3 pp | Arm A |
| 19 | 2018-07-03 → 2019-07-01 | 250 | -8.8% | +8.6% | -17.4 pp | Arm B |
| 20 | 2019-07-02 → 2020-06-30 | 252 | +14.4% | -5.1% | +19.5 pp | Arm A |
| 21 | 2020-07-02 → 2021-07-01 | 252 | +51.1% | +52.8% | -1.7 pp | Arm B |
| 22 | 2021-07-02 → 2022-07-01 | 252 | +3.8% | -7.9% | +11.6 pp | Arm A |
| 23 | 2022-07-05 → 2023-06-30 | 250 | -11.0% | +13.4% | -24.4 pp | Arm B |
| 24 | 2023-07-05 → 2024-06-28 | 249 | +34.8% | +12.3% | +22.6 pp | Arm A |
| 25 | 2024-07-02 → 2025-07-01 | 250 | -6.8% | +14.2% | -21.0 pp | Arm B |
| 26 | 2025-07-02 → 2026-07-01 | 251 | +42.2% | +21.0% | +21.2 pp | Arm A |
Paired Sharpe of the difference track: 0.57 · block bootstrap (2000 paths, block 10, seed 1234): P(The rule, overnight, half a cent a share beats Every member bought and held) = 99.8%.
Window win-rate. The rule, overnight, half a cent a share led 17 of 26 windows (65.4%), Every member bought and held led 9, and the mean window gap of +25.55 pp points the same way. Widest single window: 2008 at +482.7 pp.
| Period | Windows | The rule, overnight, half a cent a share | Every member bought and held | Mean gap | The rule, overnight, half a cent a share led |
|---|---|---|---|---|---|
| All windows | 26 | +37.75% | +12.20% | +25.55 pp | 17/26 |
| Before 2010 | 10 | +66.22% | +7.88% | +58.34 pp | 7/10 |
| 2010 onward | 16 | +19.96% | +14.91% | +5.06 pp | 10/16 |
3 The circuit
The strategy is a circuit of platform primitives, frozen when the study is registered. Below is the circuit as wired on the canvas, the objective it encodes and how the search runs through it, followed by the mathematics each primitive actually computes, the same formulas the execution engine runs. The complete parameterisation is preserved in the study ledger (Appendix A).
The sentence below is the registration record, generated when the circuit was sealed and printed verbatim; the authored description of the design is Section 1.
A COMPARATIVE study: The rule, overnight, half a cent a share vs Every member bought and held, walked on the same registered out-of-sample windows. The rule, overnight, half a cent a share: S&P 500, evaluated, and run out-of-sample from the anchor: anything the design estimates from history, where it estimates at all, is re-estimated at each anchor from pre-anchor data only, and the walk advances through registered out-of-sample windows; its disposition is the realized forward path versus the benchmark. Every member bought and held: S&P 500, evaluated, and run out-of-sample from the anchor: anything the design estimates from history, where it estimates at all, is re-estimated at each anchor from pre-anchor data only, and the walk advances through registered out-of-sample windows; its disposition is the realized forward path versus the benchmark. The arms differ in: 2 nodes across 4 recorded settings: Overnight book (PIT), book: his → all; Overnight or hold, a year, bps: 1.0 → 5.0; Overnight or hold, a year, cost_model: tick → flat; Overnight or hold, a year, leg: overnight → hold. NOTE: with more than one difference, an out-of-sample gap cannot be attributed to any single change. The contrast under test: whether The rule, overnight, half a cent a share generates better risk-adjusted returns than Every member bought and held over the identical out-of-sample windows.
The two blocks this study runs on, the overnight book and the overnight hold, were written for it as custom primitives on the engine, the way a user writes one on the desktop. They read a frozen table of split-adjusted daily bars pulled once from the vendor, price the trades at five costs, and run on any universe such a table is built for. Universe and Autopsy are the platform's own.
Envelopes show counts, ratios, dates, and the parameters the author chose. Full price and per-name data series are not republished: the underlying market data is licensed to QuanterLab. Point figures quoted in the prose, a named holding's return over a stated span, are summary facts derived from public market prices, not redistributed series.
The objective and the search
The rule, overnight, half a cent a share
| Universe | S&P 500 index constituents. |
|---|---|
| Validation & out-of-sample | overnight forward test (every name of the book bought at the close and sold at the next open, every night of the one-year window, the book re-picked on its rule every few sessions, a dividend whose ex-date is the next session received, 1.0 basis points paid on each leg). |
| Other components | Study: Overnight book (PIT), Overnight or hold, a year. |
Every member bought and held
| Validation & out-of-sample | held forward test (every wired name bought equal weight at the anchor close and held to the end of the one-year window, dividends reinvested on the ex-date, 5.0 basis points one way at entry and at exit). |
|---|
Every other specification row is identical to The rule, overnight, half a cent a share's table above.
What differs between the arms, 2 differences; more than one thing changes at once:
- paramOvernight book (PIT), book: his → all
- paramOvernight or hold, a year, bps: 1.0 → 5.0
- paramOvernight or hold, a year, cost_model: tick → flat
- paramOvernight or hold, a year, leg: overnight → hold
Reader's note. With 4 settings changed at once across 2 nodes, an out-of-sample gap between the arms cannot be attributed to any single change, the arms are compared as whole packages, and any causal reading of one ingredient is unsupported by this design.
Cost elements are wired into the circuit, the realised drag is reported per step in Appendix B.
Show the mathematics, 2 primitives, formulas and parity notes
3.1 Universe
The starting set of tickers, resolved point-in-time from the index change-log, so names delisted or removed later still compete on the dates they traded.
Before any math, you need a list of stocks. An index preset (S&P 500, Nasdaq-100, Dow 30) is reconstructed as it stood ON your anchor date by replaying the historical add/drop change-log backwards, so a 2018 backtest sees the 2018 membership, not today's winners.
Start from today's constituents and un-apply every membership change after the anchor t:
\mathcal{U}(t) = \mathcal{U}_{\text{now}} \;\ominus\; \{\text{adds after } t\} \;\oplus\; \{\text{drops after } t\}3.2 Portfolio Forward Autopsy
The post-mortem, where the forward test’s return actually came from.
Runs after the Portfolio Forward Test and dissects its realized path: per-rebalance contributions, winners and losers, exposure and cash periods, and how the realized route compares to what the risk cones projected. It computes nothing new about the future, it explains the past the book just lived.
Depth I–IV: headline attribution, per-segment breakdown, per-name contributions, and the calibration ledger (projected cone vs realized, segment by segment). In a study, this is the node that fills the appendices.
4 Discussion
4.1 Findings
The funds that tried it (Table 5). In June 2022 two exchange-traded funds opened to do exactly this for the public: NSPY held S&P 500 futures and NIWM Russell 2000 futures from each close to the next open and sat in cash by day, sold on the record that the index's return comes at night, the record the next paragraph reads. Futures were the right tool, a fraction of the cost any stock trader pays, and the funds did what they were built to do. They tracked the night with a correlation of 0.91 and 0.96. The night they got was down while the day was up. NSPY returned -5.6 percent over its fourteen months against 18.2 for SPY held round the clock, NIWM -8.5 against 10.9 for IWM. About 36 thousand dollars a day changed hands in NSPY. Both closed in August 2023.
The night's gain is real (Figure 6, Table 5). SPY held only overnight grew 13.7-fold from 1993 to 2026, held only through the day 1.27-fold, held round the clock 17.4-fold. Before 2009 the night carried the whole return and the day lost half. Since 2009 both are up, 3.20-fold against 2.57-fold. The members show the same: equal weight, their nights compounded at 10.7 percent a year against 5.5 for their days in 2000 to 2009, 5.3 against 6.2 in the 2010s and 8.4 against 1.8 since 2020.
You cannot collect it by trading (Table 1). Every member bought at every close and sold at every open made 7.7 percent a year before any cost, and holding the same names made 12.1. A dollar became 5.99 against 14.88. Then the costs. At 0.01 percent a trade the night makes 2.4 percent a year and a dollar becomes 1.62. At 0.05 percent it makes minus 16.2, a dollar shrinks to less than a cent, and it lost money in 25 of the 26 years. At the estimated spread it is minus 50.0. The night's gain on the index is a few hundredths of a percent a night, and a buy plus a sell costs more than that.
The doubling table is the spread (Figure 5, Tables 6 and 7). Among 1,046 US stocks under 300 million dollars, the median one turned a dollar into 3.75 at night since 2020 and into 0.06 by day. Close to close it ended at 24 cents. In 86 percent of them the night beat close to close, and in 30 percent the night made ten times or more on a stock that ended below its start. The largest night gains, SCWO, BRTX, IQST, LODE and the rest, run to millions of times on stocks that went nowhere: twelve of the fourteen are below their start, and they carry 24 reverse splits between them. The bounce is largest in stocks that trade 99 to 608 thousand dollars a day and smallest in the ones that barely trade, because a day without a trade has no bid and no ask to bounce between. A stock cannot rise ten-fold at night and end lower unless it gives the night back every day; that is the last print at the bid and the first at the ask, counted twice.
The rule's whole result sits between two cost assumptions (Figures 2 and 3, Tables 1 to 4). At what a per-share broker charges, half a cent a share, it beat holding in 17 of 26 years, median 24.4 percent a year against 13.3, and a dollar became 480. At 0.05 percent a trade, the cost the claims assume, a dollar became 301. Both figures are mostly one year, July 2008, explained below. Take that year out and the two costs part company. At half a cent the rule still turns a dollar into 86.15 against 14.88 from holding, up in 20 of the 25 years and ahead of holding in 16. At 0.05 percent it turns a dollar into 10.81, ahead of holding in 9 of 25 years. The difference between the two costs is about a fifth of the money a year, and that is the whole margin. Split the walk at 2010 (Table 10) and the lead is almost all in the first half, a mean gap of 58 points a year before 2010 against 5 after it, and the first half is mostly the one year. After 2010 the rule and holding the same names are within a few points of each other a year, and the rule pays five hundred trades a year for that. The last ten years (Figure 3) are the plainest view. A dollar in the rule at 0.05 percent became 0.75, and in every member held overnight at that cost 0.24, while holding the same names made 3.36 and SPY 4.17. At half a cent the rule made 4.44, against 4.17 for SPY, ahead of holding in 6 of the ten years, on a book that leaned on Micron, Nvidia, AMD, Gilead, American Airlines, Coterra, Biogen, Broadcom and Oracle in turn (Table 3) with a third of the money in one name on an average night. That green line is the rule's best case, a per-share broker and auction orders, before tax. Five hundred trades a year, and after ten years it stands where SPY stands. The names it leaned on over the 26 years say what the rule is: Ciena at 2.22 dollars in 2004, JDSU at 2.68 dollars in 2002, Citigroup at 4 dollars in 2009, Office Depot at 5 dollars in 2010, and when the index had no wreck the year's biggest gapper, Nvidia in 2023, Broadcom in 2024, Oracle in 2025. Outside 2008 its median night is -0.03 to 0.27 percent, a drip. Neither cost line pays the bid-ask spread or the order's own push on the price. At the estimated spread the rule is above water in none of the 26 years.
What happened in 2008 (Table 4). The crash turned members of the S&P 500 into penny stocks, and a penny stock with news at night is what the rule is built to find. Freddie Mac closed June 2008 at 16.40 dollars. The government took it over on Sunday, September 7. It opened Monday at 2.50, closed at 0.88, and traded between 26 cents and two dollars for the rest of the year, ten to a few hundred million shares a day. The government's moves came at night and the stock gapped up on them: 97 percent at the open of September 19, the morning of the short-sale ban and the rescue plan; 49 percent on March 19, the morning after the Fed enlarged its purchases of the agencies' bonds; and the day sold each gap back. Over the year its night leg multiplied a dollar 135 times while close to close it lost 96 percent. The rule, which weights by the strongest ninety-session night gain to the fourth power, put 93 percent of the book into it on September 30 and held it at 60 to 96 percent into late January. Over those four months the stock fell from 1.71 to 0.59 and the rule's night leg on it made 4.6 times. Ford, Unisys and AIG did the same at smaller weights, and twelve of that year's nights made more than ten percent. At 0.05 percent a trade the year is 2,680 percent because 0.05 percent of a fifty-cent stock is a fortieth of a cent, a cost no one has paid; at half a cent a share it is 457 percent. Freddie Mac had left the index on September 10; the walks hold the July list for the year, and the limitations say what the live list gives.
4.2 Interpretation
For the index it is not worth doing. The night's gain on the index is the same money as holding, split differently: whoever holds a stock through the night gets the night for free and the day on top. Buying every evening and selling every morning keeps the night, drops the day, and pays five hundred trades a year for the privilege. On the S&P 500 the day was worth 4.5 percent a year on top of the night, and the trades cost more than the night paid. That is why the funds closed. They held the night of the index in a year in which the night was down and the day was up, at the lowest cost anyone can get, and there was nothing left over. The idea was sold on the long record of SPY, which is true, and delivered the one thing the record does not promise, that the night beats the day every year.
For the rule that picks the strongest night movers, the answer is the same, and its best case is the reason. A stock whose last ninety closes sat below its next opens is either quoted so wide that the bars alternate bid and ask, which is the microcap table, or falling all day and gapping back at the open, which is a stock in trouble. The rule cannot tell the two apart, and in the S&P 500 it lands on the second. Those stocks do pay at night: Berkman and his co-authors found the night's gain concentrated in exactly the volatile, watched names the rule picks, and the record here agrees, at half a cent a share, in 16 of 25 ordinary years. The rest of the story is the cost and the concentration. An account at a per-share broker, half a cent a share, that buys at the closing auction and sells at the opening one pays the half-cent line and would have had the green line in Figures 2 and 3. That is the rule's best case, and it ends the last ten years where SPY ends, 4.44 against 4.17, after five hundred trades a year with a third of the money in one name on an average night, before tax. Anyone paying the 0.05 percent the claims assume would have had the red one, below holding without 2008 and down 25 percent over the last ten years while holding made 3.4 times the money (Figure 3). A plainer version tried after the walks, the ten strongest names equal weight at 0.05 percent, made a dollar into 24, 22 of them in 2008, and 2.20 in the other 25 years together. A cap on any one name's weight is the next thing to test; the record says most of the lead is the concentration. The best case of the rule ends level with the man who did nothing, and the usual case loses money.
What the literature already knew. Cooper, Cliff and Gulen (2008) found the U.S. equity premium since 1993 earned overnight; Berkman, Koch, Tuttle and Zhang (2012) traced the night's gain in small, volatile stocks to retail buying at the open that is given back by the close; Lou, Polk and Skouras (2019) showed most anomalies earn their return either at night or by day, rarely both; Knuteson (2020) asked why the night of the whole market is so persistent. This study adds the costs. The night is real, a trade cannot keep it, and the rule that chases it buys wrecks.
What would change the verdict: a fill model from the tape, effective spreads and auction imbalances by name and date, would replace the five assumed costs with a number; a walk on the Russell 2000, where retail attention is larger and the spreads wider, would show where between the S&P 500 and the microcap list the bounce takes over. The Russell walk is the next one to run.
The two blocks this study runs on, the overnight book and the overnight hold, were written for it as custom primitives on the engine, the way an account holder writes one, and they stay on the platform with the frozen bars they read. A reader with an account can wire them to a universe of their own and run the five costs on it.
This study is one member of a declared search family: the same design walked at several sealed settings across sibling registered projects, every member either a registered walk with its own frozen record or a derived average of those records, and every member reported. The family size is declared by the author and named in the lineage; it is the search-accounting count for this paper. What was searched before the source strategy was published is not knowable from here and is not counted.
4.3 Limitations
The costs are assumptions, not fills. The half-cent charge reads the price that printed through the vendor's split record, and where that record is empty the price is wrong; one such series, E*Trade before 2010, was found and refused, and the delisted names are where the record is thinnest. The cent is used throughout, though before 2001 most spreads were a sixteenth of a dollar, so the first two years are undercharged. The spread estimate overstates for liquid names by the amount stated in the method. On a two-dollar stock half a cent is a quarter of a percent a trade, the whole of a one-cent spread over the round trip, so on the names the rule leaned on most, the two-dollar banks of the crisis, the half-cent line charges at least what a fill costs and possibly more; that is in the rule's favour and is said here. A small order in the closing and opening auctions pays none of these and gets the auction price, which is the print; that is the no-cost row, and it holds for an account too small to move the auction in a two-dollar stock.
Membership is fixed at the anchor, so a name that leaves the index in the year stays eligible until its series ends; that is how Freddie Mac was held into 2009, twenty days after S&P dropped it, and the rule as it circulates has no index at all. The gate refuses a series with a hole in it but not a series that ends, so a takeover target is held to its last print and drops out at the next pick; between the two, up to six nights, its weight sits in cash.
The July list is a convention, and the record keeps it as registered. Replayed offline with each name leaving the index on the day of its removal, the rule holds Ford and then AIG in 2008 instead of Freddie Mac, and that year is 989 percent at half a cent. Over the 26 years the live list chains to 694 dollars at half a cent against 380 for the same replay on the July list, and to 153 at 0.05 percent against 241, so the convention understated the rule at the one cost and overstated it at the other; the replay carries no dividends, which is why its July-list run sits below the record's 480. Without 2008 the live list gives 63.70 and 6.74 against 68.59 and 8.72. The verdict does not move.
The microcap list is today's, so the names that died since 2020 are missing and the survivors' close-to-close figures carry the fall that made many of them microcaps; the split between night and day does not depend on that. The microcaps were censused and not walked, because the walk would be the bounce. No shorting anywhere.
References
- Gelman, A., & Loken, E. (2013). The garden of forking paths: Why multiple comparisons can be a problem, even when there is no “fishing expedition.” Working paper, Columbia University.
- Harvey, C. R., Liu, Y., & Zhu, H. (2016). … and the Cross-Section of Expected Returns. Review of Financial Studies, 29(1), 5–68. doi:10.1093/rfs/hhv059
- Lo, A. W. (2002). The Statistics of Sharpe Ratios. Financial Analysts Journal, 58(4), 36–52. doi:10.2469/faj.v58.n4.2453
- Cooper, Cliff and Gulen (2008), Return differences between trading and non-trading hours: like night and day, working paper: the U.S. equity premium since 1993 is earned overnight; the trading day's return is flat to negative.
- Berkman, Koch, Tuttle and Zhang (2012), Paying attention: overnight returns and the hidden cost of buying at the open, Journal of Financial and Quantitative Analysis: retail buying at the open lifts the opening price of attention-grabbing stocks, which give it back by the close; the effect is largest in small, volatile, high-turnover names.
- Lou, Polk and Skouras (2019), A tug of war: overnight versus intraday expected returns, Journal of Financial Economics: most anomalies earn their return either overnight or intraday, with the two legs often opposed.
- Knuteson (2020), Strikingly suspicious overnight and intraday returns, working paper: the persistence of the overnight leg across markets and years, and the case that it is made by someone's order flow at the open.
- Corwin and Schultz (2012), A simple way to estimate bid-ask spreads from daily high and low prices, Journal of Finance: the spread estimator from two consecutive days' ranges used as the dearest of the five costs; the paper reports it overstating for the most liquid names.
Appendix A Reproducibility in QuanterLab
Each step is backed by a frozen run report. The study is re-derivable from the ledger below.
| # | Commit | Report | Anchor | OOS window |
|---|---|---|---|---|
| 1 | 0eb60d2ba3de | 10123 | 2000-07-01 | 2000-07-03 → 2001-06-29 |
| 2 | 85e5decbfd50 | 10126 | 2001-07-01 | 2001-07-02 → 2002-07-01 |
| 3 | f05ec129da21 | 10130 | 2002-07-01 | 2002-07-01 → 2003-07-01 |
| 4 | f3e98d1a04df | 10132 | 2003-07-01 | 2003-07-01 → 2004-06-30 |
| 5 | 22f6c8091269 | 10135 | 2004-07-01 | 2004-07-01 → 2005-07-01 |
| 6 | 5c4e1d82fbf4 | 10138 | 2005-07-01 | 2005-07-01 → 2006-06-30 |
| 7 | f66da8bafec5 | 10141 | 2006-07-01 | 2006-07-03 → 2007-06-29 |
| 8 | 084f2d497633 | 10143 | 2007-07-01 | 2007-07-02 → 2008-06-30 |
| 9 | 833100f8eec8 | 10146 | 2008-07-01 | 2008-07-01 → 2009-07-01 |
| 10 | 688c6091192e | 10147 | 2009-07-01 | 2009-07-01 → 2010-07-01 |
| 11 | a4babe89604e | 10150 | 2010-07-01 | 2010-07-01 → 2011-07-01 |
| 12 | e8d7279ba366 | 10151 | 2011-07-01 | 2011-07-01 → 2012-06-29 |
| 13 | 493f6fcd6c68 | 10155 | 2012-07-01 | 2012-07-02 → 2013-07-01 |
| 14 | 7bb0a3833184 | 10159 | 2013-07-01 | 2013-07-01 → 2014-07-01 |
| 15 | b725369971f4 | 10161 | 2014-07-01 | 2014-07-01 → 2015-07-01 |
| 16 | 4984461ff8ba | 10163 | 2015-07-01 | 2015-07-01 → 2016-06-30 |
| 17 | ec77ba9cf40e | 10166 | 2016-07-01 | 2016-07-01 → 2017-06-30 |
| 18 | 37e0e8522499 | 10167 | 2017-07-01 | 2017-07-03 → 2018-06-29 |
| 19 | 1cc1288bf8fd | 10170 | 2018-07-01 | 2018-07-02 → 2019-07-01 |
| 20 | 14fa317593bb | 10171 | 2019-07-01 | 2019-07-01 → 2020-06-30 |
| 21 | 2a7eba69d593 | 10174 | 2020-07-01 | 2020-07-01 → 2021-07-01 |
| 22 | 9b29cea4320e | 10177 | 2021-07-01 | 2021-07-01 → 2022-07-01 |
| 23 | ecb0f1518920 | 10178 | 2022-07-01 | 2022-07-01 → 2023-06-30 |
| 24 | b4562e3411ad | 10182 | 2023-07-01 | 2023-07-03 → 2024-06-28 |
| 25 | 8476aee836ee | 10186 | 2024-07-01 | 2024-07-01 → 2025-07-01 |
| 26 | fa4c172e18ba | 10187 | 2025-07-01 | 2025-07-01 → 2026-07-01 |
Appendix A2 Registration record
What this record does and does not establish. Every window in this study is historical: the data existed before the study began, so this is sequential sealing on past windows, not pre-registration in the clinical-trial sense, and no procedure could make it so. What the platform does enforce is order, each step's specification was frozen and hashed before that step was scored, and the walk cannot advance past a step that was never run or close one with a result registered for a different window. The two timestamp columns below are the evidence: read them together and each seal precedes its own run, and each run precedes the next seal. A study whose seals all post-date its runs would show it here. Wall-clock spacing between seals varies with the author's schedule and queue latency; the ordering, not the tempo, is the claim.
“A COMPARATIVE study: The rule, overnight, half a cent a share vs Every member bought and held, walked on the same registered out-of-sample windows. The rule, overnight, half a cent a share: S&P 500, evaluated, and run out-of-sample from the anchor: anything the design estimates from history, where it estimates at all, is re-estimated at each anchor from pre-anchor data only, and the walk advances through registered out-of-sample windows; its disposition is the realized forward path versus the benchmark. Every member bought and held: S&P 500, evaluated, and run out-of-sample from the anchor: anything the design estimates from history, where it estimates at all, is re-estimated at each anchor from pre-anchor data only, and the walk advances through registered out-of-sample windows; its disposition is the realized forward path versus the benchmark. The arms differ in: 2 nodes across 4 recorded settings: Overnight book (PIT), book: his → all; Overnight or hold, a year, bps: 1.0 → 5.0; Overnight or hold, a year, cost_model: tick → flat; Overnight or hold, a year, leg: overnight → hold. NOTE: with more than one difference, an out-of-sample gap cannot be attributed to any single change. The contrast under test: whether The rule, overnight, half a cent a share generates better risk-adjusted returns than Every member bought and held over the identical out-of-sample windows.”
The same hypothesis was registered independently at every step, hashed before each step's out-of-sample window was scored:
| # | Anchor | Registered at (UTC) | Run completed (UTC) |
|---|---|---|---|
| 1 | 2000-07-01 | 2026-09-13 13:42:29 | 2026-09-13 13:42:42 |
| 2 | 2001-07-01 | 2026-09-13 13:42:42 | 2026-09-13 13:42:54 |
| 3 | 2002-07-01 | 2026-09-13 13:42:54 | 2026-09-13 13:43:18 |
| 4 | 2003-07-01 | 2026-09-13 13:43:18 | 2026-09-13 13:43:30 |
| 5 | 2004-07-01 | 2026-09-13 13:43:31 | 2026-09-13 13:43:43 |
| 6 | 2005-07-01 | 2026-09-13 13:43:43 | 2026-09-13 13:44:07 |
| 7 | 2006-07-01 | 2026-09-13 13:44:07 | 2026-09-13 13:44:19 |
| 8 | 2007-07-01 | 2026-09-13 13:44:20 | 2026-09-13 13:44:32 |
| 9 | 2008-07-01 | 2026-09-13 13:44:32 | 2026-09-13 13:44:44 |
| 10 | 2009-07-01 | 2026-09-13 13:44:44 | 2026-09-13 13:44:56 |
| 11 | 2010-07-01 | 2026-09-13 13:44:56 | 2026-09-13 13:45:09 |
| 12 | 2011-07-01 | 2026-09-13 13:45:09 | 2026-09-13 13:45:21 |
| 13 | 2012-07-01 | 2026-09-13 13:45:21 | 2026-09-13 13:45:45 |
| 14 | 2013-07-01 | 2026-09-13 13:45:45 | 2026-09-13 13:46:10 |
| 15 | 2014-07-01 | 2026-09-13 13:46:10 | 2026-09-13 13:46:22 |
| 16 | 2015-07-01 | 2026-09-13 13:46:22 | 2026-09-13 13:46:46 |
| 17 | 2016-07-01 | 2026-09-13 13:46:46 | 2026-09-13 13:46:59 |
| 18 | 2017-07-01 | 2026-09-13 13:46:59 | 2026-09-13 13:47:11 |
| 19 | 2018-07-01 | 2026-09-13 13:47:11 | 2026-09-13 13:47:23 |
| 20 | 2019-07-01 | 2026-09-13 13:47:24 | 2026-09-13 13:47:36 |
| 21 | 2020-07-01 | 2026-09-13 13:47:36 | 2026-09-13 13:47:48 |
| 22 | 2021-07-01 | 2026-09-13 13:47:48 | 2026-09-13 13:48:13 |
| 23 | 2022-07-01 | 2026-09-13 13:48:13 | 2026-09-13 13:48:25 |
| 24 | 2023-07-01 | 2026-09-13 13:48:25 | 2026-09-13 13:48:50 |
| 25 | 2024-07-01 | 2026-09-13 13:48:50 | 2026-09-13 13:49:14 |
| 26 | 2025-07-01 | 2026-09-13 13:49:14 | 2026-09-13 13:49:26 |
Appendix B Per-step diagnostics
Realized in the projection tables below is the risk engine scoring its own forecast: the buy-and-hold return of the segment that followed each rebalance, on the same gross basis the cone was projected on. It is deliberately not the charged, calendar-window total return the study’s tables print, so the two will not reconcile line by line; the cone and its outcome share one basis, which is what a calibration test requires. Each row names its segment’s span so a boundary session is visible.
Names held is the union across the window: the count of distinct instruments the book touched between the window’s first and last session, not the number it held at one time. A book that rotates monthly touches more names than it holds.
What each step's run actually did beyond its return: capital allocation across lanes and regimes, the portfolio book's rebalancing and cost drag, and how positions were sized. Harvested from the frozen run reports, present where the circuit produced them. Cost drag is the gap between the step's return before and after its trading costs, in percentage points of the step's starting capital, so on a book that trades every session and compounds it can exceed the step's own net return.
Open the full per-step grid (26 steps: every rebalance, capital routing and sizing, per window)
Step 1 · 2000-07-03 → 2001-06-29
The rule, overnight, half a cent a share
Portfolio book, rebalanced nightly · 385 names held · selection: his · cost drag 15.65%
Every member bought and held
Portfolio book, rebalanced hold · 385 names held · selection: all · cost drag 0.117%
Step 2 · 2001-07-02 → 2002-07-01
The rule, overnight, half a cent a share
Portfolio book, rebalanced nightly · 394 names held · selection: his · cost drag 15.869%
Every member bought and held
Portfolio book, rebalanced hold · 394 names held · selection: all · cost drag 0.099%
Step 3 · 2002-07-01 → 2003-07-01
The rule, overnight, half a cent a share
Portfolio book, rebalanced nightly · 397 names held · selection: his · cost drag 101.671%
Every member bought and held
Portfolio book, rebalanced hold · 397 names held · selection: all · cost drag 0.103%
Step 4 · 2003-07-01 → 2004-06-30
The rule, overnight, half a cent a share
Portfolio book, rebalanced nightly · 406 names held · selection: his · cost drag 37.898%
Every member bought and held
Portfolio book, rebalanced hold · 406 names held · selection: all · cost drag 0.13%
Step 5 · 2004-07-01 → 2005-07-01
The rule, overnight, half a cent a share
Portfolio book, rebalanced nightly · 409 names held · selection: his · cost drag 60.152%
Every member bought and held
Portfolio book, rebalanced hold · 409 names held · selection: all · cost drag 0.114%
Step 6 · 2005-07-01 → 2006-06-30
The rule, overnight, half a cent a share
Portfolio book, rebalanced nightly · 411 names held · selection: his · cost drag 52.109%
Every member bought and held
Portfolio book, rebalanced hold · 411 names held · selection: all · cost drag 0.113%
Step 7 · 2006-07-03 → 2007-06-29
The rule, overnight, half a cent a share
Portfolio book, rebalanced nightly · 421 names held · selection: his · cost drag 13.928%
Every member bought and held
Portfolio book, rebalanced hold · 421 names held · selection: all · cost drag 0.119%
Step 8 · 2007-07-02 → 2008-06-30
The rule, overnight, half a cent a share
Portfolio book, rebalanced nightly · 431 names held · selection: his · cost drag 25.716%
Every member bought and held
Portfolio book, rebalanced hold · 431 names held · selection: all · cost drag 0.086%
Step 9 · 2008-07-01 → 2009-07-01
The rule, overnight, half a cent a share
Portfolio book, rebalanced nightly · 438 names held · selection: his · cost drag 3008.953%
Every member bought and held
Portfolio book, rebalanced hold · 438 names held · selection: all · cost drag 0.074%
Step 10 · 2009-07-01 → 2010-07-01
The rule, overnight, half a cent a share
Portfolio book, rebalanced nightly · 446 names held · selection: his · cost drag 51.585%
Every member bought and held
Portfolio book, rebalanced hold · 446 names held · selection: all · cost drag 0.124%
Step 11 · 2010-07-01 → 2011-07-01
The rule, overnight, half a cent a share
Portfolio book, rebalanced nightly · 450 names held · selection: his · cost drag 31.632%
Every member bought and held
Portfolio book, rebalanced hold · 450 names held · selection: all · cost drag 0.137%
Step 12 · 2011-07-01 → 2012-06-29
The rule, overnight, half a cent a share
Portfolio book, rebalanced nightly · 454 names held · selection: his · cost drag 29.933%
Every member bought and held
Portfolio book, rebalanced hold · 454 names held · selection: all · cost drag 0.099%
Step 13 · 2012-07-02 → 2013-07-01
The rule, overnight, half a cent a share
Portfolio book, rebalanced nightly · 461 names held · selection: his · cost drag 32.243%
Every member bought and held
Portfolio book, rebalanced hold · 461 names held · selection: all · cost drag 0.128%
Step 14 · 2013-07-01 → 2014-07-01
The rule, overnight, half a cent a share
Portfolio book, rebalanced nightly · 467 names held · selection: his · cost drag 23.547%
Every member bought and held
Portfolio book, rebalanced hold · 467 names held · selection: all · cost drag 0.127%
Step 15 · 2014-07-01 → 2015-07-01
The rule, overnight, half a cent a share
Portfolio book, rebalanced nightly · 470 names held · selection: his · cost drag 6.49%
Every member bought and held
Portfolio book, rebalanced hold · 470 names held · selection: all · cost drag 0.107%
Step 16 · 2015-07-01 → 2016-06-30
The rule, overnight, half a cent a share
Portfolio book, rebalanced nightly · 479 names held · selection: his · cost drag 10.084%
Every member bought and held
Portfolio book, rebalanced hold · 479 names held · selection: all · cost drag 0.101%
Step 17 · 2016-07-01 → 2017-06-30
The rule, overnight, half a cent a share
Portfolio book, rebalanced nightly · 492 names held · selection: his · cost drag 11.944%
Every member bought and held
Portfolio book, rebalanced hold · 492 names held · selection: all · cost drag 0.118%
Step 18 · 2017-07-03 → 2018-06-29
The rule, overnight, half a cent a share
Portfolio book, rebalanced nightly · 494 names held · selection: his · cost drag 8.347%
Every member bought and held
Portfolio book, rebalanced hold · 494 names held · selection: all · cost drag 0.112%
Step 19 · 2018-07-02 → 2019-07-01
The rule, overnight, half a cent a share
Portfolio book, rebalanced nightly · 496 names held · selection: his · cost drag 8.954%
Every member bought and held
Portfolio book, rebalanced hold · 496 names held · selection: all · cost drag 0.109%
Step 20 · 2019-07-01 → 2020-06-30
The rule, overnight, half a cent a share
Portfolio book, rebalanced nightly · 499 names held · selection: his · cost drag 9.255%
Every member bought and held
Portfolio book, rebalanced hold · 499 names held · selection: all · cost drag 0.095%
Step 21 · 2020-07-01 → 2021-07-01
The rule, overnight, half a cent a share
Portfolio book, rebalanced nightly · 500 names held · selection: his · cost drag 19.086%
Every member bought and held
Portfolio book, rebalanced hold · 500 names held · selection: all · cost drag 0.153%
Step 22 · 2021-07-01 → 2022-07-01
The rule, overnight, half a cent a share
Portfolio book, rebalanced nightly · 500 names held · selection: his · cost drag 7.581%
Every member bought and held
Portfolio book, rebalanced hold · 500 names held · selection: all · cost drag 0.092%
Step 23 · 2022-07-01 → 2023-06-30
The rule, overnight, half a cent a share
Portfolio book, rebalanced nightly · 499 names held · selection: his · cost drag 5.275%
Every member bought and held
Portfolio book, rebalanced hold · 499 names held · selection: all · cost drag 0.113%
Step 24 · 2023-07-03 → 2024-06-28
The rule, overnight, half a cent a share
Portfolio book, rebalanced nightly · 499 names held · selection: his · cost drag 7.346%
Every member bought and held
Portfolio book, rebalanced hold · 499 names held · selection: all · cost drag 0.112%
Step 25 · 2024-07-01 → 2025-07-01
The rule, overnight, half a cent a share
Portfolio book, rebalanced nightly · 499 names held · selection: his · cost drag 5.251%
Every member bought and held
Portfolio book, rebalanced hold · 499 names held · selection: all · cost drag 0.114%
Step 26 · 2025-07-01 → 2026-07-01
The rule, overnight, half a cent a share
Portfolio book, rebalanced nightly · 499 names held · selection: his · cost drag 7.871%
Every member bought and held
Portfolio book, rebalanced hold · 499 names held · selection: all · cost drag 0.121%