


NASDAQ-100 Additions versus Deletions: Eighteen Decembers, an Effect That Died Around 2016, and the Ticker That Lied
Every December from 2007 to 2024, the NASDAQ-100 announced its annual re-ranking on the second Friday and applied it at the open on the Monday after the third. This study bought both sides of that event, every year, and held each side for one year: the additions and the deletions, each at two moments, the day after the announcement and the effective day itself. Every basket is a pure function of the index's dated change record. Nothing here is screened or chosen; the rulebook picks every portfolio, and every window was registered before it ran.
Pooled over eighteen years the deletions beat the additions by 9.2 points a window, and in the spirit of Arnott's index-fund work that is the expected sign. But the pooled number is not the finding. Split the record at 2016 and the effect falls apart in the open: before 2016 the excluded stocks beat the included by 26.6 points a window and won eight years of nine; from 2016 on the additions were ahead by 8.2 and won six of nine. The deletion premium, worth 18.7 points a window over the index itself in the first era, ran 16.3 points behind it in the second. The recovery trade the December machine used to hand out, Sirius at four times, Netflix at four times, stopped paying around the same time the index-effect literature says the announcement pop died.
One thing did not move between the eras: measured against capitalization-weighted QQQ, the additions lagged by about eight points a window in both halves, though against an equal-weight ruler most of that lag is weighting, not the event.
And one result in this paper exists because an audit killed a better one. The data vendor serves Overstock's price history under Bed Bath and Beyond's recycled ticker, and that impostor, passed by every shape-based gate, was briefly enough to make the deletions beat the index outright. The version you are reading survived its own audit. The more exciting version did not.
The single-channel December regime this record measures ended in May 2026, when quarterly membership reviews and a fast-entry lane joined it. Whatever replaces it, 2007 to 2024 is the clean record of the rule as it was.
1 Methodology
WHERE THIS SITS
Two literatures ask what an index change does to a stock, and they ask different questions. The first measures the days around the event: Shleifer (1986) and Harris and Gurel (1986) used S&P 500 additions to ask whether demand curves for stocks slope down, Chen, Noronha and Singal (2004) documented that additions and deletions do not mirror each other, and Greenwood and Sammon (2025) showed the addition-day pop has decayed from over seven percent in the 1990s to roughly nothing. Biktimirov and Xu (2019) brought that machinery to the NASDAQ-100 and found days-scale effects there too.
The second literature asks what happens afterwards. Arnott, Kalesnik and Wu (2018) showed that capitalization-weighted indices systematically add stocks after they have outperformed and delete them after they have underperformed, so an index fund is structurally a buyer of the expensive and a seller of the cheap, and the reversal that follows is long and slow.
This study belongs to the second literature and applies it where it has not been applied. The long-horizon work is built on the S&P 500 and broad cap-weighted families; the NASDAQ-100 work measures days. Nobody had asked the one-year question of the NASDAQ-100, an index with a date-based rulebook rather than committee discretion, a technology-heavy base, and one fixed December reconstitution. And the question has a deadline attached: since May 2026 the December event is no longer the sole regular entry channel, with membership now also moving at quarterly reviews and through a fast-entry lane (Nasdaq, 2026). The windows here, 2007 through 2024, are the complete record of the single-channel December regime.
HOW THE DECEMBER MACHINE WORKED
The NASDAQ-100 holds roughly one hundred of the largest non-financial companies listed on Nasdaq, weighted by a modified capitalization scheme. Once a year the index re-ranked its universe, announced the resulting additions and deletions on or about the second Friday of December, and applied them at the open on the Monday after the third Friday. The week in between is the most telegraphed trade in markets: everyone knows what the trackers must buy and sell, and when.
That calendar is the study's clock. Anchor dates are derived from the rule itself and checked against the exchange's December press releases, not taken from the data vendor, whose date field records the announcement week in some years and the effective week in others. The addition book and the deletion book are collected mechanically: every name whose change is effective within twelve days of the anchor, from the same dated change record the platform's point-in-time membership machinery already uses. Occasional off-cycle December events collected by that rule stay in, disclosed; the largest is Facebook's special addition in December 2012.
FOUR BOOKS, ONE RULER
Each December, four portfolios form: additions and deletions, each bought at the announcement timing (first trading day after the announcement) and at the effective timing (the Monday the change takes force). Equal weight, long only, held one year untouched, because an event basket re-selected at year end would quietly roll into the next year's event.
Every return is a total return, dividends credited on the ex-date and held as cash. Ten basis points come off every dollar traded, in all books alike. The benchmark is QQQ, the index's own tracker, rebuilt as a total-return series from its distribution record; because the books are equal-weight and QQQ is capitalization-weighted, the findings also read the books against the equal-weight tracker QQQE for the windows it has existed. The platform's comparison machinery is pairwise, so the record is sealed as two registered studies, additions against deletions at each timing, sharing one event table; this page hosts the effective-day pair and carries the announcement pair through every table as companion books.
The sealed, pre-registered contrast is additions against deletions. Statements about either book against the index are descriptions of realized paths, not registered claims, and they carry the weighting caveat above.
A name whose series ends inside a window, an acquisition closing mid-year, is carried at its final print for the remainder. A window enters the study only if at least two names on each side carry price data; 2006 fails that floor with one priceable deletion, leaving eighteen windows, 2007 through 2024.
2 Results
Findings
THE EFFECT, AND WHEN IT DIED
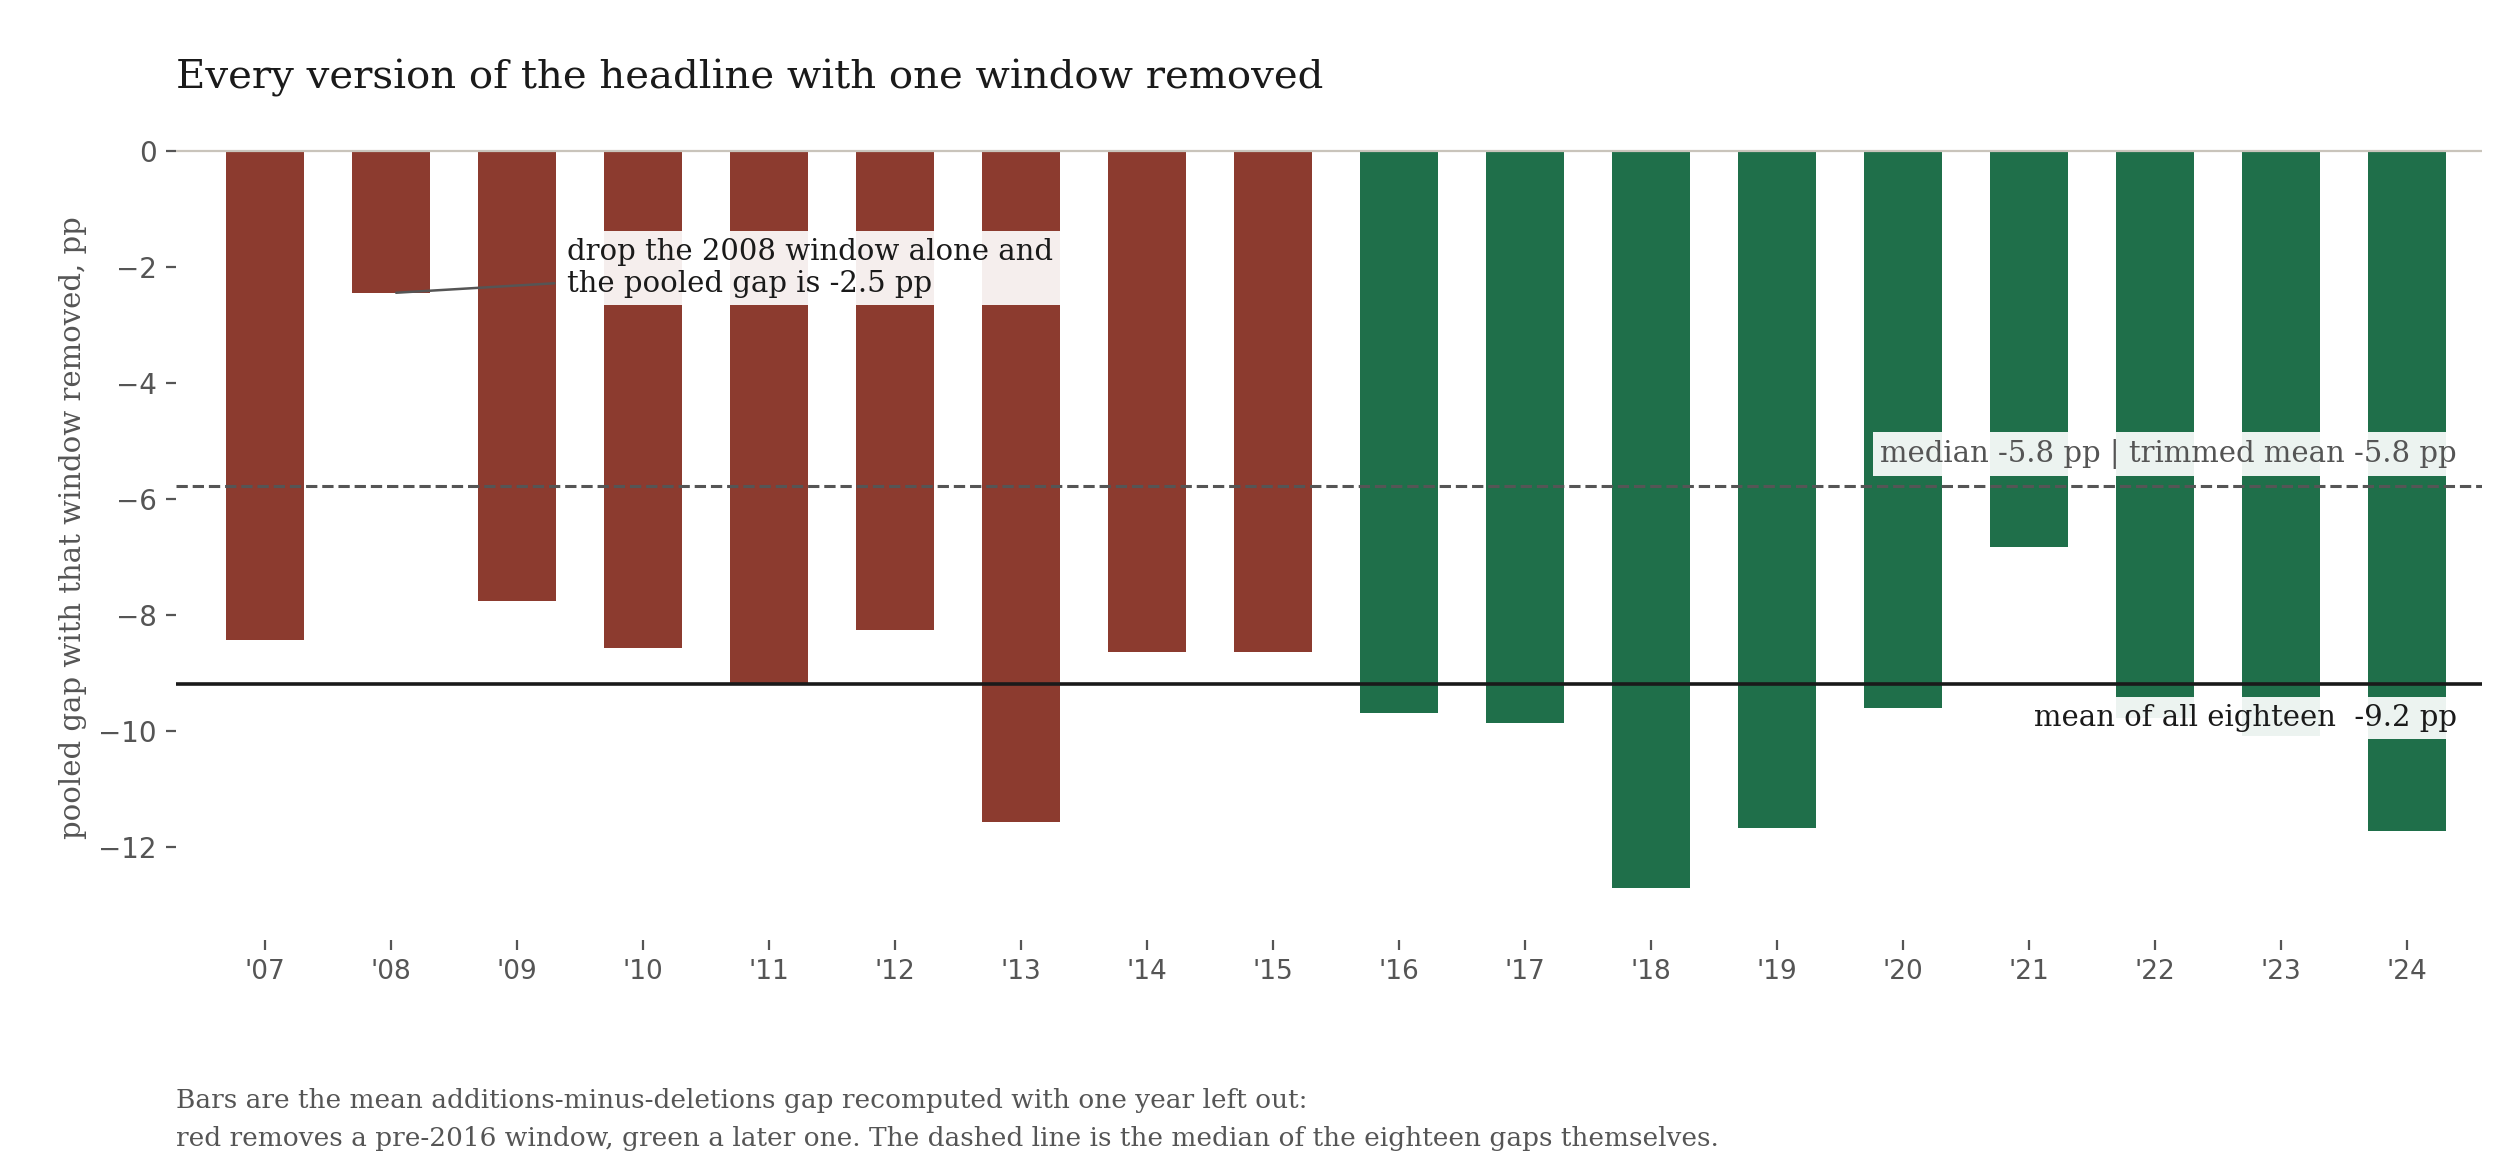
Pooled over all eighteen windows, the deletions beat the additions by 9.20 points a window. That number is true and it is not the finding, because it does not survive its own record. The median of the eighteen gaps is 5.8 points; drop the single 2008 window, where the deletions' post-crisis recovery beat the additions by 124 points, and the pooled gap falls to 2.5. The figure below shows every version of the headline with one window removed.
The era split is the summary that survives, and it does not depend on where the knife falls. Before 2016 the deletions won eight windows of nine, by 26.6 points a window on average. From 2016 on the additions won six of nine, by 8.2. Move the split anywhere in the middle of the decade and the same shape appears: cut at 2014 and the halves read minus 28.9 then plus 3.3; at 2015, minus 27.6 then plus 5.5; at 2017, minus 24.0 then plus 9.3; at 2018, minus 21.6 then plus 10.4, with additions leading most windows after every candidate boundary. The paper does not need 2016; it needs the mid-2010s, and any cut through them says the same thing. Windows are named by their December anchor throughout, so the 2008 window is calendar 2009, and so on. The second era's lead is itself fragile, resting largely on 2018's AMD-led class; drop that window and it shrinks to three points. The defensible statement is not that the effect reversed. It is that a large early effect faded to roughly a coin flip, on the same clock on which Greenwood and Sammon (2025) show the announcement-day effect decaying to nothing. The splash died, and so did the tide.
Window counts say the same thing without any pooling. The additions led 7 of 18 windows; a sign test puts the one-sided probability of that under a fair coin at 0.24, which is a lean and nothing stronger. The platform's daily block bootstrap across 4,530 paired bars reads 11.8 percent at this timing and 8.8 at the announcement timing, but eighteen annual events are eighteen observations, and the window-level test is the one this paper stands on.
WHAT DIED, PRECISELY
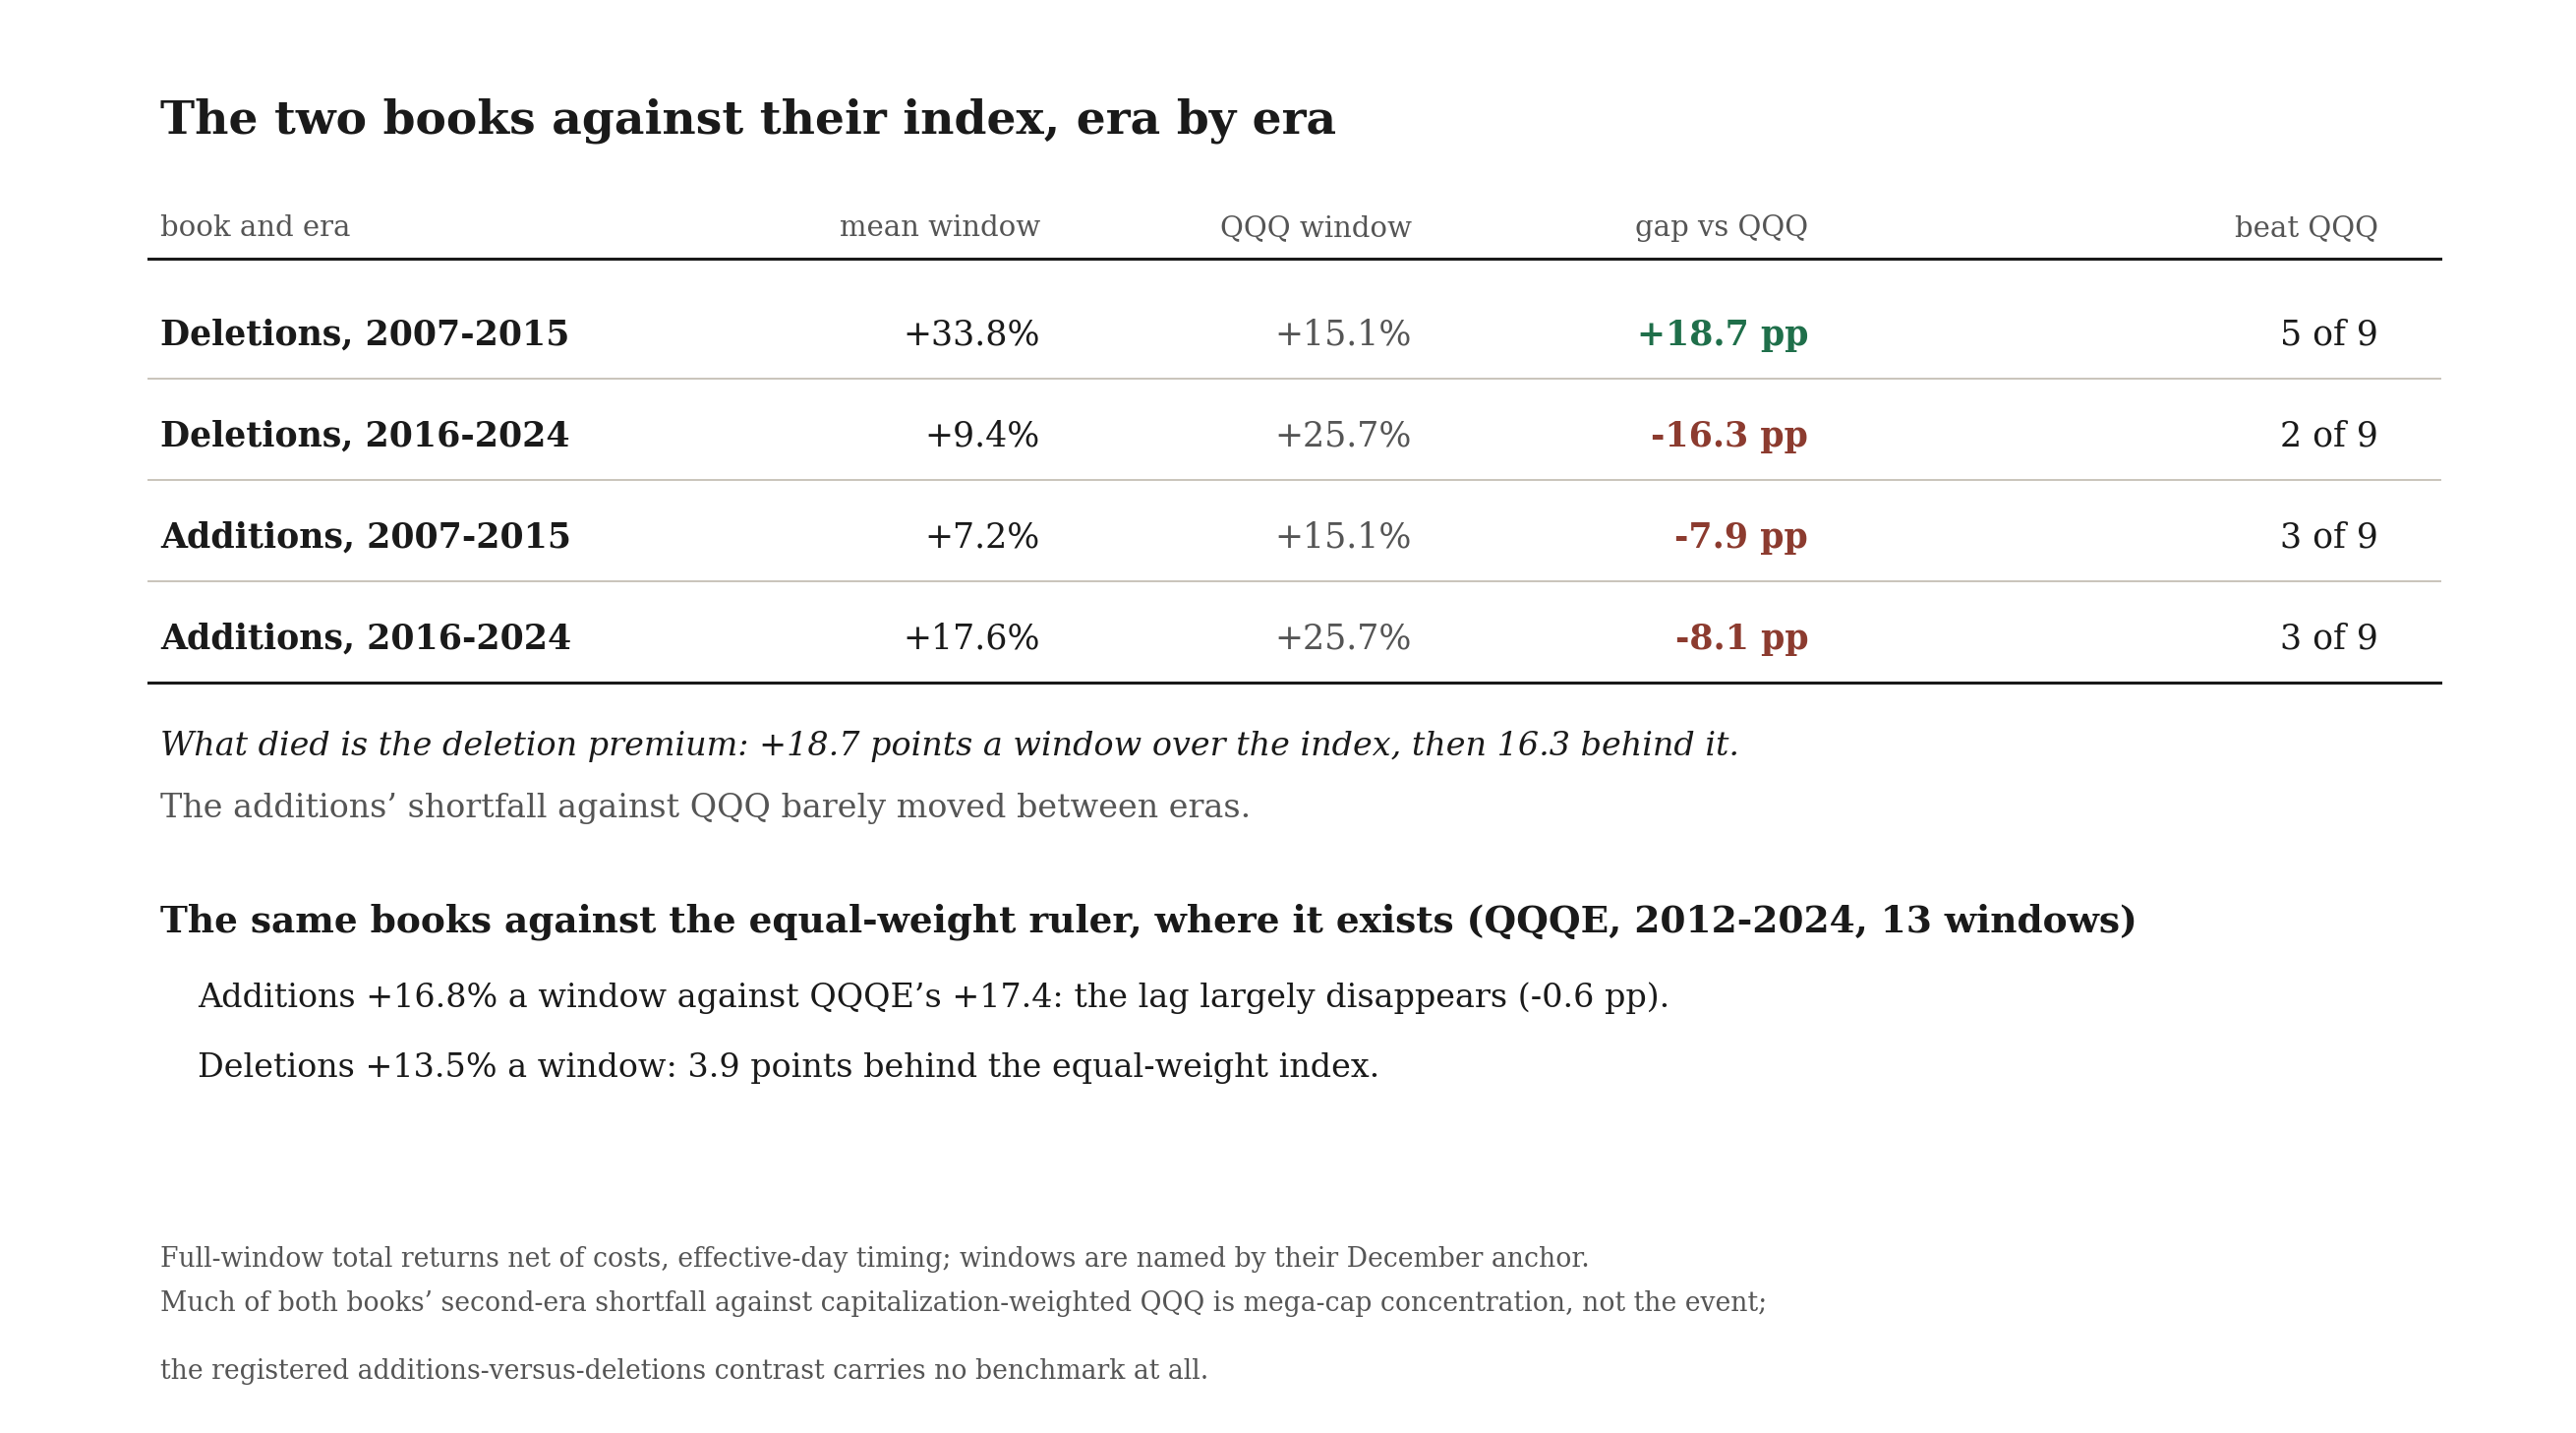
Split each book against the index and the decay localizes. The deletions beat QQQ by 18.7 points a window before 2016, winning five windows of nine, carried by the recovery trades the December machine used to sell into: the 2008 class returned 170 percent at this timing with Sirius XM up roughly 390 percent, and the 2012 class 72 percent with Netflix up roughly 310. The pooled Sharpe of the deletion book, 0.67 at this timing and 0.69 at the announcement, sits below QQQ's 0.81 in both eras taken together. From 2016 on the deletions ran 16.3 points a window behind the index and beat it twice in nine years. The resurrection windfalls simply stopped arriving.
The additions' shortfall against QQQ, by contrast, barely moved: 7.9 points a window before 2016, 8.1 after. But that constancy is partly an artifact of the ruler. Against the equal-weight tracker QQQE, which exists from 2012, the additions' lag largely disappears (16.8 a window against QQQE's 17.4 over those thirteen windows) while the deletions run 3.9 behind. The era table below the leave-one-out figure puts every one of these vs-index readings in one place. Much of the books' shortfall against QQQ in the second era is mega-cap concentration, not the event. The registered contrast between the two books is immune to that caveat; the vs-index readings are not, and both are shown.
THE WEEK EVERYONE TRADES
Buying deletions at the announcement rather than the effective day added 0.98 points to the average window, positive in 10 of 18 years. Buying additions early subtracted 1.01, positive in 8. One point a year, signs split near half, on books whose windows swing by forty: whatever the index-arbitrage week pays the people who trade it in hours, a one-year holder cannot collect it.
THE TICKER THAT LIED
This paper's strongest result is one it does not contain. The first sealed walk of this study reported that the deletions beat the index outright. The per-name audit that followed found the reason: the vendor's price series for BBBY, a 2016 deletion, is not Bed Bath and Beyond. Overstock dot com bought the brand out of the 2023 bankruptcy and took the ticker and the name, and the vendor serves the buyer's history under the dead company's symbol, profile included. Held unknowingly at one quarter of the four-name 2016 book, the impostor printed plus 269 percent for a year in which the real Bed Bath fell by a third.
Every shape-based data gate passed it, because it is a real company's real prices. It was caught by checking identities, name by name, against the change record, and the platform now refuses that class of series by an evidence-backed denylist. The corrected 2016 deletion window is plus 26 percent instead of plus 94, and the corrected deletion book straddles the index instead of beating it. The finding you are reading survived its own audit; the more exciting version of it did not.
WHAT COULD NOT BE HELD
Fifteen addition slots and fourteen deletion slots, of 243, could not be held: names the vendor no longer serves because they were acquired, delisted, or renamed out of their ticker. Each refusal is named in the appendix record of its window. The direction of the resulting bias is genuinely unknowable from stored data, because the missing deletions include both acquisition exits, which usually left at a premium, and collapses like Sears, which did not.
2.1 Headline
| Book | Total return | Per year | Volatility | Sharpe | Worst drawdown | Mean window |
|---|---|---|---|---|---|---|
| Deletions, announcement timing (companion run) | +1750.4% | 17.60% | 30.0% | 0.69 | -56.6% | +22.58% |
| Benchmark (reference) | +1591.5% | 17.01% | 22.4% | 0.81 | -51.2% | +20.42% |
| Deletions | +1536.9% | 16.80% | 30.0% | 0.67 | -56.6% | +21.73% |
| Additions | +313.6% | 8.21% | 29.7% | 0.41 | -53.2% | +12.52% |
| Additions, announcement timing (companion run) | +301.5% | 8.03% | 29.4% | 0.41 | -53.2% | +11.39% |
Volatility, Sharpe and worst drawdown are computed on each book's own stitched daily series over the identical trading days that Figure 1 draws, so the panel and the figure are the same arithmetic. Sharpe carries no cash hurdle. Mean window is the arithmetic average of the one-year window returns, each from its first close after the opening trade, and does not compound to the total beside it: the difference is volatility drag, plus that opening charge where the walk pays one.
2.2 Per-step results
| # | Out-of-sample window | Additions SR | Deletions SR | Additions, announcement timing SR | Deletions, announcement timing SR |
|---|---|---|---|---|---|
| 1 | 2007-12-24 → 2008-12-23 | -0.95 | -0.23 | -0.71 | -0.05 |
| 2 | 2008-12-22 → 2009-12-22 | 1.44 | 2.01 | 1.56 | 2.09 |
| 3 | 2009-12-21 → 2010-12-21 | 0.78 | 1.85 | 0.75 | 1.86 |
| 4 | 2010-12-20 → 2011-12-20 | -0.78 | 0.09 | -0.91 | 0.08 |
| 5 | 2011-12-19 → 2012-12-18 | 0.47 | 0.89 | 0.39 | 0.36 |
| 6 | 2012-12-24 → 2013-12-24 | 2.50 | 2.77 | 2.38 | 2.46 |
| 7 | 2013-12-23 → 2014-12-23 | 1.26 | 0.15 | 1.25 | 0.12 |
| 8 | 2014-12-22 → 2015-12-22 | -0.27 | 0.64 | 0.06 | 0.86 |
| 9 | 2015-12-21 → 2016-12-20 | -0.56 | 0.40 | -0.41 | 0.73 |
| 10 | 2016-12-19 → 2017-12-19 | 1.74 | 1.44 | 1.50 | 1.61 |
| 11 | 2017-12-18 → 2018-12-18 | 0.48 | 0.43 | 0.67 | 0.94 |
| 12 | 2018-12-24 → 2019-12-24 | 2.36 | 0.89 | 1.85 | 0.57 |
| 13 | 2019-12-23 → 2020-12-22 | 0.99 | 0.24 | 0.93 | 0.28 |
| 14 | 2020-12-21 → 2021-12-21 | 0.47 | 0.71 | 0.60 | 0.57 |
| 15 | 2021-12-20 → 2022-12-20 | -0.98 | 0.43 | -0.88 | 0.62 |
| 16 | 2022-12-19 → 2023-12-19 | 1.06 | 0.99 | 0.62 | 0.76 |
| 17 | 2023-12-18 → 2024-12-17 | 0.63 | 0.22 | 0.88 | 0.50 |
| 18 | 2024-12-23 → 2025-12-23 | 0.72 | 0.14 | 0.56 | -0.00 |
2.3 Search accounting
No search record exists for this design. It was not promoted from a recorded evolving search, so the number of alternatives tried before it, on paper, in another tool, or in the author's head, is unknown. Unknown is a different fact from one: a study with no lineage is not a strategy with one trial, it is a strategy with an unrecorded number of them. Accordingly no count of alternatives tried is claimed, and nothing in this paper is corrected for a search that was never recorded; the number that stands is the raw out-of-sample result plus this disclosure. The registered per-step record below (§4) still guarantees each window's hypothesis was hashed and registered before that window was scored.
2.4 The comparison
Both arms trade the same registered windows, so their returns can be PAIRED: inside each window the two return series are inner-joined date by date and the difference rAdditions − rDeletions is the object under test. Because this is ONE pre-declared contrast, frozen at registration before any window was scored, the paired statistic needs no multiple-testing deflation, and the per-arm pooled numbers above are likewise uncorrected, because this design has no recorded search to correct against (§2.3). The paired contrast carries that gap differently from the arm levels: it was declared before each window ran and it is scored on the difference, so no window could be read first and scored after. What the timestamps cannot speak to is how this contrast came to be the declared one, which is the limit §2.3 states.
| # | Window | Paired bars | Additions | Deletions | Δ | Leader | Additions, announcement timing | Deletions, announcement timing |
|---|---|---|---|---|---|---|---|---|
| 1 | 2007-12-26 → 2008-12-23 | 252 | -43.7% | -21.6% | -22.1 pp | Deletions | -36.8% | -14.3% |
| 2 | 2008-12-23 → 2009-12-22 | 252 | +46.2% | +170.1% | -123.9 pp | Deletions | +52.7% | +183.4% |
| 3 | 2009-12-22 → 2010-12-21 | 252 | +13.8% | +47.3% | -33.5 pp | Deletions | +13.1% | +47.8% |
| 4 | 2010-12-21 → 2011-12-20 | 253 | -21.5% | -1.5% | -19.9 pp | Deletions | -24.2% | -1.7% |
| 5 | 2011-12-20 → 2012-12-18 | 250 | +11.0% | +20.2% | -9.3 pp | Deletions | +7.1% | +5.9% |
| 6 | 2012-12-26 → 2013-12-24 | 252 | +46.8% | +71.8% | -25.0 pp | Deletions | +43.7% | +62.6% |
| 7 | 2013-12-24 → 2014-12-23 | 252 | +32.3% | +1.1% | +31.2 pp | Additions | +31.3% | +0.6% |
| 8 | 2014-12-23 → 2015-12-22 | 252 | -6.4% | +12.3% | -18.7 pp | Deletions | -0.7% | +17.9% |
| 9 | 2015-12-22 → 2016-12-20 | 252 | -12.9% | +5.7% | -18.6 pp | Deletions | -10.3% | +12.1% |
| 10 | 2016-12-20 → 2017-12-19 | 252 | +25.3% | +25.9% | -0.6 pp | Deletions | +21.1% | +29.6% |
| 11 | 2017-12-19 → 2018-12-18 | 251 | +9.4% | +7.2% | +2.2 pp | Additions | +14.3% | +19.8% |
| 12 | 2018-12-26 → 2019-12-24 | 252 | +64.0% | +13.4% | +50.6 pp | Additions | +47.8% | +6.7% |
| 13 | 2019-12-24 → 2020-12-22 | 252 | +35.3% | +2.2% | +33.1 pp | Additions | +32.1% | +3.6% |
| 14 | 2020-12-22 → 2021-12-21 | 252 | +9.1% | +11.4% | -2.3 pp | Deletions | +12.3% | +8.3% |
| 15 | 2021-12-21 → 2022-12-20 | 252 | -42.3% | +7.2% | -49.5 pp | Deletions | -39.6% | +11.5% |
| 16 | 2022-12-20 → 2023-12-19 | 251 | +23.5% | +22.9% | +0.7 pp | Additions | +11.9% | +16.6% |
| 17 | 2023-12-19 → 2024-12-17 | 251 | +8.5% | +2.4% | +6.1 pp | Additions | +12.3% | +9.7% |
| 18 | 2024-12-24 → 2025-12-23 | 250 | +27.1% | -6.9% | +34.0 pp | Additions | +17.0% | -13.6% |
Paired Sharpe of the difference track: -0.28 · block bootstrap (2000 paths, block 10, seed 1234): P(Additions beats Deletions) = 11.8%.
Window win-rate. Additions led 7 of 18 windows (38.9%), Deletions led 11, and the mean window gap of -9.21 pp points the same way. Widest single window: 2008 at -123.9 pp.
| Period | Windows | Additions | Deletions | Mean gap | Additions led |
|---|---|---|---|---|---|
| All windows | 18 | +12.52% | +21.73% | -9.21 pp | 7/18 |
| Before 2016 | 9 | +7.28% | +33.94% | -26.66 pp | 1/9 |
| 2016 onward | 9 | +17.76% | +9.52% | +8.24 pp | 6/9 |
The two eras disagree by 34.90 pp. The pooled figure is therefore not a standing property of either method, it is dominated by the earlier period. Read the two rows, not the average.
3 The circuit
The strategy is a circuit of platform primitives, frozen when the study is registered. Below is the circuit as wired on the canvas, the objective it encodes and how the search runs through it, followed by the mathematics each primitive actually computes, the same formulas the execution engine runs. The complete parameterisation is preserved in the study ledger (Appendix A).
The sentence below is the registration record, generated when the circuit was registered and printed verbatim; the authored description of the design is Section 1.
A COMPARATIVE study: Additions vs Deletions, walked on the same registered out-of-sample windows. Additions: A configured universe, held as a buy-and-hold basket, and run out-of-sample from the anchor: whatever the design estimates from history is re-estimated at each anchor from pre-anchor data only, and the walk advances through registered out-of-sample windows; its disposition is the realized forward path versus the benchmark. Deletions: A configured universe, held as a buy-and-hold basket, and run out-of-sample from the anchor: whatever the design estimates from history is re-estimated at each anchor from pre-anchor data only, and the walk advances through registered out-of-sample windows; its disposition is the realized forward path versus the benchmark. The arms differ in: Index Event Basket, event: additions → deletions. The contrast under test: whether Additions generates better risk-adjusted returns than Deletions over the identical out-of-sample windows.
Envelopes show counts, ratios, dates, and the parameters the author chose. Full price and per-name data series are not republished: the underlying market data is licensed to QuanterLab. Point figures quoted in the prose, a named holding's return over a stated span, are summary facts derived from public market prices, not redistributed series.
The objective and the search
Additions
| Universe | No explicit universe defined. |
|---|---|
| Validation & out-of-sample | portfolio forward test (buy-and-hold book) (1y horizon from the anchor, held (no rebalance)); overlays: Transaction Cost. |
Deletions
The specification is identical to Additions's table above, row for row; the one registered difference between the arms is itemized below.
What differs between the arms, one difference; the comparison is clean:
- paramIndex Event Basket, event: additions → deletions
Companion book. Additions, announcement timing comes from a companion run of the identical configuration on its own registered anchor schedule. Its results run through this paper's tables under its own name.
Companion book. Deletions, announcement timing comes from a companion run whose one change against this study's Additions arm is Index Event Basket, event: additions → deletions. Its results run through this paper's tables under its own name.
Everything else is held identical, so an out-of-sample gap between the arms is attributable to this one change.
Cost elements are wired into the circuit, the realised drag is reported per step in Appendix B.
Show the mathematics, 3 primitives, formulas and parity notes
3.1 Portfolio Backtest
Replay the portfolio forward, rebalanced, point-in-time, with costs.
Holds the basket and rebalances on schedule, re-selecting and re-optimizing point-in-time at each rebalance (so it only ever uses information available then), and reports the equity curve, Sharpe, drawdown and trade stats, optionally net of cost and risk overlays.
E_t = E_{t-1}\big(1 + \mathbf w_{t}^{\top}\mathbf r_t - \text{costs}_t\big)\text{DD}_t = \frac{E_t}{\max_{\tau\le t}E_\tau} - 1, \qquad \text{MaxDD} = \min_t \text{DD}_t\text{charge}_t \;=\; \text{loan}_t \cdot \frac{\text{spread}}{252}, \qquad \text{loan}_t = \begin{cases}\max(0,\,-\text{cash}_t) & \text{institutional (netted)}\\ \max(0,\,\text{long MV}_t - E_t) & \text{retail (no netting)}\end{cases}\mathbf w_k = \{\, w_{k,i} : i \in \text{held} \,\}, \qquad \text{cash}_k = 1 - \textstyle\sum_{i \in \text{held}} w_{k,i}3.2 Transaction Cost
Charge for trading, slippage + commission on every turn.
Real trading isn't free. This deducts a cost proportional to how much you trade (turnover), in basis points, so the backtest reflects net, not gross, performance.
\text{cost}_t = \frac{\text{bps}}{10{,}000}\;\times\;\text{turnover}_t, \qquad \text{turnover}_t = \tfrac12\sum_i \lvert w_{i,t}-w_{i,t^-}\rvert3.3 Portfolio Forward Autopsy
The post-mortem, where the forward test’s return actually came from.
Runs after the Portfolio Forward Test and dissects its realized path: per-rebalance contributions, winners and losers, exposure and cash periods, and how the realized route compares to what the risk cones projected. It computes nothing new about the future, it explains the past the book just lived.
Depth I–IV: headline attribution, per-segment breakdown, per-name contributions, and the calibration ledger (projected cone vs realized, segment by segment). In a study, this is the node that fills the appendices.
4 Projection calibration, pooled across the walk
Every rebalance carried a Monte Carlo cone and a 95% VaR estimated before the segment it is scored against. Two questions, pooled over the whole study: did realized outcomes land inside the band as often as the band claims, and were VaR breaches as frequent as 5%?
This section is produced by the forward tester itself: every portfolio backtest fits the cone and the VaR estimate at each rebalance and scores them against the segment that followed. It does not require, and this circuit does not contain, a Monte Carlo primitive; that primitive is a separate, standalone analysis.
| Arm | Steps | Rebalances | In band | Coverage | Expected | VaR days | Breach rate | Expected |
|---|---|---|---|---|---|---|---|---|
| Additions | 18 | 36 | 29 / 36 | 80.6% ±6.6 | 90.0% | 4418 | 6.77% ±0.378 | 5.0% |
| Deletions | 18 | 36 | 32 / 36 | 88.9% ±5.24 | 90.0% | 4512 | 4.3% ±0.302 | 5.0% |
| Additions, announcement timing (companion run) | 18 | 36 | 29 / 36 | 80.6% ±6.6 | 90.0% | 4413 | 6.78% ±0.378 | 5.0% |
| Deletions, announcement timing (companion run) | 18 | 36 | 32 / 36 | 88.9% ±5.24 | 90.0% | 4512 | 4.23% ±0.3 | 5.0% |
Note. The projection bands here are estimated from each basket's own trailing two years, and these baskets hold three to seven names, so the bands are extremely wide and inherit whatever those two years did; a cone whose fifth percentile sits above zero after a recovery year is the estimator, not the market. Single-window VaR breach rates near twenty percent are the same small-book arithmetic. The displacement runs one way, so the coverage figures above are a floor, and no claim in the paper rests on this section.
± values are binomial standard errors on the estimate. A coverage figure below the expected band means the projection was over-confident; a breach rate above 5% means the same of the risk model. Both forecasts used only data prior to the segment scored.
5 Discussion
5.1 Interpretation
A NASDAQ-100 deletion was not an opinion about a business. It was an arithmetic consequence of a ranking: the index holds the hundred largest, so the stocks that left were, almost by construction, the ones whose prices had already fallen furthest, and the stocks that arrived were the ones whose prices had already risen most. The December machine was a rule for selling last year's losers to buy last year's winners, executed once a year, in public, on a printed calendar.
Arnott, Kalesnik and Wu (2018) argued that this is what capitalization-weighted indexing quietly does everywhere. The NASDAQ-100 through 2024 was the cleanest possible place to watch it, because there was no committee judgment to argue about, only arithmetic and a calendar. And watched over eighteen years, the record says two things at once.
First, the reversal Arnott's line of work predicts was there, and it was enormous, while it lasted. Through 2015, buying the December castoffs beat buying the December darlings by 26.6 points a window, and beat the index itself by 18.7. Second, it faded. From 2016 the castoffs stopped recovering, the darlings stopped underperforming them, and the contrast settled into noise with a mild lean the other way. The literature's announcement-day effect and this record's one-year effect decayed on the same clock, which is at least consistent with one cause: a trade that became famous, crowded, and then gone.
What survives every cut is duller and still worth money: at either timing, in either era, the newly included stocks were not the free ride their headlines suggested, lagging the capitalization-weighted index they had just joined by about eight points a window, though against an equal-weight ruler most of that is weighting rather than the event. An investor who greeted each December class with a year of patience gave up nothing measurable at any point in the record.
In May 2026 the December machine lost its monopoly: membership now also moves at quarterly reviews, and a fast-entry lane admits qualifying companies between them. Whether spreading the same arithmetic across smaller, more frequent events revives the premium or buries it deeper is a question someone can ask in fifteen years. The single-channel record is closed, and this is what it says.
No search record exists for this study: the design was not promoted from a recorded evolving search, so the number of alternatives tried before it is UNKNOWN, which is a different fact from one. No count of alternatives tried is claimed, and nothing is corrected for a search that was never recorded; the number that stands is the raw out-of-sample result plus this disclosure. The out-of-sample windows are historical.
5.2 Limitations
Small books are loud. The yearly classes run three to eleven names, so single stocks decide single windows, and both eras' summaries are fragile to their largest years: the pre-2016 gap leans on 2008, the post-2016 lean on 2018. The leave-one-out figure and the era table exist so that dependence is visible rather than smoothed away, and the window-level sign test, not the daily bootstrap, is the statistic this paper stands on.
The registered contrast is additions against deletions. Every statement against an index is descriptive, and the choice of ruler matters: the books are equal-weight, QQQ is capitalization-weighted, and the equal-weight tracker QQQE only exists from 2012, so the first five windows have no like-for-like index reading at all.
Twenty-nine of 243 slots could not be held, and the direction of that bias is not determinable: the unpriceable deletions include premium acquisition exits and outright collapses. Ticker recycling is a further vendor hazard the audit found once, BBBY, and refused; renamed tickers such as Monster's cost two early addition slots for the opposite reason, the old symbol no longer resolving at the old date. The two timings collect events by the same twelve-day rule around different anchors, so their books can differ at the edges; one 2011 addition enters the announcement study only. Share-class additions, Comcast's and Liberty's K shares among them, are kept, because excluding them would be a choice, and are named in the record.
The projection bands in the calibration section are estimated from each book's own trailing two years, and on three-to-seven-name books they are grotesquely wide and displaced by whatever those two years did; single-window VaR breach rates near twenty percent are the same small-book arithmetic. No claim in this paper rests on them, and the note under the calibration table says the same where the reader meets it.
Costs are charged on the books and not on the index, the standard convention. Anchor dates are rule-derived and checked against press releases; the vendor's own date field could not be used for timing. Eighteen windows are eighteen observations of an annual event, the regime that produced them no longer runs alone, and the effect this record measures was already dying inside it.
References
- Arnott, R., Kalesnik, V. and Wu, L. (2018). Buy High and Sell Low with Index Funds! Research Affiliates.
- Shleifer, A. (1986). Do Demand Curves for Stocks Slope Down? Journal of Finance 41(3), 579-590.
- Harris, L. and Gurel, E. (1986). Price and Volume Effects Associated with Changes in the S&P 500 List. Journal of Finance 41(4), 815-829.
- Chen, H., Noronha, G. and Singal, V. (2004). The Price Response to S&P 500 Index Additions and Deletions: Evidence of Asymmetry and a New Explanation. Journal of Finance 59(4), 1901-1929.
- Greenwood, R. and Sammon, M. (2025). The Disappearing Index Effect. Journal of Finance 80(2), 657-698.
- Biktimirov, E. N. and Xu, Y. (2019). Asymmetric stock price and investor awareness reactions to changes in the Nasdaq 100 index. Journal of Asset Management 20(2), 134-145.
- Nasdaq (2026). Nasdaq-100 Index Methodology and the February 2026 consultation on reconstitution changes, effective May 2026. Nasdaq Global Indexes.
Appendix A Reproducibility in QuanterLab
Each step is backed by a frozen run report. The study is re-derivable from the ledger below.
| # | Commit | Report | Anchor | OOS window |
|---|---|---|---|---|
| 1 | 476188644296 | 1632 | 2007-12-24 | 2007-12-24 → 2008-12-23 |
| 2 | cce5fff72bbb | 1633 | 2008-12-22 | 2008-12-22 → 2009-12-22 |
| 3 | 8eb4de4d5234 | 1634 | 2009-12-21 | 2009-12-21 → 2010-12-21 |
| 4 | 72cdc54e34fe | 1635 | 2010-12-20 | 2010-12-20 → 2011-12-20 |
| 5 | 2aa31760def5 | 1636 | 2011-12-19 | 2011-12-19 → 2012-12-18 |
| 6 | 841ef77be818 | 1637 | 2012-12-24 | 2012-12-24 → 2013-12-24 |
| 7 | 02fe6c9580f9 | 1638 | 2013-12-23 | 2013-12-23 → 2014-12-23 |
| 8 | 05041e56de5f | 1639 | 2014-12-22 | 2014-12-22 → 2015-12-22 |
| 9 | 0136ab8062a6 | 1640 | 2015-12-21 | 2015-12-21 → 2016-12-20 |
| 10 | 19285ed51ad5 | 1641 | 2016-12-19 | 2016-12-19 → 2017-12-19 |
| 11 | 2dccb9ba5316 | 1642 | 2017-12-18 | 2017-12-18 → 2018-12-18 |
| 12 | efc3488fc7bb | 1643 | 2018-12-24 | 2018-12-24 → 2019-12-24 |
| 13 | d6ea4643529b | 1644 | 2019-12-23 | 2019-12-23 → 2020-12-22 |
| 14 | 9f3ed920b55d | 1645 | 2020-12-21 | 2020-12-21 → 2021-12-21 |
| 15 | 2a98baf58d38 | 1646 | 2021-12-20 | 2021-12-20 → 2022-12-20 |
| 16 | 23b2425b1479 | 1647 | 2022-12-19 | 2022-12-19 → 2023-12-19 |
| 17 | 24cfe444144a | 1648 | 2023-12-18 | 2023-12-18 → 2024-12-17 |
| 18 | b5100fdb0055 | 1649 | 2024-12-23 | 2024-12-23 → 2025-12-23 |
The methods the platform implements, for every study made on it, rest on these works.
- Gelman, A., & Loken, E. (2013). The garden of forking paths: Why multiple comparisons can be a problem, even when there is no “fishing expedition.” Working paper, Columbia University.
- Harvey, C. R., Liu, Y., & Zhu, H. (2016). … and the Cross-Section of Expected Returns. Review of Financial Studies, 29(1), 5–68. doi:10.1093/rfs/hhv059
- Lo, A. W. (2002). The Statistics of Sharpe Ratios. Financial Analysts Journal, 58(4), 36–52. doi:10.2469/faj.v58.n4.2453
Appendix A2 Registration record
What this record does and does not establish. Every window in this study is historical: the data existed before the study began, so this is sequential registration on past windows, not pre-registration in the clinical-trial sense, and no procedure could make it so. What the platform does enforce is order, each step's specification was frozen and hashed before that step was scored, and the walk cannot advance past a step that was never run or close one with a result registered for a different window. The two timestamp columns below are the evidence: read them together and each registration precedes its own run, and each run precedes the next registration. A study whose registrations all post-date its runs would show it here. Wall-clock spacing between registrations varies with the author's schedule and queue latency; the ordering, not the tempo, is the claim.
“A COMPARATIVE study: Additions vs Deletions, walked on the same registered out-of-sample windows. Additions: A configured universe, held as a buy-and-hold basket, and run out-of-sample from the anchor: whatever the design estimates from history is re-estimated at each anchor from pre-anchor data only, and the walk advances through registered out-of-sample windows; its disposition is the realized forward path versus the benchmark. Deletions: A configured universe, held as a buy-and-hold basket, and run out-of-sample from the anchor: whatever the design estimates from history is re-estimated at each anchor from pre-anchor data only, and the walk advances through registered out-of-sample windows; its disposition is the realized forward path versus the benchmark. The arms differ in: Index Event Basket, event: additions → deletions. The contrast under test: whether Additions generates better risk-adjusted returns than Deletions over the identical out-of-sample windows.”
The same hypothesis was registered independently at every step, hashed before each step's out-of-sample window was scored:
| # | Anchor | Registered at (UTC) | Run completed (UTC) |
|---|---|---|---|
| 1 | 2007-12-24 | 2026-08-26 17:30:41 | 2026-08-26 17:31:14 |
| 2 | 2008-12-22 | 2026-08-26 17:31:16 | 2026-08-26 17:31:36 |
| 3 | 2009-12-21 | 2026-08-26 17:31:38 | 2026-08-26 17:31:48 |
| 4 | 2010-12-20 | 2026-08-26 17:31:50 | 2026-08-26 17:32:00 |
| 5 | 2011-12-19 | 2026-08-26 17:32:03 | 2026-08-26 17:32:13 |
| 6 | 2012-12-24 | 2026-08-26 17:32:15 | 2026-08-26 17:32:35 |
| 7 | 2013-12-23 | 2026-08-26 17:32:37 | 2026-08-26 17:32:47 |
| 8 | 2014-12-22 | 2026-08-26 17:32:49 | 2026-08-26 17:32:59 |
| 9 | 2015-12-21 | 2026-08-26 17:33:01 | 2026-08-26 17:33:21 |
| 10 | 2016-12-19 | 2026-08-26 17:33:23 | 2026-08-26 17:33:34 |
| 11 | 2017-12-18 | 2026-08-26 17:33:36 | 2026-08-26 17:33:46 |
| 12 | 2018-12-24 | 2026-08-26 17:33:48 | 2026-08-26 17:33:58 |
| 13 | 2019-12-23 | 2026-08-26 17:34:00 | 2026-08-26 17:34:10 |
| 14 | 2020-12-21 | 2026-08-26 17:34:12 | 2026-08-26 17:34:22 |
| 15 | 2021-12-20 | 2026-08-26 17:34:24 | 2026-08-26 17:34:34 |
| 16 | 2022-12-19 | 2026-08-26 17:34:37 | 2026-08-26 17:34:47 |
| 17 | 2023-12-18 | 2026-08-26 17:34:49 | 2026-08-26 17:34:59 |
| 18 | 2024-12-23 | 2026-08-26 17:35:01 | 2026-08-26 17:35:11 |
Appendix B Per-step diagnostics
Realized in the projection tables below is the risk engine scoring its own forecast: the buy-and-hold return of the segment that followed each rebalance, on the same gross basis the cone was projected on. It is deliberately not the charged, calendar-window total return the study’s tables print, so the two will not reconcile line by line; the cone and its outcome share one basis, which is what a calibration test requires. Each row names its segment’s span so a boundary session is visible.
Names held is the union across the window: the count of distinct instruments the book touched between the window’s first and last session, not the number it held at one time. A book that rotates monthly touches more names than it holds.
What each step's run actually did beyond its return: the portfolio book's rebalancing and cost drag. Harvested from the frozen run reports, present where the circuit produced them. Cost drag is the gap between the step's return before and after its trading costs, in percentage points of the step's starting capital, so on a book that trades every session and compounds it can exceed the step's own net return.
Open the full per-step grid (18 steps: every rebalance, per window)
Step 1 · 2007-12-24 → 2008-12-23
Additions
Portfolio book, rebalanced annual · 2 constructions · 4 names held · selection: hold · 0.0% in cash · turnover 1.0× · cost drag 0.1% · 1 name dropped at load (5 selected, 4 held across the window), weights renormalised onto the rest
Projection accuracy, realized outcome fell inside the P5–P95 cone in 50.0% of 2 scored rebalances (a well-calibrated 90% band contains ~90.0%) · 95% VaR breached on 20.32% of 251 days (expected ~5.0%)
| Rebalance | P5 | Median | P95 | Realized | In band | VaR 95 (1d) | Breaches |
|---|---|---|---|---|---|---|---|
| 2007-12-24 → 2008-01-01 | -4.4283% | 1.0904% | 6.8227% | -3.5607% | yes | 2.6339% | 0 / 4 |
| 2008-01-01 → window end | 7.9578% | 65.8089% | 153.7624% | -38.1842% | no | 2.587% | 51 / 247 |
Deletions
Portfolio book, rebalanced annual · 2 constructions · 3 names held · selection: hold · 0.0% in cash · turnover 1.0× · cost drag 0.1% · 2 names dropped at load (5 selected, 3 held across the window), weights renormalised onto the rest
Projection accuracy, realized outcome fell inside the P5–P95 cone in 100.0% of 2 scored rebalances (a well-calibrated 90% band contains ~90.0%) · 95% VaR breached on 16.73% of 251 days (expected ~5.0%)
| Rebalance | P5 | Median | P95 | Realized | In band | VaR 95 (1d) | Breaches |
|---|---|---|---|---|---|---|---|
| 2007-12-24 → 2008-01-01 | -4.7337% | -0.026% | 4.8258% | -1.4341% | yes | 2.4725% | 0 / 4 |
| 2008-01-01 → window end | -39.7241% | -12.4281% | 26.8382% | -22.403% | yes | 2.4782% | 42 / 247 |
Step 2 · 2008-12-22 → 2009-12-22
Additions
Portfolio book, rebalanced annual · 2 constructions · 8 names held · selection: hold · 0.0% in cash · turnover 1.0× · cost drag 0.1% · 3 names dropped at load (11 selected, 8 held across the window), weights renormalised onto the rest
Projection accuracy, realized outcome fell inside the P5–P95 cone in 100.0% of 2 scored rebalances (a well-calibrated 90% band contains ~90.0%) · 95% VaR breached on 1.59% of 251 days (expected ~5.0%)
| Rebalance | P5 | Median | P95 | Realized | In band | VaR 95 (1d) | Breaches |
|---|---|---|---|---|---|---|---|
| 2008-12-22 → 2009-01-01 | -8.1118% | 0.1785% | 10.0075% | 3.3223% | yes | 3.7774% | 0 / 6 |
| 2009-01-01 → window end | -34.5027% | 17.7985% | 114.796% | 37.6007% | yes | 3.7087% | 4 / 245 |
Deletions
Portfolio book, rebalanced annual · 2 constructions · 5 names held · selection: hold · 0.0% in cash · turnover 1.0× · cost drag 0.1% · 6 names dropped at load (11 selected, 5 held across the window), weights renormalised onto the rest
Projection accuracy, realized outcome fell inside the P5–P95 cone in 50.0% of 2 scored rebalances (a well-calibrated 90% band contains ~90.0%) · 95% VaR breached on 6.37% of 251 days (expected ~5.0%)
| Rebalance | P5 | Median | P95 | Realized | In band | VaR 95 (1d) | Breaches |
|---|---|---|---|---|---|---|---|
| 2008-12-22 → 2009-01-01 | -12.378% | -2.0008% | 10.6345% | 2.1625% | yes | 4.3895% | 0 / 6 |
| 2009-01-01 → window end | -77.4831% | -51.5122% | 6.306% | 205.8081% | no | 4.3921% | 16 / 245 |
Step 3 · 2009-12-21 → 2010-12-21
Additions
Portfolio book, rebalanced annual · 2 constructions · 4 names held · selection: hold · 0.0% in cash · turnover 1.0× · cost drag 0.1% · 3 names dropped at load (7 selected, 4 held across the window), weights renormalised onto the rest
Projection accuracy, realized outcome fell inside the P5–P95 cone in 100.0% of 2 scored rebalances (a well-calibrated 90% band contains ~90.0%) · 95% VaR breached on 1.2% of 251 days (expected ~5.0%)
| Rebalance | P5 | Median | P95 | Realized | In band | VaR 95 (1d) | Breaches |
|---|---|---|---|---|---|---|---|
| 2009-12-21 → 2010-01-01 | -7.9114% | -0.0915% | 9.2327% | 0.0155% | yes | 3.1274% | 0 / 7 |
| 2010-01-01 → window end | -40.1696% | 1.2069% | 66.1895% | 10.634% | yes | 3.1443% | 3 / 244 |
Deletions
Portfolio book, rebalanced annual · 2 constructions · 6 names held · selection: hold · 0.0% in cash · turnover 1.0× · cost drag 0.1% · 1 name dropped at load (7 selected, 6 held across the window), weights renormalised onto the rest
Projection accuracy, realized outcome fell inside the P5–P95 cone in 100.0% of 2 scored rebalances (a well-calibrated 90% band contains ~90.0%) · 95% VaR breached on 0.0% of 251 days (expected ~5.0%)
| Rebalance | P5 | Median | P95 | Realized | In band | VaR 95 (1d) | Breaches |
|---|---|---|---|---|---|---|---|
| 2009-12-21 → 2010-01-01 | -11.1787% | -0.4799% | 12.7155% | 1.5994% | yes | 4.6021% | 0 / 7 |
| 2010-01-01 → window end | -56.6231% | -9.6382% | 80.596% | 40.6451% | yes | 4.6041% | 0 / 244 |
Step 4 · 2010-12-20 → 2011-12-20
Additions
Portfolio book, rebalanced annual · 2 constructions · 5 names held · selection: hold · 0.0% in cash · turnover 0.8× · cost drag 0.08%
Projection accuracy, realized outcome fell inside the P5–P95 cone in 50.0% of 2 scored rebalances (a well-calibrated 90% band contains ~90.0%) · 95% VaR breached on 6.33% of 158 days (expected ~5.0%)
| Rebalance | P5 | Median | P95 | Realized | In band | VaR 95 (1d) | Breaches |
|---|---|---|---|---|---|---|---|
| 2010-12-20 → 2011-01-01 | -9.25% | 1.7717% | 13.9777% | 0.0% | yes | 3.8332% | |
| 2011-01-01 → window end | -2.0606% | 81.2423% | 223.9394% | -27.7255% | no | 3.6117% | 10 / 158 |
Deletions
Portfolio book, rebalanced annual · 2 constructions · 5 names held · selection: hold · 0.0% in cash · turnover 1.0× · cost drag 0.1% · 1 name dropped at load (6 selected, 5 held across the window), weights renormalised onto the rest
Projection accuracy, realized outcome fell inside the P5–P95 cone in 100.0% of 2 scored rebalances (a well-calibrated 90% band contains ~90.0%) · 95% VaR breached on 2.78% of 252 days (expected ~5.0%)
| Rebalance | P5 | Median | P95 | Realized | In band | VaR 95 (1d) | Breaches |
|---|---|---|---|---|---|---|---|
| 2010-12-20 → 2011-01-01 | -9.5668% | 0.3085% | 11.1262% | 0.9404% | yes | 3.8462% | 0 / 8 |
| 2011-01-01 → window end | -31.3549% | 20.7083% | 105.5981% | -9.9696% | yes | 3.7465% | 7 / 244 |
Step 5 · 2011-12-19 → 2012-12-18
Additions
Portfolio book, rebalanced annual · 2 constructions · 3 names held · selection: hold · 0.0% in cash · turnover 1.0× · cost drag 0.1% · 2 names dropped at load (5 selected, 3 held across the window), weights renormalised onto the rest
Projection accuracy, realized outcome fell inside the P5–P95 cone in 100.0% of 2 scored rebalances (a well-calibrated 90% band contains ~90.0%) · 95% VaR breached on 4.82% of 249 days (expected ~5.0%)
| Rebalance | P5 | Median | P95 | Realized | In band | VaR 95 (1d) | Breaches |
|---|---|---|---|---|---|---|---|
| 2011-12-19 → 2012-01-01 | -8.0435% | 0.8619% | 10.5092% | 2.7978% | yes | 2.866% | 1 / 8 |
| 2012-01-01 → window end | -12.745% | 46.8169% | 141.948% | 13.1005% | yes | 2.8671% | 11 / 241 |
Deletions
Portfolio book, rebalanced annual · 2 constructions · 5 names held · selection: hold · 0.0% in cash · turnover 1.0× · cost drag 0.1%
Projection accuracy, realized outcome fell inside the P5–P95 cone in 100.0% of 2 scored rebalances (a well-calibrated 90% band contains ~90.0%) · 95% VaR breached on 2.01% of 249 days (expected ~5.0%)
| Rebalance | P5 | Median | P95 | Realized | In band | VaR 95 (1d) | Breaches |
|---|---|---|---|---|---|---|---|
| 2011-12-19 → 2012-01-01 | -8.0293% | -0.6001% | 7.3308% | 7.0355% | yes | 2.8473% | 0 / 8 |
| 2012-01-01 → window end | -38.2143% | -4.8735% | 43.952% | 2.1303% | yes | 2.8339% | 5 / 241 |
Step 6 · 2012-12-24 → 2013-12-24
Additions
Portfolio book, rebalanced annual · 2 constructions · 9 names held · selection: hold · 0.0% in cash · turnover 1.0× · cost drag 0.1% · 2 names dropped at load (11 selected, 9 held across the window), weights renormalised onto the rest
Projection accuracy, realized outcome fell inside the P5–P95 cone in 100.0% of 2 scored rebalances (a well-calibrated 90% band contains ~90.0%) · 95% VaR breached on 1.99% of 251 days (expected ~5.0%)
| Rebalance | P5 | Median | P95 | Realized | In band | VaR 95 (1d) | Breaches |
|---|---|---|---|---|---|---|---|
| 2012-12-24 → 2013-01-01 | -3.6107% | 0.689% | 5.1002% | 0.3688% | yes | 1.9809% | 0 / 4 |
| 2013-01-01 → window end | -0.624% | 39.7692% | 96.0297% | 39.27% | yes | 1.9842% | 5 / 247 |
Deletions
Portfolio book, rebalanced annual · 2 constructions · 10 names held · selection: hold · 0.0% in cash · turnover 1.0× · cost drag 0.1% · 1 name dropped at load (11 selected, 10 held across the window), weights renormalised onto the rest
Projection accuracy, realized outcome fell inside the P5–P95 cone in 50.0% of 2 scored rebalances (a well-calibrated 90% band contains ~90.0%) · 95% VaR breached on 0.0% of 251 days (expected ~5.0%)
| Rebalance | P5 | Median | P95 | Realized | In band | VaR 95 (1d) | Breaches |
|---|---|---|---|---|---|---|---|
| 2012-12-24 → 2013-01-01 | -5.7353% | 0.0206% | 6.018% | 0.7381% | yes | 2.892% | 0 / 4 |
| 2013-01-01 → window end | -43.6745% | -10.5037% | 41.6605% | 61.5788% | no | 2.8926% | 0 / 247 |
Step 7 · 2013-12-23 → 2014-12-23
Additions
Portfolio book, rebalanced annual · 2 constructions · 5 names held · selection: hold · 0.0% in cash · turnover 1.0× · cost drag 0.1%
Projection accuracy, realized outcome fell inside the P5–P95 cone in 100.0% of 2 scored rebalances (a well-calibrated 90% band contains ~90.0%) · 95% VaR breached on 7.97% of 251 days (expected ~5.0%)
| Rebalance | P5 | Median | P95 | Realized | In band | VaR 95 (1d) | Breaches |
|---|---|---|---|---|---|---|---|
| 2013-12-23 → 2014-01-01 | -3.9873% | 1.1145% | 6.5145% | 1.6923% | yes | 2.0779% | 0 / 5 |
| 2014-01-01 → window end | 17.1703% | 69.4778% | 139.5659% | 32.0987% | yes | 2.0736% | 20 / 246 |
Deletions
Portfolio book, rebalanced annual · 2 constructions · 4 names held · selection: hold · 0.0% in cash · turnover 1.0× · cost drag 0.1% · 1 name dropped at load (5 selected, 4 held across the window), weights renormalised onto the rest
Projection accuracy, realized outcome fell inside the P5–P95 cone in 100.0% of 2 scored rebalances (a well-calibrated 90% band contains ~90.0%) · 95% VaR breached on 2.79% of 251 days (expected ~5.0%)
| Rebalance | P5 | Median | P95 | Realized | In band | VaR 95 (1d) | Breaches |
|---|---|---|---|---|---|---|---|
| 2013-12-23 → 2014-01-01 | -5.37% | 0.2214% | 6.173% | 0.0015% | yes | 2.2585% | 0 / 5 |
| 2014-01-01 → window end | -28.2737% | 6.8713% | 55.3308% | 2.3387% | yes | 2.1691% | 7 / 246 |
Step 8 · 2014-12-22 → 2015-12-22
Additions
Portfolio book, rebalanced annual · 2 constructions · 6 names held · selection: hold · 0.0% in cash · turnover 1.0× · cost drag 0.1% · 2 names dropped at load (8 selected, 6 held across the window), weights renormalised onto the rest
Projection accuracy, realized outcome fell inside the P5–P95 cone in 50.0% of 2 scored rebalances (a well-calibrated 90% band contains ~90.0%) · 95% VaR breached on 7.17% of 251 days (expected ~5.0%)
| Rebalance | P5 | Median | P95 | Realized | In band | VaR 95 (1d) | Breaches |
|---|---|---|---|---|---|---|---|
| 2014-12-22 → 2015-01-01 | -3.3595% | 0.9255% | 5.783% | -0.4462% | yes | 1.7293% | 0 / 6 |
| 2015-01-01 → window end | 12.2317% | 50.3752% | 102.8675% | -6.6125% | no | 1.7293% | 18 / 245 |
Deletions
Portfolio book, rebalanced annual · 2 constructions · 3 names held · selection: hold · 0.0% in cash · turnover 1.0× · cost drag 0.1%
Projection accuracy, realized outcome fell inside the P5–P95 cone in 100.0% of 2 scored rebalances (a well-calibrated 90% band contains ~90.0%) · 95% VaR breached on 5.98% of 251 days (expected ~5.0%)
| Rebalance | P5 | Median | P95 | Realized | In band | VaR 95 (1d) | Breaches |
|---|---|---|---|---|---|---|---|
| 2014-12-22 → 2015-01-01 | -4.9465% | 0.3155% | 6.3463% | -1.9514% | yes | 2.061% | 0 / 6 |
| 2015-01-01 → window end | -17.4526% | 17.8244% | 69.5845% | 12.1447% | yes | 1.9955% | 15 / 245 |
Step 9 · 2015-12-21 → 2016-12-20
Additions
Portfolio book, rebalanced annual · 2 constructions · 9 names held · selection: hold · 0.0% in cash · turnover 1.0× · cost drag 0.1% · 1 name dropped at load (10 selected, 9 held across the window), weights renormalised onto the rest
Projection accuracy, realized outcome fell inside the P5–P95 cone in 50.0% of 2 scored rebalances (a well-calibrated 90% band contains ~90.0%) · 95% VaR breached on 7.17% of 251 days (expected ~5.0%)
| Rebalance | P5 | Median | P95 | Realized | In band | VaR 95 (1d) | Breaches |
|---|---|---|---|---|---|---|---|
| 2015-12-21 → 2016-01-01 | -4.3634% | 0.5973% | 6.3233% | 0.4095% | yes | 2.021% | 0 / 7 |
| 2016-01-01 → window end | -8.691% | 26.3574% | 71.6796% | -15.0088% | no | 1.999% | 18 / 244 |
Deletions
Portfolio book, rebalanced annual · 2 constructions · 9 names held · selection: hold · 0.0% in cash · turnover 1.0× · cost drag 0.1% · 1 name dropped at load (10 selected, 9 held across the window), weights renormalised onto the rest
Projection accuracy, realized outcome fell inside the P5–P95 cone in 100.0% of 2 scored rebalances (a well-calibrated 90% band contains ~90.0%) · 95% VaR breached on 3.19% of 251 days (expected ~5.0%)
| Rebalance | P5 | Median | P95 | Realized | In band | VaR 95 (1d) | Breaches |
|---|---|---|---|---|---|---|---|
| 2015-12-21 → 2016-01-01 | -5.3736% | -0.4578% | 5.2169% | 1.7082% | yes | 2.2119% | 0 / 7 |
| 2016-01-01 → window end | -36.5385% | -12.0067% | 19.7765% | 3.42% | yes | 2.2142% | 8 / 244 |
Step 10 · 2016-12-19 → 2017-12-19
Additions
Portfolio book, rebalanced annual · 2 constructions · 4 names held · selection: hold · 0.0% in cash · turnover 1.0× · cost drag 0.1%
Projection accuracy, realized outcome fell inside the P5–P95 cone in 100.0% of 2 scored rebalances (a well-calibrated 90% band contains ~90.0%) · 95% VaR breached on 3.98% of 251 days (expected ~5.0%)
| Rebalance | P5 | Median | P95 | Realized | In band | VaR 95 (1d) | Breaches |
|---|---|---|---|---|---|---|---|
| 2016-12-19 → 2017-01-01 | -4.2694% | 0.5921% | 5.6388% | -1.7756% | yes | 1.8001% | 0 / 8 |
| 2017-01-01 → window end | -8.0548% | 21.0054% | 58.5148% | 26.435% | yes | 1.8003% | 10 / 243 |
Deletions
Portfolio book, rebalanced annual · 2 constructions · 3 names held · selection: hold · 0.0% in cash · turnover 1.0× · cost drag 0.1% · 1 name dropped at load (4 selected, 3 held across the window), weights renormalised onto the rest
Projection accuracy, realized outcome fell inside the P5–P95 cone in 50.0% of 2 scored rebalances (a well-calibrated 90% band contains ~90.0%) · 95% VaR breached on 1.99% of 251 days (expected ~5.0%)
| Rebalance | P5 | Median | P95 | Realized | In band | VaR 95 (1d) | Breaches |
|---|---|---|---|---|---|---|---|
| 2016-12-19 → 2017-01-01 | -5.7964% | -0.3663% | 5.3072% | -3.1024% | yes | 1.7291% | 0 / 8 |
| 2017-01-01 → window end | -34.4252% | -10.5562% | 21.3645% | 28.2878% | no | 1.7301% | 5 / 243 |
Step 11 · 2017-12-18 → 2018-12-18
Additions
Portfolio book, rebalanced annual · 2 constructions · 6 names held · selection: hold · 0.0% in cash · turnover 1.0× · cost drag 0.1%
Projection accuracy, realized outcome fell inside the P5–P95 cone in 100.0% of 2 scored rebalances (a well-calibrated 90% band contains ~90.0%) · 95% VaR breached on 9.2% of 250 days (expected ~5.0%)
| Rebalance | P5 | Median | P95 | Realized | In band | VaR 95 (1d) | Breaches |
|---|---|---|---|---|---|---|---|
| 2017-12-18 → 2018-01-01 | -4.325% | 0.7534% | 6.0367% | -1.1637% | yes | 1.9641% | 0 / 8 |
| 2018-01-01 → window end | -5.1131% | 26.4921% | 66.5017% | 9.7549% | yes | 1.966% | 23 / 242 |
Deletions
Portfolio book, rebalanced annual · 2 constructions · 6 names held · selection: hold · 0.0% in cash · turnover 1.0× · cost drag 0.1%
Projection accuracy, realized outcome fell inside the P5–P95 cone in 100.0% of 2 scored rebalances (a well-calibrated 90% band contains ~90.0%) · 95% VaR breached on 2.8% of 250 days (expected ~5.0%)
| Rebalance | P5 | Median | P95 | Realized | In band | VaR 95 (1d) | Breaches |
|---|---|---|---|---|---|---|---|
| 2017-12-18 → 2018-01-01 | -6.6981% | -0.4011% | 6.239% | 1.9218% | yes | 2.4291% | 0 / 8 |
| 2018-01-01 → window end | -35.857% | -7.5447% | 31.1347% | 4.6938% | yes | 2.4345% | 7 / 242 |
Step 12 · 2018-12-24 → 2019-12-24
Additions
Portfolio book, rebalanced annual · 2 constructions · 6 names held · selection: hold · 0.0% in cash · turnover 1.0× · cost drag 0.1%
Projection accuracy, realized outcome fell inside the P5–P95 cone in 50.0% of 2 scored rebalances (a well-calibrated 90% band contains ~90.0%) · 95% VaR breached on 6.37% of 251 days (expected ~5.0%)
| Rebalance | P5 | Median | P95 | Realized | In band | VaR 95 (1d) | Breaches |
|---|---|---|---|---|---|---|---|
| 2018-12-24 → 2019-01-01 | -3.5493% | 0.5799% | 4.8089% | 7.1528% | no | 2.0077% | 0 / 4 |
| 2019-01-01 → window end | -1.1069% | 37.8101% | 91.5178% | 48.6239% | yes | 2.0079% | 16 / 247 |
Deletions
Portfolio book, rebalanced annual · 2 constructions · 5 names held · selection: hold · 0.0% in cash · turnover 1.0× · cost drag 0.1% · 1 name dropped at load (6 selected, 5 held across the window), weights renormalised onto the rest
Projection accuracy, realized outcome fell inside the P5–P95 cone in 50.0% of 2 scored rebalances (a well-calibrated 90% band contains ~90.0%) · 95% VaR breached on 4.38% of 251 days (expected ~5.0%)
| Rebalance | P5 | Median | P95 | Realized | In band | VaR 95 (1d) | Breaches |
|---|---|---|---|---|---|---|---|
| 2018-12-24 → 2019-01-01 | -3.6369% | 0.2316% | 4.1836% | 4.8512% | no | 1.6019% | 0 / 4 |
| 2019-01-01 → window end | -17.4504% | 12.5203% | 52.9815% | 1.1408% | yes | 1.604% | 11 / 247 |
Step 13 · 2019-12-23 → 2020-12-22
Additions
Portfolio book, rebalanced annual · 2 constructions · 6 names held · selection: hold · 0.0% in cash · turnover 1.0× · cost drag 0.1%
Projection accuracy, realized outcome fell inside the P5–P95 cone in 100.0% of 2 scored rebalances (a well-calibrated 90% band contains ~90.0%) · 95% VaR breached on 10.36% of 251 days (expected ~5.0%)
| Rebalance | P5 | Median | P95 | Realized | In band | VaR 95 (1d) | Breaches |
|---|---|---|---|---|---|---|---|
| 2019-12-23 → 2020-01-01 | -4.2763% | 0.809% | 6.1913% | 0.0541% | yes | 2.3285% | 0 / 5 |
| 2020-01-01 → window end | -0.5719% | 43.9552% | 103.6741% | 37.0132% | yes | 2.329% | 26 / 246 |
Deletions
Portfolio book, rebalanced annual · 2 constructions · 6 names held · selection: hold · 0.0% in cash · turnover 1.0× · cost drag 0.1%
Projection accuracy, realized outcome fell inside the P5–P95 cone in 100.0% of 2 scored rebalances (a well-calibrated 90% band contains ~90.0%) · 95% VaR breached on 13.55% of 251 days (expected ~5.0%)
| Rebalance | P5 | Median | P95 | Realized | In band | VaR 95 (1d) | Breaches |
|---|---|---|---|---|---|---|---|
| 2019-12-23 → 2020-01-01 | -4.7613% | 0.0418% | 5.1125% | 0.0686% | yes | 2.1117% | 0 / 5 |
| 2020-01-01 → window end | -28.514% | 1.6851% | 41.5021% | -0.4572% | yes | 2.1143% | 34 / 246 |
Step 14 · 2020-12-21 → 2021-12-21
Additions
Portfolio book, rebalanced annual · 2 constructions · 7 names held · selection: hold · 0.0% in cash · turnover 1.0× · cost drag 0.1%
Projection accuracy, realized outcome fell inside the P5–P95 cone in 100.0% of 2 scored rebalances (a well-calibrated 90% band contains ~90.0%) · 95% VaR breached on 4.38% of 251 days (expected ~5.0%)
| Rebalance | P5 | Median | P95 | Realized | In band | VaR 95 (1d) | Breaches |
|---|---|---|---|---|---|---|---|
| 2020-12-21 → 2021-01-01 | -6.7409% | 1.3504% | 11.0151% | -0.8082% | yes | 3.0587% | 0 / 7 |
| 2021-01-01 → window end | -1.3559% | 67.5489% | 176.1956% | 4.2472% | yes | 2.8946% | 11 / 244 |
Deletions
Portfolio book, rebalanced annual · 2 constructions · 7 names held · selection: hold · 0.0% in cash · turnover 1.0× · cost drag 0.1%
Projection accuracy, realized outcome fell inside the P5–P95 cone in 100.0% of 2 scored rebalances (a well-calibrated 90% band contains ~90.0%) · 95% VaR breached on 0.8% of 251 days (expected ~5.0%)
| Rebalance | P5 | Median | P95 | Realized | In band | VaR 95 (1d) | Breaches |
|---|---|---|---|---|---|---|---|
| 2020-12-21 → 2021-01-01 | -6.8866% | 0.228% | 8.6412% | 2.9553% | yes | 2.7474% | 0 / 7 |
| 2021-01-01 → window end | -28.8943% | 13.7523% | 77.211% | 10.985% | yes | 2.6239% | 2 / 244 |
Step 15 · 2021-12-20 → 2022-12-20
Additions
Portfolio book, rebalanced annual · 2 constructions · 7 names held · selection: hold · 0.0% in cash · turnover 1.0× · cost drag 0.1%
Projection accuracy, realized outcome fell inside the P5–P95 cone in 50.0% of 2 scored rebalances (a well-calibrated 90% band contains ~90.0%) · 95% VaR breached on 17.93% of 251 days (expected ~5.0%)
| Rebalance | P5 | Median | P95 | Realized | In band | VaR 95 (1d) | Breaches |
|---|---|---|---|---|---|---|---|
| 2021-12-20 → 2022-01-01 | -7.5412% | 1.8541% | 12.076% | 5.0107% | yes | 3.1262% | 0 / 8 |
| 2022-01-01 → window end | 7.1744% | 83.2049% | 210.3552% | -45.9295% | no | 3.1304% | 45 / 243 |
Deletions
Portfolio book, rebalanced annual · 2 constructions · 7 names held · selection: hold · 0.0% in cash · turnover 1.0× · cost drag 0.1%
Projection accuracy, realized outcome fell inside the P5–P95 cone in 100.0% of 2 scored rebalances (a well-calibrated 90% band contains ~90.0%) · 95% VaR breached on 2.79% of 251 days (expected ~5.0%)
| Rebalance | P5 | Median | P95 | Realized | In band | VaR 95 (1d) | Breaches |
|---|---|---|---|---|---|---|---|
| 2021-12-20 → 2022-01-01 | -7.5325% | 0.0987% | 8.2583% | 4.5742% | yes | 2.7761% | 0 / 8 |
| 2022-01-01 → window end | -29.5628% | 9.5011% | 68.9682% | 3.6513% | yes | 2.7771% | 7 / 243 |
Step 16 · 2022-12-19 → 2023-12-19
Additions
Portfolio book, rebalanced annual · 2 constructions · 6 names held · selection: hold · 0.0% in cash · turnover 1.0× · cost drag 0.1% · 1 name dropped at load (7 selected, 6 held across the window), weights renormalised onto the rest
Projection accuracy, realized outcome fell inside the P5–P95 cone in 100.0% of 2 scored rebalances (a well-calibrated 90% band contains ~90.0%) · 95% VaR breached on 1.2% of 250 days (expected ~5.0%)
| Rebalance | P5 | Median | P95 | Realized | In band | VaR 95 (1d) | Breaches |
|---|---|---|---|---|---|---|---|
| 2022-12-19 → 2023-01-01 | -7.7816% | 0.4311% | 9.2651% | 0.797% | yes | 2.8133% | 0 / 8 |
| 2023-01-01 → window end | -25.0411% | 20.4855% | 89.6548% | 26.3066% | yes | 2.8102% | 3 / 242 |
Deletions
Portfolio book, rebalanced annual · 2 constructions · 7 names held · selection: hold · 0.0% in cash · turnover 1.0× · cost drag 0.1%
Projection accuracy, realized outcome fell inside the P5–P95 cone in 100.0% of 2 scored rebalances (a well-calibrated 90% band contains ~90.0%) · 95% VaR breached on 0.8% of 250 days (expected ~5.0%)
| Rebalance | P5 | Median | P95 | Realized | In band | VaR 95 (1d) | Breaches |
|---|---|---|---|---|---|---|---|
| 2022-12-19 → 2023-01-01 | -10.7839% | -0.9344% | 9.8666% | 2.2676% | yes | 3.6748% | 0 / 8 |
| 2023-01-01 → window end | -53.6271% | -16.464% | 46.6289% | 19.9454% | yes | 3.6749% | 2 / 242 |
Step 17 · 2023-12-18 → 2024-12-17
Additions
Portfolio book, rebalanced annual · 2 constructions · 7 names held · selection: hold · 0.0% in cash · turnover 1.0× · cost drag 0.1%
Projection accuracy, realized outcome fell inside the P5–P95 cone in 100.0% of 2 scored rebalances (a well-calibrated 90% band contains ~90.0%) · 95% VaR breached on 0.0% of 250 days (expected ~5.0%)
| Rebalance | P5 | Median | P95 | Realized | In band | VaR 95 (1d) | Breaches |
|---|---|---|---|---|---|---|---|
| 2023-12-18 → 2024-01-01 | -8.7471% | -0.0932% | 9.2646% | 0.228% | yes | 3.2616% | 0 / 8 |
| 2024-01-01 → window end | -37.9213% | 3.2199% | 67.8237% | 8.8094% | yes | 3.2657% | 0 / 242 |
Deletions
Portfolio book, rebalanced annual · 2 constructions · 7 names held · selection: hold · 0.0% in cash · turnover 1.0× · cost drag 0.1%
Projection accuracy, realized outcome fell inside the P5–P95 cone in 100.0% of 2 scored rebalances (a well-calibrated 90% band contains ~90.0%) · 95% VaR breached on 0.0% of 250 days (expected ~5.0%)
| Rebalance | P5 | Median | P95 | Realized | In band | VaR 95 (1d) | Breaches |
|---|---|---|---|---|---|---|---|
| 2023-12-18 → 2024-01-01 | -12.6444% | -1.3153% | 11.3226% | 1.6736% | yes | 4.0324% | 0 / 8 |
| 2024-01-01 → window end | -65.4522% | -31.4062% | 32.1368% | 4.5696% | yes | 4.0339% | 0 / 242 |
Step 18 · 2024-12-23 → 2025-12-23
Additions
Portfolio book, rebalanced annual · 2 constructions · 3 names held · selection: hold · 0.0% in cash · turnover 1.0× · cost drag 0.1%
Projection accuracy, realized outcome fell inside the P5–P95 cone in 50.0% of 2 scored rebalances (a well-calibrated 90% band contains ~90.0%) · 95% VaR breached on 9.64% of 249 days (expected ~5.0%)
| Rebalance | P5 | Median | P95 | Realized | In band | VaR 95 (1d) | Breaches |
|---|---|---|---|---|---|---|---|
| 2024-12-23 → 2025-01-01 | -8.458% | 2.3426% | 14.4801% | -7.9127% | yes | 3.9097% | 0 / 5 |
| 2025-01-01 → window end | 33.563% | 188.6331% | 497.1777% | 19.8026% | no | 3.9282% | 24 / 244 |
Deletions
Portfolio book, rebalanced annual · 2 constructions · 3 names held · selection: hold · 0.0% in cash · turnover 1.0× · cost drag 0.1%
Projection accuracy, realized outcome fell inside the P5–P95 cone in 100.0% of 2 scored rebalances (a well-calibrated 90% band contains ~90.0%) · 95% VaR breached on 10.44% of 249 days (expected ~5.0%)
| Rebalance | P5 | Median | P95 | Realized | In band | VaR 95 (1d) | Breaches |
|---|---|---|---|---|---|---|---|
| 2024-12-23 → 2025-01-01 | -9.6204% | 0.3491% | 11.4755% | -0.6303% | yes | 3.9992% | 0 / 5 |
| 2025-01-01 → window end | -46.4842% | 10.0517% | 117.283% | 5.0767% | yes | 4.0003% | 26 / 244 |