



Post-Earnings Drift by Sector, Walked 220 Times Under Two Anchors: Dead at the Formation Date, Alive at the Announcement
The drift the academic literature describes does not pay in large caps: form the classic quarterly surprise book and the grid nets -0.5 percent a year across eleven sectors and twenty years. The reaction to the earnings number itself still does: enter each company the day its own number is known and the same surprise measure nets +2.2 percent a year, peaks at the ten-day hold, and fades by the quarter.
Post-earnings announcement drift is one of the oldest documented anomalies in the accounting literature: prices keep moving in the direction of an earnings surprise after the number is public. Whether it survives in liquid large caps is contested, and recent work finds it gone. This study asks the question 220 times on one pre-registered design and finds the answer turns on the entry date.
Eleven point-in-time sector books walk through twenty sealed one-year windows each, 2006 through 2025, at five holding periods (5, 10, 21, 42 and 63 trading days) and in two book shapes: a five-a-side long-short book and a long-only comparison of the largest surprises against every eligible name. The whole grid runs twice. Wave one forms baskets at calendar quarter starts, the standard academic cadence, ranking the season by standardized unexpected earnings (SUE). Wave two enters each name individually at the close of the first session its own announcement is known, qualified against the sector's trailing-year SUE quintile boundaries. Same universe, same surprise measure, same dated sector map, same liquidity-tiered costs, same fifteen-name floors.
At the formation anchor the long-short grid averages -0.5 percent a year net and eight of the eleven sector rows average below zero: the classic drift book reads dead in large caps, in line with Martineau (2021). At the announcement anchor the same grid averages +2.2, peaks at the ten-day rung (+3.1), and fades toward zero by the quarter, the decay profile Bernard and Thomas measured in 1989. Technology moves from -3.0 percent a year at 21 days to +10.5 with 80 percent of windows positive. Utilities is negative under both anchors at every rung. The long-only selection edge inverts on the same switch (+0.2 to -1.5 points): a book that already enters every announcement the day it is known captures most of what selection used to add.
The record behind the grids: 4400 windows sealed, 3990 walked, 410 refused by the declared floor and printed as exclusions, 88,859 long-short positions entered, and one declared search family of 220, so every deflation statistic on every page answers to the full count. Net leg imbalance explains almost none of the announcement result: mean tilt +0.05, per-window correlation with returns 0.12.
1 Methodology
Every result in this paper comes from one rule set, run twice. The two runs differ in the day a position is opened, and in the two things that day forces: how a surprise qualifies, and how many names the book holds at once. Everything else, the universe, the surprise measure, the sector map, the costs, the floors, is identical.
What a surprise is. When a company reports, take actual earnings per share minus the consensus estimate. Divide that gap by how widely the company's own last eight surprises have scattered. The result is the standardized surprise, SUE. A two-cent beat counts as large for a company that usually lands within a cent of consensus, and as small for a company that misses by a dime every quarter. This step looks only at the company's own history; a company with fewer than four past surprises has no score and cannot be traded. A price-scaled surprise was rejected during the data pull: the vendor restates each name's EPS history by its own split factor, so scaling by price mixes bases across names, while SUE cancels the factor row by row because actual and consensus share it.
When the number is known. A report published after the close is known the next session. A report published before the open is known the same session. Every entry in this paper happens at the close of the session the number is known, so the overnight gap and the first day's reaction are always excluded.
Run one, the quarterly book. On the first trading day of January, April, July and October, take every company in the sector that reported inside the previous 90 days and rank them by SUE. Buy the five highest, short the five lowest, equal weight, long side and short side the same size. Hold for the fixed holding period, 5, 10, 21, 42 or 63 trading days, then close everything and sit in cash until the next quarter start. This is the design the academic literature and the factor products use. By the time the book forms, most of its names reported six to ten weeks earlier.
Run two, the announcement book. No fixed formation day. Each company is judged alone, on the session its number is known. Its SUE is compared with the pool of every SUE the sector printed in the last 365 days, roughly the last four reporting seasons, every one of them already on the record. Above the pool's 80th percentile, buy at that session's close. Below the 20th, short at that close. Anything in between does nothing, the sign has to agree with the side, and a surprise of exactly zero never enters. Because the cutoff comes from the past year, it is known on the day and does not wait for the rest of the season. Hold for exactly the holding period, then close. One open position per company; each new position takes a tenth of book equity, shared equally when more than ten are open on one side.
The consequence of the second rule is that the book is not five against five. In a season where many companies beat by more than last year's standard, the long side fills with more names than the short side. Technology is the sector where that happens most, and Table 6 counts it.
Why the columns of the tables are separate books. The five holding periods are five independent runs of the same rule. They enter the same names on the same days and differ in the day they exit; at the longer holds a repeat report that lands while a position is still open is skipped, so those columns carry slightly fewer entries. The 10-day column and the 63-day column of Technology hold mostly the same companies; one lets go after two weeks and the other after a quarter.
What a window is. Each book is scored over one calendar year at a time, twenty years in a row, 2006 through 2025, each year sealed before it is run. A year with fewer than fifteen different reporting companies in the sector is refused and printed as excluded rather than scored on a handful of names; the quarterly book applies the same fifteen-name floor at each formation day.
Costs and returns. Each traded name pays its liquidity tier one way at entry and at exit: 1.5 basis points above 500 million dollars of average daily volume, 3 above 100 million, 6 below. Shorts pay 50 basis points a year of borrow. The announcement long-short book's realized drag averaged 0.66 percent per one-year window. Returns are total returns, dividends credited from the payment record on their ex-dates, never from the vendor's adjusted close.
The record. All 220 studies, 11 sectors by 5 holding periods by 2 book shapes by 2 entry rules, were registered before any result was read; each year is a sealed hypothesis with a frozen run report, and every number in this paper is re-derived from those frozen reports, never from walk logs. The study code carries 14 unit tests including a hand-computed P&L check; rehearsals on unregistered cells caught three defects that were fixed before registration; the two runs took about eleven hours of engine time with no failures, and the family of 220 was declared and stamped into every artifact before this text was written.
2 Results
Findings
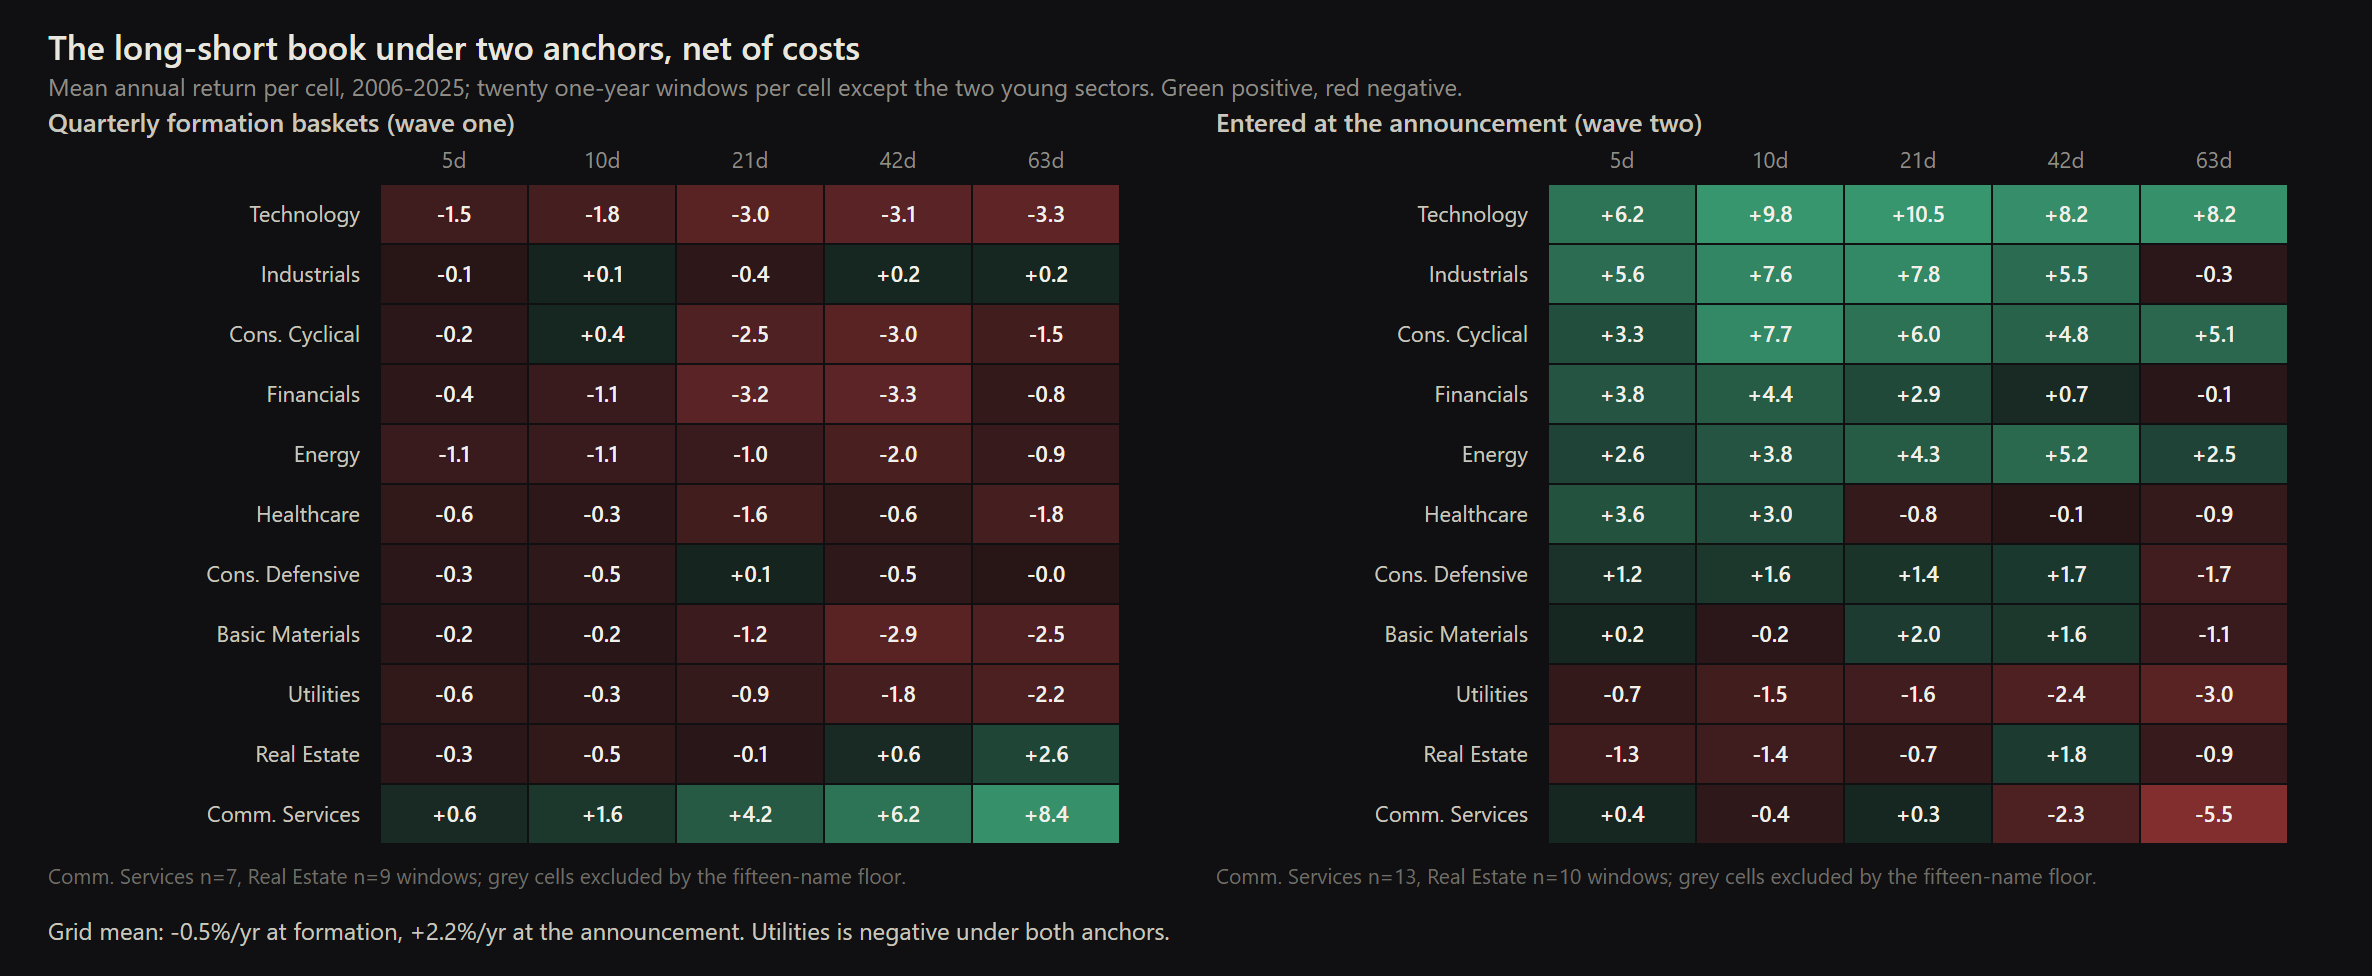
The explorer above draws all 220 books; the tables below score them. The two long-short grids are Tables 1 and 2, and the whole result sits in their difference. Formed quarterly, the grid averages -0.5 percent a year net; eight of the eleven sector rows average below zero, Industrials sits at +0.02, and only the two short-record sectors average above. The worst cells sit a month and further out: Technology from 21 days and Financials at one to two months, each losing about 3 percent a year. Entered at the announcement, the same design averages +2.2, and 35 of the 55 cells print positive means. The average cell improves by 2.7 points on the switch; technology improves by 7.7 to 13.5 points depending on the rung.
The holding-period profile (Table 7, and the second figure) is the mechanism's signature. At the announcement the grid mean rises from +2.3 at five days to +3.1 at ten, holds +2.9 at a month, then decays to +2.2 at two months and +0.2 at the quarter. The formation profile sits between -0.2 and -0.9 at every rung: by the time a quarter-start basket forms, the window Bernard and Thomas measured has mostly closed, and what remains to harvest rounds to zero or less after costs.
What the ten-day rung survives in costs: its +3.1 is net of tiers that drag 0.7 points a year, so the gross is +3.8 and spreads would need to reach about 5 times the charged schedule, roughly 8 basis points a side for a top-tier name and 33 for the bottom tier, before the rung rounds to zero.
Technology is the loudest single story (Table 6). At 21 days: -3.0 percent a year formed quarterly, +10.5 entered at the announcement, 80 percent of twenty windows positive, and the ten-day and 42-day rungs agree at +9.8 and +8.2. Industrials at 21 days prints +7.8 with 85 percent of windows positive. Consumer Cyclical peaks at +7.7 at ten days. Energy is positive at all five announcement rungs. Financials and Healthcare hold gains at the one-to-two-week rungs and give them back by the quarter.
Utilities is the control group nature provided: negative at every rung under both anchors, -0.7 to -3.0 announcement-entered and -0.3 to -2.2 formed. Regulated cash flows leave little for a surprise to predict, and the sector prices what little there is inside the first week. Communication Services needs its label read with the map. The dated map counts each name by its label on the day, so before the September 2018 redraw the row is the telecom and media names that were never relabeled, a different book by composition. The fifteen-name floor admits that book from 2013 in the announcement run and only from 2019 in the quarterly run, which is why Table 1 carries 13 windows and Table 2 carries 7. The 7-window formation column is the best-looking in Table 2; the 13-window announcement row walks the same label back to noise and a -5.5 quarter rung. Both stand on few windows, and both are printed.
The long-only pair inverts on the same switch (Tables 3 and 4). Formed quarterly, picking the five largest surprises adds +0.2 points a year over holding every eligible name, and Industrials at the quarter rung is the cleanest cell in either wave: +5.1 points, 18 of 20 windows. Entered at the announcement, the same selection averages -1.5 points against a book that holds every announcement, because that book already captures the timing. Move the anchor and the Industrials edge disappears: it was timing, recorded under a selection heading.
Attribution. The announcement legs float with the news flow, so the book is net long when beats outnumber misses. Across 88,859 positions the mean tilt is +0.05 and the per-window correlation between tilt and return is 0.12: the grid-level result does not ride market exposure. Technology is the exception worth naming: 7,355 longs against 4,648 shorts (tilt +0.23, Table 6), because beats dominate the sector and a zero surprise never enters. Part of the technology row is net-long exposure in a rising market; the ten-day peak and the decay profile are not, and no other sector's tilt exceeds 0.12.
2.1 Headline
One cell of the 220: Technology, 21 days, five a side long-short, entered at the announcement. Its quarterly-formation twin averaged -3.0 percent a year on the same windows; the tables carry the rest.
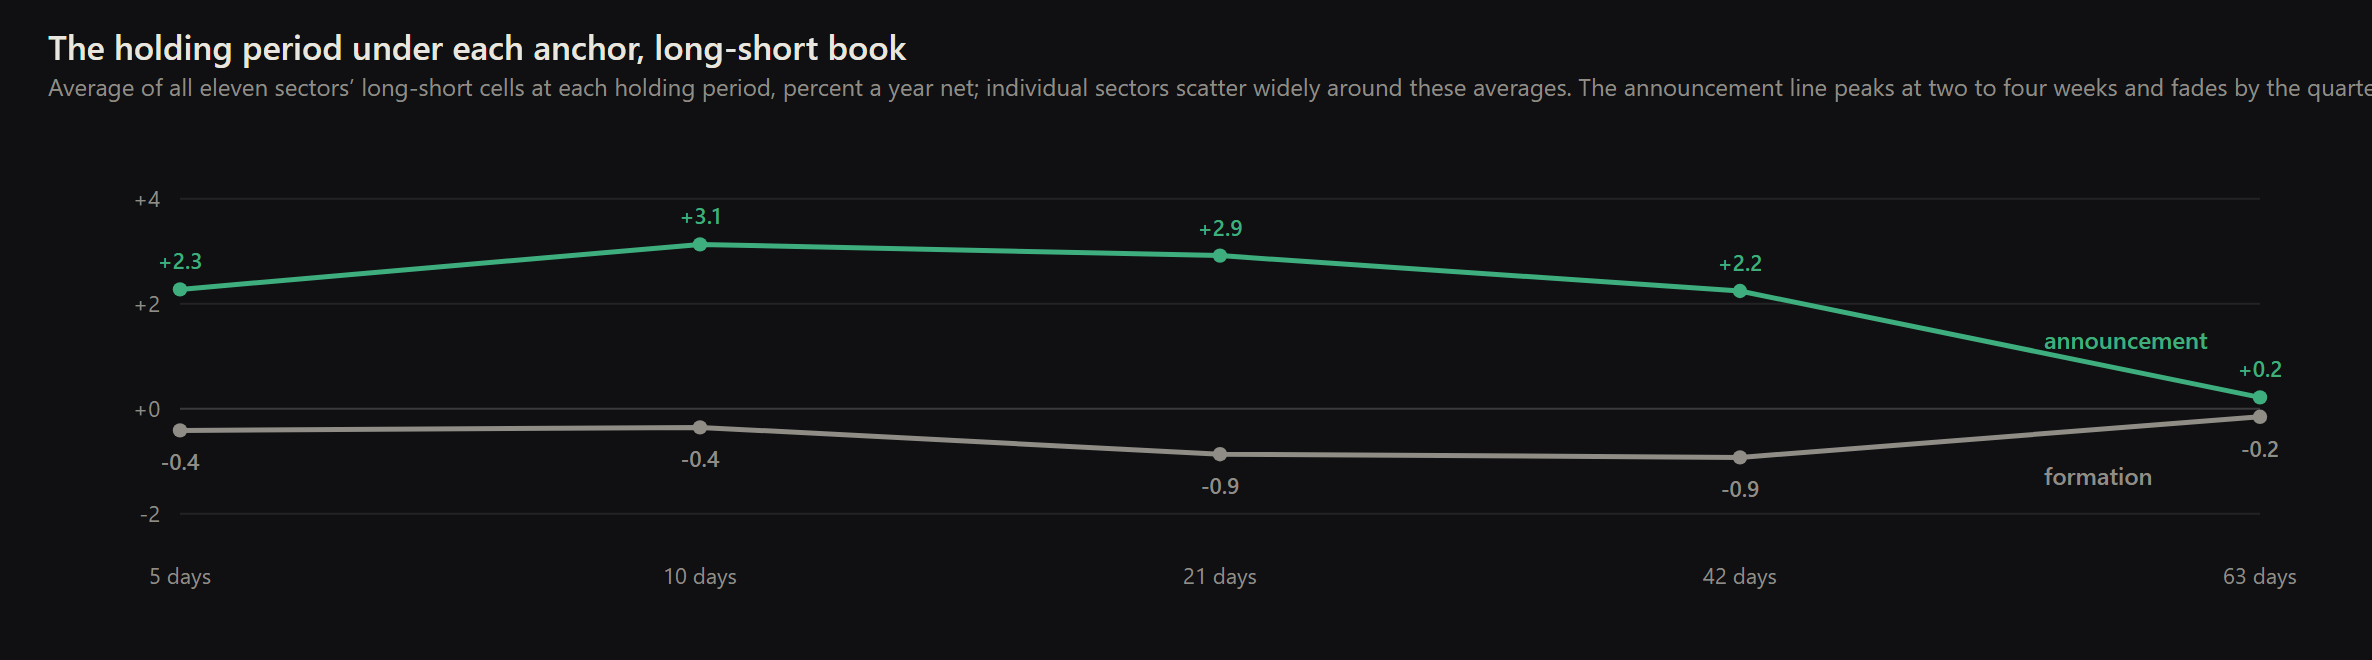
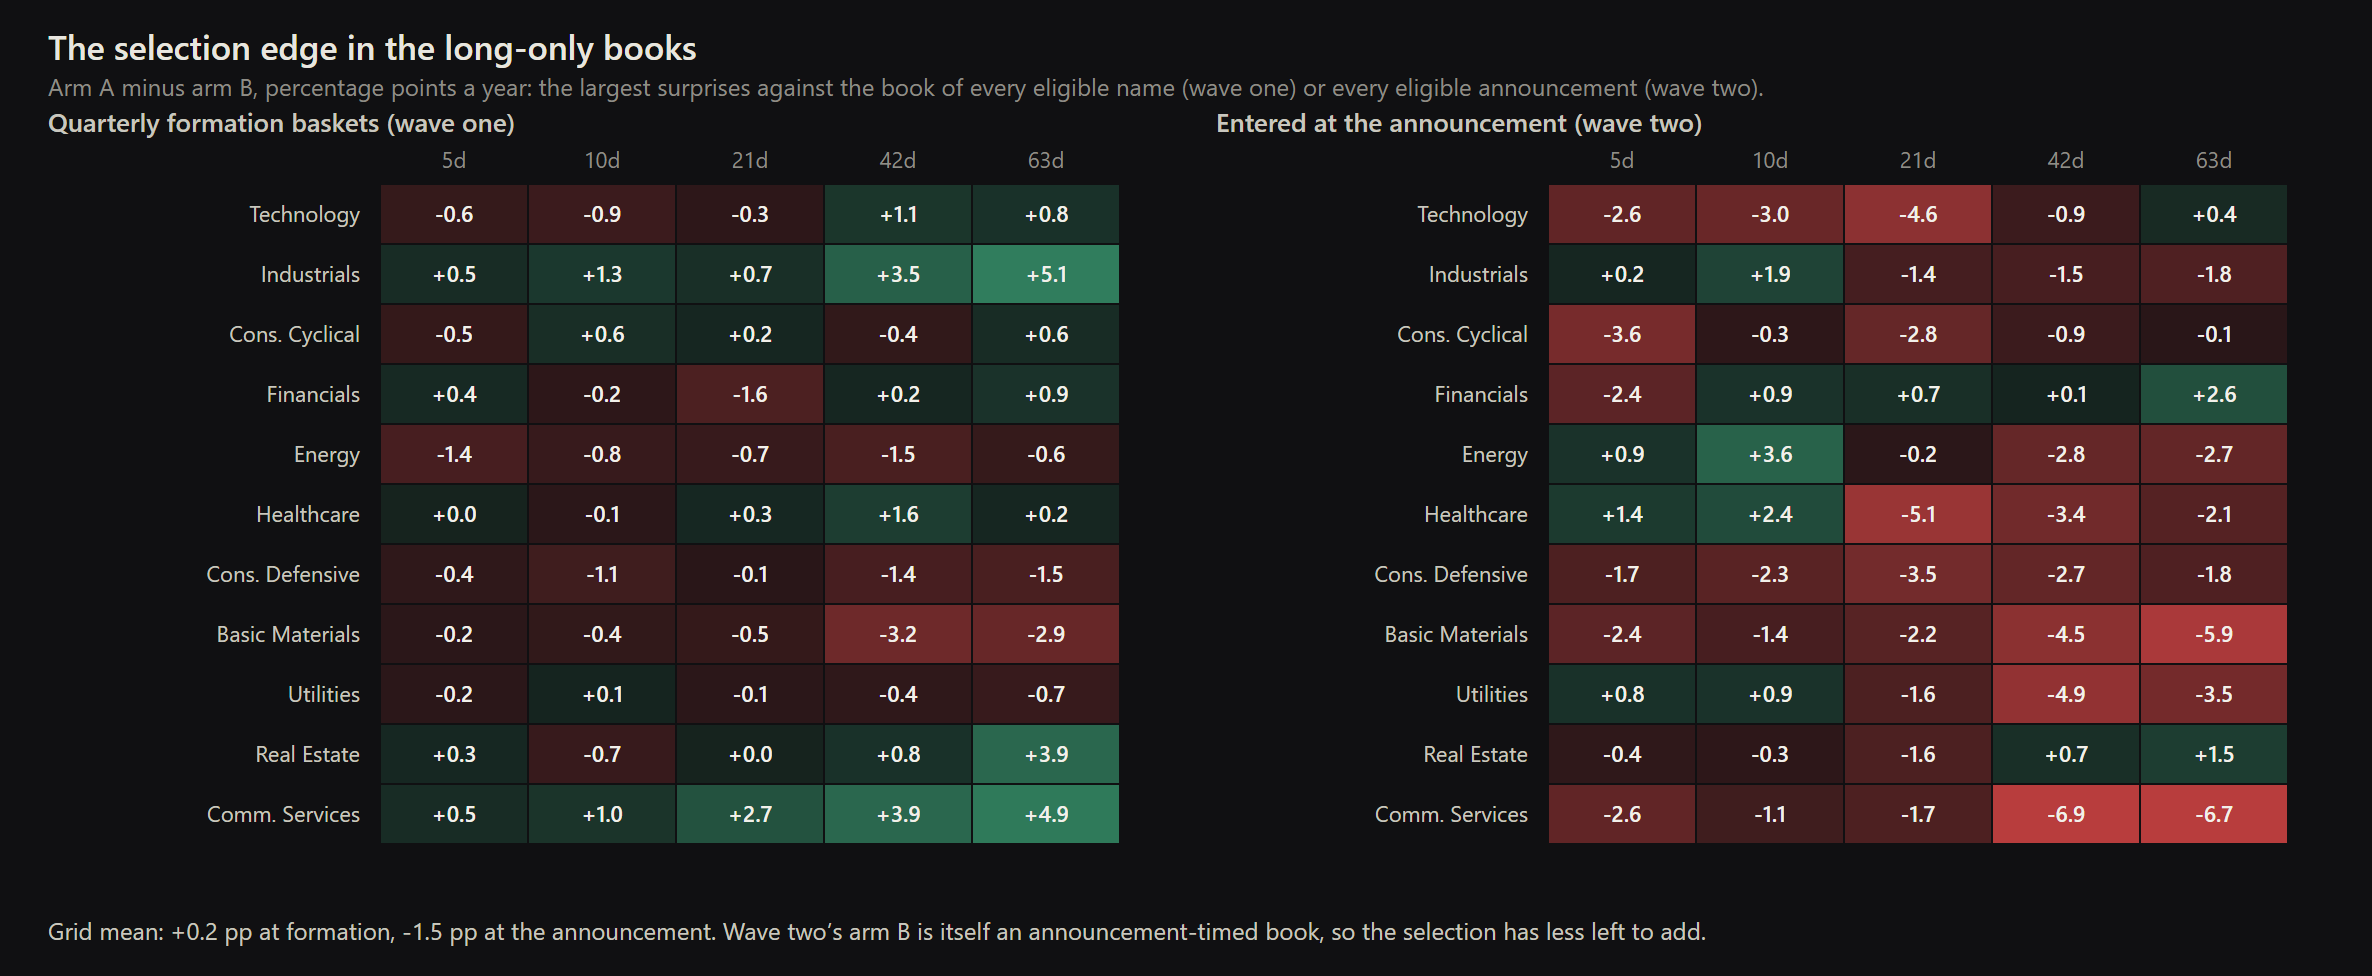
Table 1. Mean annual return net of costs per cell, with the share of positive windows in parentheses. Five long, five short is the formation shape; here each entry is an individual position opened at the close of the first session its announcement is known and held for the rung. Twenty one-year windows per cell except the two young sectors.
| Sector | 5d | 10d | 21d | 42d | 63d | Windows |
|---|---|---|---|---|---|---|
| Technology | +6.2 (55%) | +9.8 (80%) | +10.5 (80%) | +8.2 (80%) | +8.2 (70%) | 20 |
| Industrials | +5.6 (55%) | +7.6 (75%) | +7.8 (85%) | +5.5 (60%) | -0.3 (40%) | 20 |
| Consumer Cyclical | +3.3 (60%) | +7.7 (70%) | +6.0 (55%) | +4.8 (45%) | +5.1 (45%) | 20 |
| Financial Services | +3.8 (60%) | +4.4 (55%) | +2.9 (55%) | +0.7 (60%) | -0.1 (40%) | 20 |
| Energy | +2.6 (65%) | +3.8 (65%) | +4.3 (65%) | +5.2 (60%) | +2.5 (45%) | 20 |
| Healthcare | +3.6 (70%) | +3.0 (60%) | -0.8 (35%) | -0.1 (40%) | -0.9 (35%) | 20 |
| Consumer Defensive | +1.2 (60%) | +1.6 (55%) | +1.4 (60%) | +1.7 (55%) | -1.7 (60%) | 20 |
| Basic Materials | +0.2 (55%) | -0.2 (40%) | +2.0 (50%) | +1.6 (55%) | -1.1 (50%) | 20 |
| Utilities | -0.7 (40%) | -1.5 (35%) | -1.6 (35%) | -2.4 (30%) | -3.0 (25%) | 20 |
| Real Estate | -1.3 (60%) | -1.4 (50%) | -0.7 (40%) | +1.8 (60%) | -0.9 (50%) | 10 |
| Communication Services | +0.4 (46%) | -0.4 (31%) | +0.3 (54%) | -2.3 (46%) | -5.5 (31%) | 13 |
Table 2. The same cells under the academic anchor: the five largest and five most negative surprises of each reporting season, formed at calendar quarter starts, held for the rung, flat between. Same universe, same surprise measure, same costs, same floors.
| Sector | 5d | 10d | 21d | 42d | 63d | Windows |
|---|---|---|---|---|---|---|
| Technology | -1.5 (20%) | -1.8 (30%) | -3.0 (40%) | -3.1 (50%) | -3.3 (45%) | 20 |
| Industrials | -0.1 (45%) | +0.1 (40%) | -0.4 (35%) | +0.2 (50%) | +0.2 (50%) | 20 |
| Consumer Cyclical | -0.2 (40%) | +0.4 (50%) | -2.5 (30%) | -2.9 (50%) | -1.5 (40%) | 20 |
| Financial Services | -0.4 (45%) | -1.1 (35%) | -3.2 (30%) | -3.3 (35%) | -0.8 (40%) | 20 |
| Energy | -1.1 (15%) | -1.1 (25%) | -1.0 (45%) | -2.0 (40%) | -0.9 (50%) | 20 |
| Healthcare | -0.6 (35%) | -0.3 (40%) | -1.5 (35%) | -0.6 (50%) | -1.8 (40%) | 20 |
| Consumer Defensive | -0.3 (40%) | -0.5 (50%) | +0.1 (55%) | -0.5 (45%) | -0.0 (45%) | 20 |
| Basic Materials | -0.2 (35%) | -0.2 (45%) | -1.2 (45%) | -2.9 (30%) | -2.4 (35%) | 20 |
| Utilities | -0.6 (40%) | -0.3 (40%) | -0.9 (40%) | -1.8 (30%) | -2.2 (30%) | 20 |
| Real Estate | -0.3 (56%) | -0.5 (56%) | -0.1 (56%) | +0.6 (56%) | +2.6 (56%) | 9 |
| Communication Services | +0.6 (57%) | +1.6 (57%) | +4.2 (71%) | +6.2 (71%) | +8.4 (71%) | 7 |
Table 3. Arm A (the five largest surprises of the season) minus arm B (every eligible name, equal weight), percentage points a year, formed quarterly. Industrials at the quarter rung is the strongest cell in either long-only grid: +5.1 points with 18 of 20 windows positive.
| Sector | 5d | 10d | 21d | 42d | 63d | Windows |
|---|---|---|---|---|---|---|
| Technology | -0.6 (55%) | -0.9 (40%) | -0.3 (55%) | +1.1 (55%) | +0.8 (60%) | 20 |
| Industrials | +0.5 (60%) | +1.3 (65%) | +0.7 (35%) | +3.5 (75%) | +5.1 (90%) | 20 |
| Consumer Cyclical | -0.5 (50%) | +0.6 (65%) | +0.2 (75%) | -0.4 (60%) | +0.6 (55%) | 20 |
| Financial Services | +0.4 (55%) | -0.2 (55%) | -1.6 (35%) | +0.2 (45%) | +0.9 (50%) | 20 |
| Energy | -1.4 (30%) | -0.8 (55%) | -0.7 (55%) | -1.5 (50%) | -0.6 (40%) | 20 |
| Healthcare | +0.0 (35%) | -0.1 (40%) | +0.3 (45%) | +1.6 (50%) | +0.2 (50%) | 20 |
| Consumer Defensive | -0.4 (40%) | -1.1 (35%) | -0.1 (50%) | -1.4 (40%) | -1.5 (40%) | 20 |
| Basic Materials | -0.2 (35%) | -0.4 (45%) | -0.5 (50%) | -3.2 (35%) | -2.9 (35%) | 20 |
| Utilities | -0.2 (45%) | +0.1 (50%) | -0.1 (35%) | -0.4 (35%) | -0.7 (45%) | 20 |
| Real Estate | +0.3 (78%) | -0.7 (56%) | +0.0 (44%) | +0.8 (56%) | +3.9 (44%) | 9 |
| Communication Services | +0.5 (57%) | +1.0 (57%) | +2.7 (71%) | +3.9 (71%) | +4.9 (57%) | 7 |
Table 4. Arm A (announcements at or above the trailing 80th SUE percentile) minus arm B (every eligible announcement), percentage points a year. Arm B is itself an announcement-timed book, which is why the green of Table 3 mostly disappears here.
| Sector | 5d | 10d | 21d | 42d | 63d | Windows |
|---|---|---|---|---|---|---|
| Technology | -2.6 (45%) | -3.0 (50%) | -4.6 (45%) | -0.9 (50%) | +0.4 (60%) | 20 |
| Industrials | +0.2 (45%) | +1.9 (55%) | -1.4 (45%) | -1.5 (40%) | -1.8 (50%) | 20 |
| Consumer Cyclical | -3.6 (35%) | -0.3 (50%) | -2.8 (45%) | -0.9 (50%) | -0.1 (45%) | 20 |
| Financial Services | -2.4 (45%) | +0.9 (55%) | +0.7 (60%) | +0.1 (50%) | +2.6 (65%) | 20 |
| Energy | +0.9 (60%) | +3.6 (70%) | -0.2 (50%) | -2.8 (50%) | -2.7 (35%) | 20 |
| Healthcare | +1.4 (50%) | +2.4 (50%) | -5.1 (20%) | -3.4 (30%) | -2.1 (35%) | 20 |
| Consumer Defensive | -1.7 (40%) | -2.3 (40%) | -3.5 (40%) | -2.7 (35%) | -1.8 (50%) | 20 |
| Basic Materials | -2.4 (50%) | -1.4 (50%) | -2.2 (50%) | -4.5 (35%) | -5.9 (45%) | 20 |
| Utilities | +0.8 (55%) | +0.9 (60%) | -1.6 (40%) | -4.9 (25%) | -3.5 (35%) | 20 |
| Real Estate | -0.4 (60%) | -0.3 (50%) | -1.6 (50%) | +0.7 (50%) | +1.5 (60%) | 10 |
| Communication Services | -2.6 (38%) | -1.1 (54%) | -1.7 (46%) | -6.9 (31%) | -6.7 (38%) | 13 |
Table 5. Everything the two grids ran, counted: 11 sectors by 5 rungs by 2 book shapes by 2 anchors. The frozen inputs are announcement-dated EPS with consensus, the dated sector map carrying the 2016, 2018 and 2023 redraws, and quarterly 63-day dollar volume. The family of 220 is declared on every page, so the deflation arithmetic answers to the full search, and an excluded window is a recorded outcome, never a silent drop.
| Fact | Count |
|---|---|
| Registered walk-forward studies | 220 |
| Sealed one-year windows | 4,400 |
| Walked to a frozen run report | 3,990 |
| Refused by the fifteen-name floor | 410 (240 + 170) |
| Long-short entries, wave two | 88,859 |
| Long / short legs | 46,763 42,096 |
| Every-announcement book entries | 227,865 |
| Frozen point-in-time inputs | 3 tables |
| Unit tests, with a P&L golden | 14 |
| Defects fixed in rehearsal | 3 |
| Walk failures in ~11 engine hours | 0 |
Table 6. The loudest sector, decomposed. Entries are announcement-wave positions summed across each rung's twenty windows; tilt is long minus short over total. Technology longs outnumber shorts because beats dominate and a zero surprise never enters a leg, so part of this row rides net exposure. Grid-wide the tilt is +0.05.
| Rung | Announcement LS (%/yr) | Formation LS (%/yr) | Long entries | Short entries | Tilt |
|---|---|---|---|---|---|
| 5d | +6.2 (55%) | -1.5 | 1,517 | 958 | +0.23 |
| 10d | +9.8 (80%) | -1.8 | 1,517 | 958 | +0.23 |
| 21d | +10.5 (80%) | -3.0 | 1,517 | 957 | +0.23 |
| 42d | +8.2 (80%) | -3.1 | 1,516 | 954 | +0.23 |
| 63d | +8.2 (70%) | -3.3 | 1,288 | 821 | +0.22 |
Table 7. Mean of the eleven sector cells at each rung, long-short book, percent a year net. The announcement profile carries the shape Bernard and Thomas measured: most of the move lands inside a month of the number and is gone by the quarter.
| Anchor | 5d | 10d | 21d | 42d | 63d |
|---|---|---|---|---|---|
| Announcement | +2.3 | +3.1 | +2.9 | +2.2 | +0.2 |
| Formation | -0.4 | -0.4 | -0.9 | -0.9 | -0.2 |
2.2 Per-step results
| # | Step | Out-of-sample window | Sharpe |
|---|---|---|---|
| 1 | Earnings drift at announcement · Technology · 21d · LS · step 1 | 2006-01-03 → 2006-12-29 | 3.28 |
| 2 | Earnings drift at announcement · Technology · 21d · LS · step 2 | 2007-01-03 → 2007-12-31 | 1.46 |
| 3 | Earnings drift at announcement · Technology · 21d · LS · step 3 | 2008-01-02 → 2008-12-31 | 1.54 |
| 4 | Earnings drift at announcement · Technology · 21d · LS · step 4 | 2009-01-02 → 2009-12-31 | 1.38 |
| 5 | Earnings drift at announcement · Technology · 21d · LS · step 5 | 2010-01-04 → 2010-12-31 | 1.37 |
| 6 | Earnings drift at announcement · Technology · 21d · LS · step 6 | 2011-01-03 → 2011-12-30 | 1.61 |
| 7 | Earnings drift at announcement · Technology · 21d · LS · step 7 | 2012-01-03 → 2012-12-31 | 0.80 |
| 8 | Earnings drift at announcement · Technology · 21d · LS · step 8 | 2013-01-02 → 2013-12-31 | -0.46 |
| 9 | Earnings drift at announcement · Technology · 21d · LS · step 9 | 2014-01-02 → 2014-12-31 | 0.19 |
| 10 | Earnings drift at announcement · Technology · 21d · LS · step 10 | 2015-01-02 → 2015-12-31 | -0.30 |
| 11 | Earnings drift at announcement · Technology · 21d · LS · step 11 | 2016-01-04 → 2016-12-30 | -0.02 |
| 12 | Earnings drift at announcement · Technology · 21d · LS · step 12 | 2017-01-03 → 2017-12-29 | 0.96 |
| 13 | Earnings drift at announcement · Technology · 21d · LS · step 13 | 2018-01-02 → 2018-12-31 | 0.88 |
| 14 | Earnings drift at announcement · Technology · 21d · LS · step 14 | 2019-01-02 → 2019-12-31 | 1.43 |
| 15 | Earnings drift at announcement · Technology · 21d · LS · step 15 | 2020-01-02 → 2020-12-31 | -0.51 |
| 16 | Earnings drift at announcement · Technology · 21d · LS · step 16 | 2021-01-04 → 2021-12-31 | 1.61 |
| 17 | Earnings drift at announcement · Technology · 21d · LS · step 17 | 2022-01-03 → 2022-12-30 | 0.88 |
| 18 | Earnings drift at announcement · Technology · 21d · LS · step 18 | 2023-01-03 → 2023-12-29 | 0.32 |
| 19 | Earnings drift at announcement · Technology · 21d · LS · step 19 | 2024-01-02 → 2024-12-31 | 1.46 |
| 20 | Earnings drift at announcement · Technology · 21d · LS · step 20 | 2025-01-02 → 2025-12-31 | 0.52 |
2.3 Search accounting
This paper's search is a declared family: the earnings-drift sector grid, two anchors on one pre-registered design: 220 cells - 11 sector books at five holding rungs in two book shapes, walked once with quarterly formation baskets (110 cells) and once with announcement-anchored entries (110 cells), every cell carried to the report stage and floor-refused windows recorded as exclusions, counted at N = 220 evaluated books. Every member is either a registered walk with its own hypothesis and frozen record, or a derived average computed from those frozen records; every member is reported, in the family figure and table, and none was selected away. The count is declared by the author rather than derived from one project's ledger, because the members are sibling registered studies; the declaration names them and is frozen in this artifact. A conservative deflated-Sharpe adjustment for this N appears once, in Appendix A. What the source strategy's author searched before publishing is not knowable from here and is not counted. The registered per-step record below still guarantees each window's hypothesis was hashed and registered before that window was scored.
3 The circuit
The strategy is a circuit of platform primitives, frozen when the study is registered. Below is the circuit as wired on the canvas, the objective it encodes and how the search runs through it, followed by the mathematics each primitive actually computes, the same formulas the execution engine runs. The complete parameterisation is preserved in the study ledger (Appendix A).
The sentence below is the registration record, generated when the circuit was registered and printed verbatim; the authored description of the design is Section 1.
S&P 500, evaluated, and run out-of-sample from the anchor: anything the design estimates from history, where it estimates at all, is re-estimated at each anchor from pre-anchor data only, and the walk advances through registered out-of-sample windows; its disposition is the realized forward path versus the benchmark, is expected to generate positive risk-adjusted returns over the forward test window.
Envelopes show counts, ratios, dates, and the parameters the author chose. Full price and per-name data series are not republished: the underlying market data is licensed to QuanterLab. Point figures quoted in the prose, a named holding's return over a stated span, are summary facts derived from public market prices, not redistributed series.
The objective and the search
| Universe | S&P 500 index constituents. |
|---|---|
| Other components | Forward-test autopsy: Portfolio Forward Autopsy; Study: Announcement-anchored book, Sector book (PIT). |
Cost elements are wired into the circuit, the realised drag is reported per step in Appendix B.
Show the mathematics, 4 primitives, formulas and parity notes
3.1 Universe
The starting set of tickers, resolved point-in-time from the index change-log, so names delisted or removed later still compete on the dates they traded.
Before any math, you need a list of stocks. An index preset (S&P 500, Nasdaq-100, Dow 30) is reconstructed as it stood ON your anchor date by replaying the historical add/drop change-log backwards, so a 2018 backtest sees the 2018 membership, not today's winners.
Start from today's constituents and un-apply every membership change after the anchor t:
\mathcal{U}(t) = \mathcal{U}_{\text{now}} \;\ominus\; \{\text{adds after } t\} \;\oplus\; \{\text{drops after } t\}3.2 Custom Sector Book
Filters the point-in-time index membership to one sector through a dated map, so the 2016, 2018 and 2023 redraws apply on their effective dates and a name is judged by the label it wore that day.
Keeps the names of one sector as of the run date, from a frozen table: the vendor's current sector label with dated overrides for the classification redraws inside the record. Names with no label are dropped and counted.
3.3 Custom Event Backtest
The announcement book: buys or shorts each company at the close of the first session its own number is known, judged against the sector’s trailing-year SUE quintiles, holds exactly the rung, and pays tiered spreads both ways plus 50 basis points of borrow on the short side.
Event-time forward test: each name is bought (or shorted) at the close of the first session its own announcement is known, held for exactly the rung, and exited at that close - no formation calendar. Entry rule, declared once: a surprise qualifies long at or above the 80th and short at or below the 20th nearest-rank percentile of the sector's own trailing year of SUEs, at least fifteen in the pool, and the sign must agree with the leg - a zero surprise never enters.
3.4 Portfolio Forward Autopsy
The post-mortem, where the forward test’s return actually came from.
Runs after the Portfolio Forward Test and dissects its realized path: per-rebalance contributions, winners and losers, exposure and cash periods, and how the realized route compares to what the risk cones projected. It computes nothing new about the future, it explains the past the book just lived.
Depth I–IV: headline attribution, per-segment breakdown, per-name contributions, and the calibration ledger (projected cone vs realized, segment by segment). In a study, this is the node that fills the appendices.
4 Discussion
4.1 Interpretation
The literature said both of these things; it just said them fifty years apart. Ball and Brown found the drift in 1968 on announcement-relative time. Bernard and Thomas measured its decay inside sixty days in 1989. Chan, Jegadeesh and Lakonishok carried it into portfolio practice in 1996 on monthly formation, and the factor industry inherited that calendar. Martineau, reading modern large caps on formation-style designs, declared the drift dead in 2021. This grid holds all of it at once: the formation wave reproduces the disappearance, the announcement wave reproduces the original finding, and the rung profile shows why both are measurements of the same object. The anomaly did not vanish; the market's absorption of the number got faster than the quarterly calendar built to harvest it.
The sector map adds the part the pooled literature averages away. Three camps, declared as the design intended: drift that survives immediate entry (Technology, Industrials, Consumer Cyclical, Energy, Financials at the short rungs), a sector that reverses under every anchor (Utilities), and rows where nothing survives costs in either frame (Consumer Defensive, Basic Materials, Real Estate, and the young Communication Services record). A pooled index book blends all three and reports the average, which is how a live effect and a dead one can share a decade of literature.
What a reader can check: every one of the 220 cells is a page on this platform with its sealed prospectus, its per-window reports, its exclusions printed, and the family of 220 in the footer. This page is the announcement-entered Technology cell at 21 days; its formation twin is registered under the same title without the anchor clause, and the grid tables above name every other cell.
This study is one member of a declared search family: the same design walked at several settings across sibling registered projects, every member either a registered walk with its own frozen record or a derived average of those records, and every member reported. The family size is declared by the author and named in the lineage; it is the search-accounting count for this paper. What was searched before the source strategy was published is not knowable from here and is not counted.
4.2 Limitations
One era: 2006 through 2025, one bull-heavy market regime, and the two short-record sectors carry 13 and 10 announcement windows against everyone else's 20, with the Communication Services record before the September 2018 redraw made of the never-relabeled telecom and media names, admitted from 2013 in the announcement run and 2019 in the quarterly; Real Estate enters from 2016 and 2017 the same way. Daily closes only: entry is the close of the first session the announcement is known, so the overnight gap and the first day's reaction are excluded by construction, which understates what faster execution captures and is the version a daily-data reader can reproduce. Costs are tiered spreads without market impact, fair for five-name large-cap books and untested at size; borrow is a flat 50 basis points and ignores scarcity. One surprise measure by design; other definitions were not run and are not claimed. The consensus history is one vendor's record. The announcement long-short book floats its legs, and Technology's +0.23 tilt means part of that row is market exposure, quantified in Table 6 and the attribution paragraph. Exclusions are concentrated where the design predicted, in the two young sectors before their redraw dates, and every one is printed on its study page.
Where the story stops: the grid is measured, and nothing here has been deployed. The one open check that could move the headline is a beta-neutral rerun of Technology, whose announcement legs tilt +0.23 long; no other sector's tilt exceeds 0.12, so the rest of the grid does not wait on it. If a hedged Technology row keeps most of its +10.5, the sector story stands alone; if it does not, the row is partly a market bet and this paper has already said which part.
References
- Bailey, D. H., & López de Prado, M. (2014). The Deflated Sharpe Ratio: Correcting for Selection Bias, Backtest Overfitting, and Non-Normality. Journal of Portfolio Management, 40(5), 94–107. doi:10.3905/jpm.2014.40.5.094
- Ball, R., & Brown, P. (1968). An empirical evaluation of accounting income numbers. Journal of Accounting Research, 6(2), 159-178. (First documentation of drift in the direction of the earnings news after the announcement.)
- Bernard, V. L., & Thomas, J. K. (1989). Post-earnings-announcement drift: delayed price response or risk premium? Journal of Accounting Research, 27, 1-36. (The drift concentrated in the weeks after the announcement, fading within roughly sixty days.)
- Bernard, V. L., & Thomas, J. K. (1990). Evidence that stock prices do not fully reflect the implications of current earnings for future earnings. Journal of Accounting and Economics, 13(4), 305-340. (The predictable pattern of returns around subsequent announcements.)
- Chan, L. K. C., Jegadeesh, N., & Lakonishok, J. (1996). Momentum strategies. Journal of Finance, 51(5), 1681-1713. (Earnings momentum on formation-style portfolios; the horizon over which it pays.)
- Chordia, T., Goyal, A., Sadka, G., Sadka, R., & Shivakumar, L. (2009). Liquidity and the post-earnings-announcement drift. Financial Analysts Journal, 65(4), 18-32. (The drift concentrated in illiquid names once trading costs are charged.)
- Martineau, C. (2021). Rest in peace post-earnings announcement drift. Critical Finance Review (forthcoming; SSRN 3111607). (Price discovery of earnings news accelerated; drift in large caps shrank toward zero in recent decades on standard designs.)
Appendix A Reproducibility in QuanterLab
Conservative upper-bound adjustment. Deflating the pooled Sharpe of 0.92 for the declared family count of N = 220 gives a 90% probability that the result is genuinely positive rather than the best of N noisy draws (Bailey & López de Prado, 2014), the strategy is borderline after the correction. Registered candidates are heavily correlated (near-identical variants), so this deflation is an upper bound on the multiple-testing penalty, not a precise correction; the raw count in §2.3 is the primary artifact.
Each step is backed by a frozen run report. The study is re-derivable from the ledger below.
| # | Commit | Report | Anchor | OOS window |
|---|---|---|---|---|
| 1 | f91ef5509b63 | 4473 | 2006-01-01 | 2006-01-03 → 2006-12-29 |
| 2 | a920f9d07296 | 4475 | 2007-01-01 | 2007-01-03 → 2007-12-31 |
| 3 | f1e409f169a9 | 4477 | 2008-01-01 | 2008-01-02 → 2008-12-31 |
| 4 | d3ef372eb640 | 4479 | 2009-01-01 | 2009-01-02 → 2009-12-31 |
| 5 | 11cde3a941fa | 4481 | 2010-01-01 | 2010-01-04 → 2010-12-31 |
| 6 | eb5bb8a14f8d | 4483 | 2011-01-01 | 2011-01-03 → 2011-12-30 |
| 7 | d7455479ed3e | 4485 | 2012-01-01 | 2012-01-03 → 2012-12-31 |
| 8 | a51ab05f64e7 | 4487 | 2013-01-01 | 2013-01-02 → 2013-12-31 |
| 9 | 4be58070a790 | 4489 | 2014-01-01 | 2014-01-02 → 2014-12-31 |
| 10 | c60c83a2d987 | 4491 | 2015-01-01 | 2015-01-02 → 2015-12-31 |
| 11 | 3ddb11f05c9e | 4493 | 2016-01-01 | 2016-01-04 → 2016-12-30 |
| 12 | 14f65fbdbf42 | 4495 | 2017-01-01 | 2017-01-03 → 2017-12-29 |
| 13 | 2c26393dfbb7 | 4497 | 2018-01-01 | 2018-01-02 → 2018-12-31 |
| 14 | fa1bbfd657d0 | 4499 | 2019-01-01 | 2019-01-02 → 2019-12-31 |
| 15 | 153708cdeb21 | 4501 | 2020-01-01 | 2020-01-02 → 2020-12-31 |
| 16 | 1220ebd7ee04 | 4503 | 2021-01-01 | 2021-01-04 → 2021-12-31 |
| 17 | 749d4684d713 | 4505 | 2022-01-01 | 2022-01-03 → 2022-12-30 |
| 18 | 6f0605823742 | 4507 | 2023-01-01 | 2023-01-03 → 2023-12-29 |
| 19 | 613c17e19bb4 | 4509 | 2024-01-01 | 2024-01-02 → 2024-12-31 |
| 20 | 8e9f1c958ea2 | 4511 | 2025-01-01 | 2025-01-02 → 2025-12-31 |
The methods the platform implements, for every study made on it, rest on these works.
- Bailey, D. H., & López de Prado, M. (2014). The Deflated Sharpe Ratio: Correcting for Selection Bias, Backtest Overfitting, and Non-Normality. Journal of Portfolio Management, 40(5), 94–107. doi:10.3905/jpm.2014.40.5.094
- Gelman, A., & Loken, E. (2013). The garden of forking paths: Why multiple comparisons can be a problem, even when there is no “fishing expedition.” Working paper, Columbia University.
- Harvey, C. R., Liu, Y., & Zhu, H. (2016). … and the Cross-Section of Expected Returns. Review of Financial Studies, 29(1), 5–68. doi:10.1093/rfs/hhv059
- Lo, A. W. (2002). The Statistics of Sharpe Ratios. Financial Analysts Journal, 58(4), 36–52. doi:10.2469/faj.v58.n4.2453
Appendix A2 Registration record
What this record does and does not establish. Every window in this study is historical: the data existed before the study began, so this is sequential registration on past windows, not pre-registration in the clinical-trial sense, and no procedure could make it so. What the platform does enforce is order, each step's specification was frozen and hashed before that step was scored, and the walk cannot advance past a step that was never run or close one with a result registered for a different window. The two timestamp columns below are the evidence: read them together and each registration precedes its own run, and each run precedes the next registration. A study whose registrations all post-date its runs would show it here. Wall-clock spacing between registrations varies with the author's schedule and queue latency; the ordering, not the tempo, is the claim.
“S&P 500, evaluated, and run out-of-sample from the anchor: anything the design estimates from history, where it estimates at all, is re-estimated at each anchor from pre-anchor data only, and the walk advances through registered out-of-sample windows; its disposition is the realized forward path versus the benchmark, is expected to generate positive risk-adjusted returns over the forward test window.”
The same hypothesis was registered independently at every step, hashed before each step's out-of-sample window was scored:
| # | Anchor | Registered at (UTC) | Run completed (UTC) |
|---|---|---|---|
| 1 | 2006-01-01 | 2026-09-03 13:17:36 | 2026-09-03 13:17:51 |
| 2 | 2007-01-01 | 2026-09-03 13:17:51 | 2026-09-03 13:18:06 |
| 3 | 2008-01-01 | 2026-09-03 13:18:06 | 2026-09-03 13:18:21 |
| 4 | 2009-01-01 | 2026-09-03 13:18:21 | 2026-09-03 13:18:36 |
| 5 | 2010-01-01 | 2026-09-03 13:18:36 | 2026-09-03 13:18:51 |
| 6 | 2011-01-01 | 2026-09-03 13:18:51 | 2026-09-03 13:19:07 |
| 7 | 2012-01-01 | 2026-09-03 13:19:07 | 2026-09-03 13:19:22 |
| 8 | 2013-01-01 | 2026-09-03 13:19:22 | 2026-09-03 13:19:37 |
| 9 | 2014-01-01 | 2026-09-03 13:19:37 | 2026-09-03 13:19:52 |
| 10 | 2015-01-01 | 2026-09-03 13:19:52 | 2026-09-03 13:20:07 |
| 11 | 2016-01-01 | 2026-09-03 13:20:07 | 2026-09-03 13:20:22 |
| 12 | 2017-01-01 | 2026-09-03 13:20:22 | 2026-09-03 13:20:37 |
| 13 | 2018-01-01 | 2026-09-03 13:20:37 | 2026-09-03 13:20:52 |
| 14 | 2019-01-01 | 2026-09-03 13:20:52 | 2026-09-03 13:21:07 |
| 15 | 2020-01-01 | 2026-09-03 13:21:07 | 2026-09-03 13:21:22 |
| 16 | 2021-01-01 | 2026-09-03 13:21:22 | 2026-09-03 13:21:38 |
| 17 | 2022-01-01 | 2026-09-03 13:21:38 | 2026-09-03 13:21:53 |
| 18 | 2023-01-01 | 2026-09-03 13:21:53 | 2026-09-03 13:22:08 |
| 19 | 2024-01-01 | 2026-09-03 13:22:08 | 2026-09-03 13:22:23 |
| 20 | 2025-01-01 | 2026-09-03 13:22:23 | 2026-09-03 13:22:38 |
Appendix B Per-step diagnostics
Names held is the union across the window: the count of distinct instruments the book touched between the window’s first and last session, not the number it held at one time. A book that rotates monthly touches more names than it holds.
What each step's run actually did beyond its return: the portfolio book's rebalancing and cost drag. Harvested from the frozen run reports, present where the circuit produced them. Cost drag is the gap between the step's return before and after its trading costs, in percentage points of the step's starting capital, so on a book that trades every session and compounds it can exceed the step's own net return.
Open the full per-step grid (20 steps: every rebalance, per window)
Step 1 · 2006-01-03 → 2006-12-29
Portfolio book, rebalanced event · 52 names held · selection: announcement · 59.1% in cash · cost drag 0.83%
Step 2 · 2007-01-03 → 2007-12-31
Portfolio book, rebalanced event · 58 names held · selection: announcement · 55.9% in cash · cost drag 0.86%
Step 3 · 2008-01-02 → 2008-12-31
Portfolio book, rebalanced event · 62 names held · selection: announcement · 54.8% in cash · cost drag 0.94% · 1 name dropped at load (63 selected, 62 held across the window), weights renormalised onto the rest
Step 4 · 2009-01-02 → 2009-12-31
Portfolio book, rebalanced event · 66 names held · selection: announcement · 47.5% in cash · cost drag 1.13%
Step 5 · 2010-01-04 → 2010-12-31
Portfolio book, rebalanced event · 56 names held · selection: announcement · 54.1% in cash · cost drag 0.83%
Step 6 · 2011-01-03 → 2011-12-30
Portfolio book, rebalanced event · 58 names held · selection: announcement · 56.2% in cash · cost drag 0.83% · 1 name dropped at load (59 selected, 58 held across the window), weights renormalised onto the rest
Step 7 · 2012-01-03 → 2012-12-31
Portfolio book, rebalanced event · 70 names held · selection: announcement · 52.4% in cash · cost drag 1.05%
Step 8 · 2013-01-02 → 2013-12-31
Portfolio book, rebalanced event · 73 names held · selection: announcement · 51.4% in cash · cost drag 1.06%
Step 9 · 2014-01-02 → 2014-12-31
Portfolio book, rebalanced event · 72 names held · selection: announcement · 44.1% in cash · cost drag 1.02% · 2 names dropped at load (74 selected, 72 held across the window), weights renormalised onto the rest
Step 10 · 2015-01-02 → 2015-12-31
Portfolio book, rebalanced event · 72 names held · selection: announcement · 45.2% in cash · cost drag 1.05% · 1 name dropped at load (73 selected, 72 held across the window), weights renormalised onto the rest
Step 11 · 2016-01-04 → 2016-12-30
Portfolio book, rebalanced event · 84 names held · selection: announcement · 44.4% in cash · cost drag 1.01% · 1 name dropped at load (85 selected, 84 held across the window), weights renormalised onto the rest
Step 12 · 2017-01-03 → 2017-12-29
Portfolio book, rebalanced event · 82 names held · selection: announcement · 40.6% in cash · cost drag 1.13% · 1 name dropped at load (83 selected, 82 held across the window), weights renormalised onto the rest
Step 13 · 2018-01-02 → 2018-12-31
Portfolio book, rebalanced event · 71 names held · selection: announcement · 46.2% in cash · cost drag 0.74% · 1 name dropped at load (72 selected, 71 held across the window), weights renormalised onto the rest
Step 14 · 2019-01-02 → 2019-12-31
Portfolio book, rebalanced event · 80 names held · selection: announcement · 51.2% in cash · cost drag 0.86% · 1 name dropped at load (81 selected, 80 held across the window), weights renormalised onto the rest
Step 15 · 2020-01-02 → 2020-12-31
Portfolio book, rebalanced event · 93 names held · selection: announcement · 37.9% in cash · cost drag 0.92%
Step 16 · 2021-01-04 → 2021-12-31
Portfolio book, rebalanced event · 55 names held · selection: announcement · 60.6% in cash · cost drag 0.51%
Step 17 · 2022-01-03 → 2022-12-30
Portfolio book, rebalanced event · 81 names held · selection: announcement · 46.8% in cash · cost drag 0.83%
Step 18 · 2023-01-03 → 2023-12-29
Portfolio book, rebalanced event · 78 names held · selection: announcement · 40.7% in cash · cost drag 0.89%
Step 19 · 2024-01-02 → 2024-12-31
Portfolio book, rebalanced event · 78 names held · selection: announcement · 46.2% in cash · cost drag 0.77%
Step 20 · 2025-01-02 → 2025-12-31
Portfolio book, rebalanced event · 77 names held · selection: announcement · 35.3% in cash · cost drag 0.64%