


Hedgefundie’s Excellent Adventure, Tested Apart: What It Did Until the Forum Post, and What Changed Since
Hedgefundie's Excellent Adventure is a well-known strategy built from leveraged funds. A leveraged fund borrows so that it moves more than the market each day. The strategy borrows its name from the film Bill & Ted's Excellent Adventure. Like the film, it travels through time very well, as long as it travels backwards.
It holds two funds. UPRO moves three times as much as the S&P 500 each day. TMF moves three times as much as long-term US Treasury bonds. Stocks and long bonds have often moved in opposite directions. When stocks fell, investors often bought safe government bonds, and bond prices rose. So when one fund falls, the other should hold the portfolio up. In the version most people follow, a little more than half of the money goes into UPRO and the rest into TMF, and the two are set back to those shares once a quarter.
Hedgefundie posted the idea on the Bogleheads forum in February 2019. That forum is mostly known for careful index investing, and the thread drew many followers. Hedgefundie chose the mix by testing it on past years. The years after the post are a fairer test, because nobody could adjust the strategy to fit them. Here the years after the post include 2022, when interest rates rose quickly and stocks and long bonds fell together.
So we asked three questions. Did the strategy beat simply holding SPY, the most common S&P 500 fund, before the post and after it? What did the bonds add? And does a common safety rule, moving to bills while the S&P 500 is below its 200-day average, make it safer?
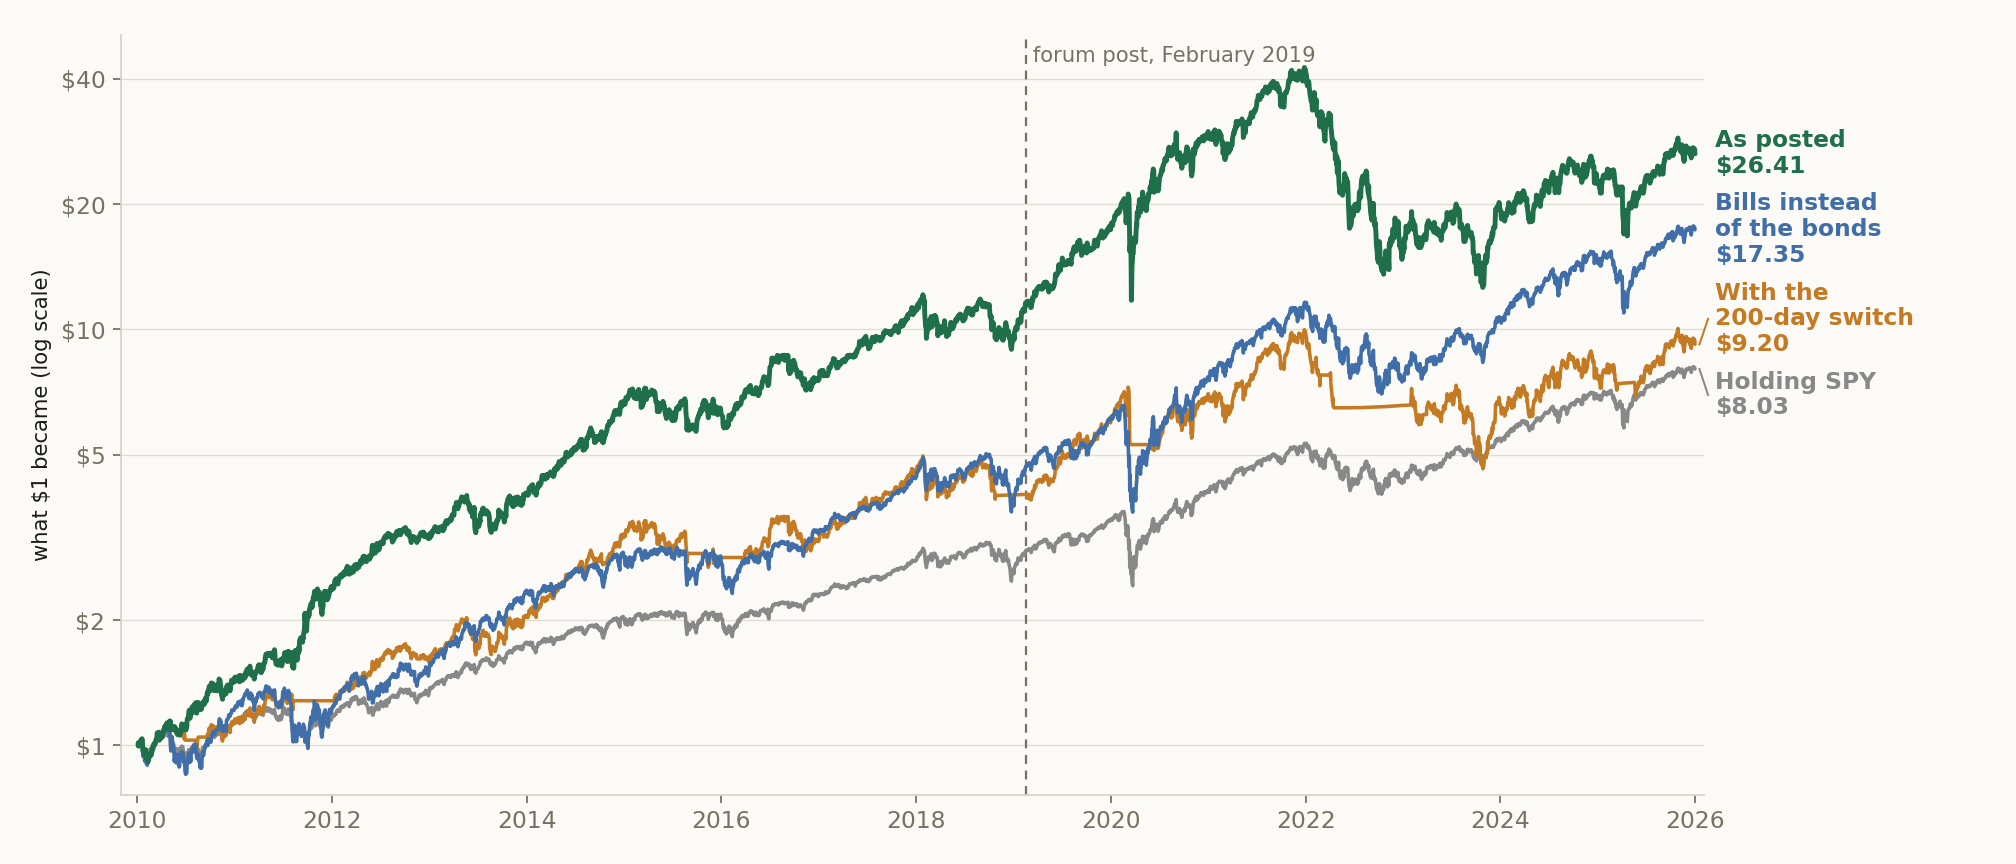
What we found, in short
We tested the strategy one year at a time from 2010, the first full year both funds traded, to 2025, against holding SPY. Then we changed one part at a time. First we put Treasury bills, which work like cash, in place of the bonds. That shows what the bonds added. Then we added the 200-day switch: all the money moves into bills while the S&P 500 is below its 200-day average, a line many investors watch.
The strategy beat holding SPY from 2010 to 2025, ending with more than three times as much money, but it built its whole lead before the post. For three years after the post it pulled further ahead. Then in 2022 stocks and long bonds fell together, the strategy lost almost two thirds of its value, and since the post it has grown less than SPY.
The bonds, the cushion of the earlier years, cost money every year from 2021 to 2025. The 200-day switch halved the loss of 2022, but over the whole test it cost far more than it saved. Risk for risk, the strategy was only level with SPY over the whole test.
Without the bonds, the strategy moves more than one and a half times as much as the market, up and down. With bills instead of the bonds, it beat SPY in six of the seven years since the post, the six years stocks rose.
The rules, and the two changes we tested
The strategy as posted:
1. Put 55% of the money in UPRO and 45% in TMF.
2. Once a quarter, set the two back to those shares.
It makes no forecasts and never times the market.
The first version, in February 2019, used 40% in UPRO and 60% in TMF. Later in 2019 the author moved to 55% and 45%, and that is the version we test.
To see what each part does, we changed one thing at a time:
• Bills instead of the bonds. The same 55% in UPRO, with the other 45% in BIL, a fund of US Treasury bills that works like cash. Each year, the strategy as posted minus this version is what the bonds added or cost.
• With the 200-day switch. The strategy as posted, plus one rule: while the S&P 500 is below its average of the last 200 days, all the money moves into BIL. When the S&P 500 is back above that average, the money goes back to 55% and 45%. Each year, this version minus the strategy as posted is what the switch added or cost.
Holding SPY, the most common S&P 500 fund, is shown beside every result. Each comparison was written down and locked before its first run, each in its own study.
1 Methodology, in detail (click to open)
1 Methodology
The funds. UPRO (ProShares UltraPro S&P500) aims for three times the daily return of the S&P 500. TMF (Direxion Daily 20+ Year Treasury Bull 3X) aims for three times the daily return of an index of US Treasury bonds with more than 20 years to maturity. BIL (SPDR Bloomberg 1-3 Month T-Bill ETF) holds US Treasury bills with one to three months to maturity, so it behaves like cash. SPY is the S&P 500 fund we compare against. All returns include dividends.
The circuit, each step a catalog card:
• A basket of the three funds: UPRO, TMF and BIL (Conviction Basket).
• Fixed weights: 55% UPRO and 45% TMF as posted, or 55% UPRO and 45% BIL for bills instead of the bonds. A fund without a weight is never bought (Portfolio Builder).
• A one-year forward test that sets the weights back every quarter, fills each trade at the next close and shows SPY beside the result (Portfolio Forward Test).
• A cost of 0.05% of every trade (Transaction Cost).
• For the 200-day switch only: SPY against its 200-day average, the line only (SPY DMA Regime). While SPY is below its line, the whole portfolio is held in BIL, bought, valued and charged like any holding. A cross counts once it has held for five trading days.
Each version is the same circuit with one setting changed. Bills instead of the bonds against the strategy as posted is this study. The 200-day switch against the strategy as posted is its companion study (a98d6fb30296), locked and run the same way. The strategy as posted is the same in both, year by year.
The test. Sixteen one-year periods from 2010 to 2025, with every setting fixed before the first period ran. Each year starts in cash at its first close, buys at the second close, and sets the weights back at the start of April, July and October. To join the years end to end, we carry each version through the two days each yearly test leaves out: the first trading day of each later year, and the day from the first close to the second. Each version takes those days as it stood at the previous year's last close (in 2010, as it bought). SPY takes them with its own closes, so every line holds every trading day and SPY's years are its calendar years. The record's own tables leave those days out, so their years can differ from ours by a few points either way. Over the whole test the strategy as posted grows 22.5% a year there and 22.7% here.
Return per unit of risk (Tables 3 and 4) is the Sharpe ratio of the joined daily path: the average daily return divided by the spread of daily returns, scaled to a year, with no risk-free rate taken off.
2 Results
Findings
How the money grew. Figure 1 shows what one dollar became in each version and in SPY. Before the post, the strategy as posted grew far faster than SPY. By the end of 2018, one dollar had become $9.61, against $2.64 in SPY. For three years after the post the strategy pulled further ahead. By the end of 2021 its money had grown more than four times since the post, and SPY's had doubled. Then in 2022 it lost almost two thirds of its value. To make up a loss that size, what is left has to almost triple. Since the post SPY has grown more, though the strategy beat it in five of the seven years, in 2025 by only half a point. Counted from 2020, the first full year of the 55/45 version, the strategy made 7.3% a year and SPY made 15.0% (Table 4). At the end of 2025 the strategy was still well below its high of December 2021. Over all 16 years, one dollar became $26.41 in the strategy and $8.03 in SPY. Risk for risk, it was about level with SPY: its gains were bigger, and so were its swings (Table 3). All three versions beat SPY over the whole test. Since the post, only bills instead of the bonds did.
What the bonds did. Figure 2 shows, for each year, the strategy as posted minus bills instead of the bonds. From 2010 to 2020 the bonds added in eight of the eleven years. They added the most in 2011 and 2020, two years when stocks fell sharply and long bond prices rose, and in 2014, when both rose. They cost the most in 2013, a year when long bond prices fell, and a little in 2015 and 2018. From 2021 to 2025 they cost money every year, most of all in 2022, when stocks and long bonds fell together. In 2023 and 2024 stocks recovered and the bonds held the strategy back.
Bills instead of the bonds. Before the post, this version grew more slowly than the strategy as posted. After the post it grew faster, and it beat SPY in six of the seven years. More than half of its money is still in a fund that moves three times as much as the S&P 500, so its falls were deeper than SPY's. In 2020 it fell further than SPY, and in 2022 it lost a third of its value.
The 200-day switch. Figure 3 shows, for each year, the strategy with the switch minus the strategy as posted. The switch helped a lot in one year, 2022. It moved into bills in mid-April and stayed there for the rest of the year. By then it had already lost about a third, but it missed the rest of the fall, so it ended the year down about a third instead of two thirds. It cost the most in 2011 and 2020, two of the years the bonds helped most. In 2011 the strategy as posted fell less than SPY, because the bonds rose while stocks fell. The switch looks only at the S&P 500, so in August it moved everything, the rising bonds too, into bills and missed the climb that followed. In 2020 it sold partway into the March crash and came back in June, when the strategy as posted was already above its February high. In 2019 and 2023 it started the year in bills, after the falls of late 2018 and 2022, and came back only in mid-February 2019 and late January 2023, after the rebounds had begun. In 2023 it also moved to bills for two weeks in March, and again at the end of October, just before prices turned up in November. Over the whole test, the switch made the strategy grow about 8 points a year more slowly. Its worst fall was smaller than the strategy's, but it still lost more than half of its value from December 2021 to October 2023.
2.1 Headline
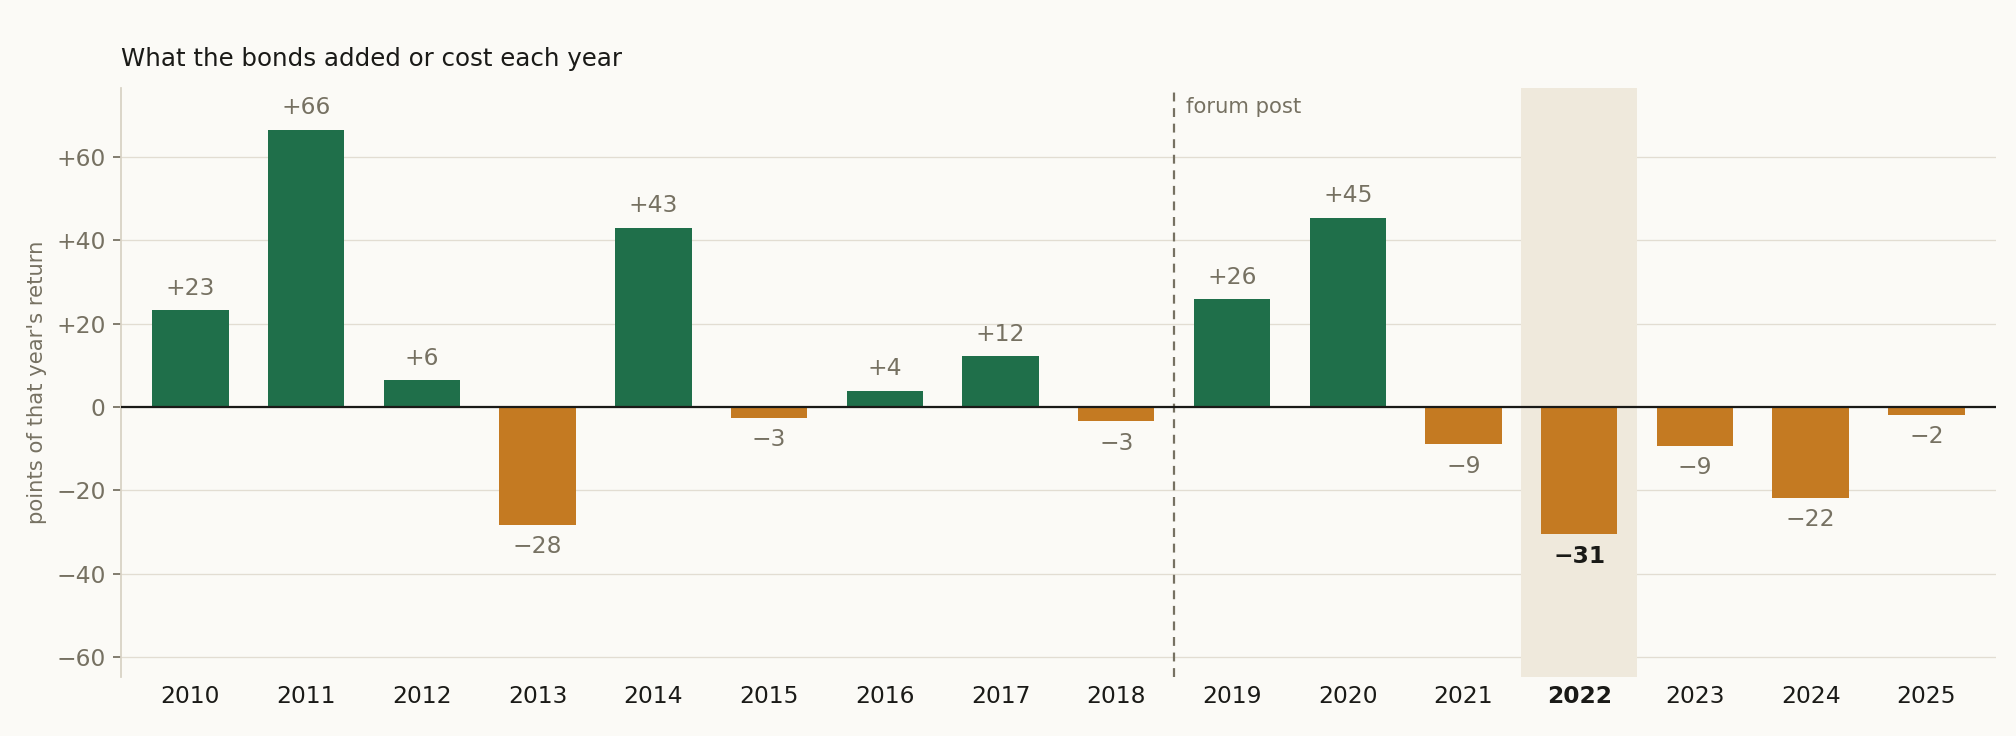
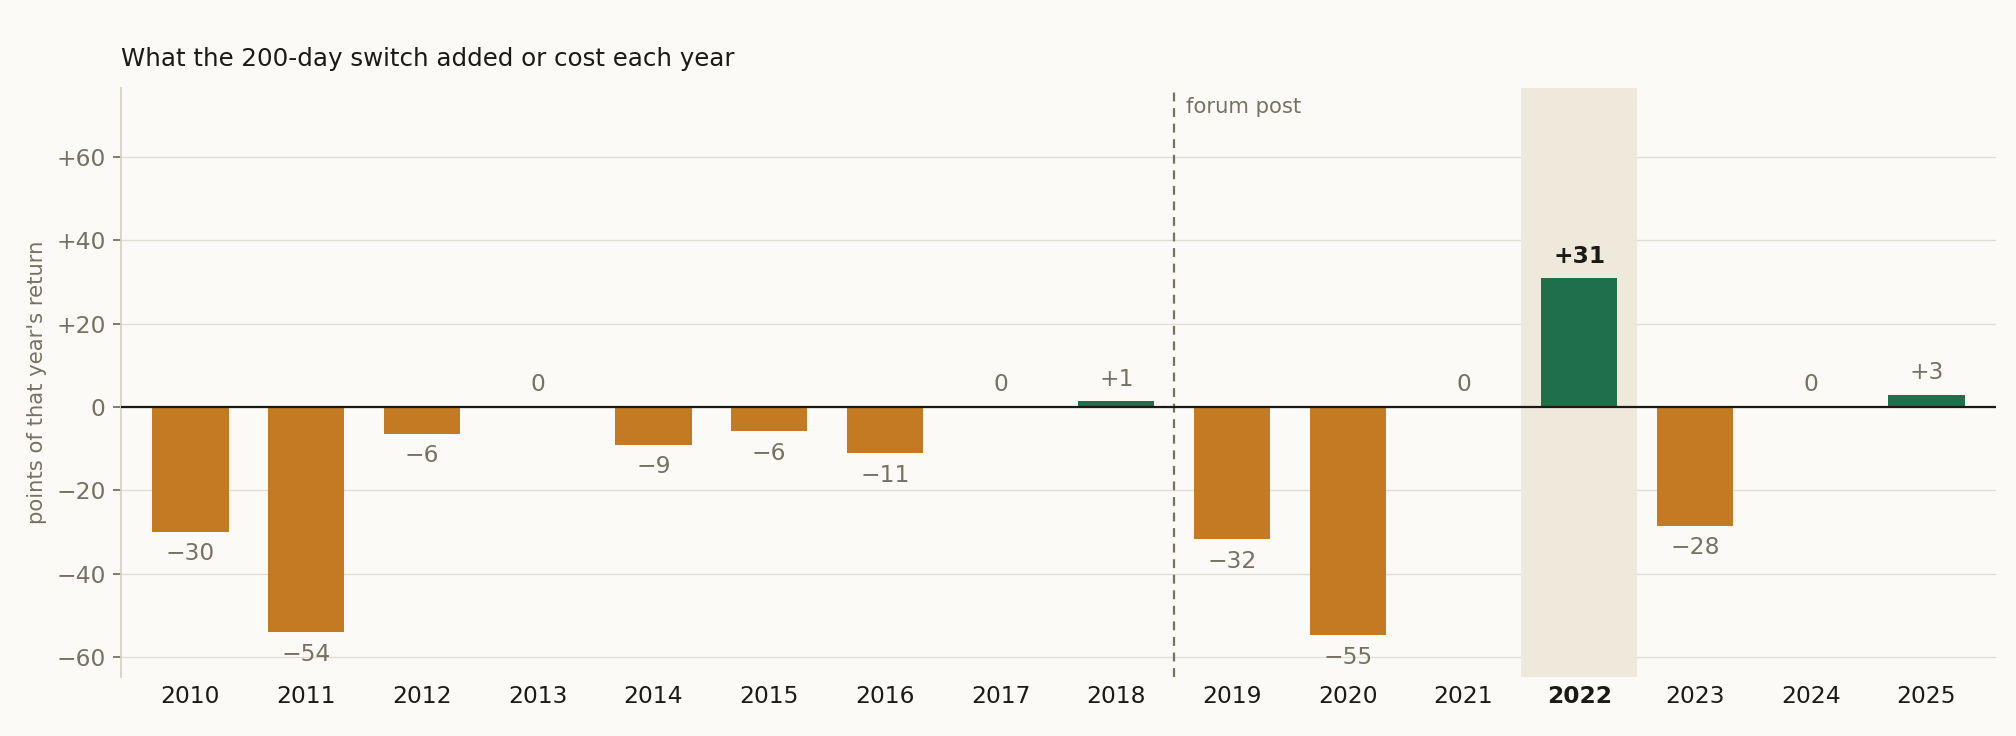
Table 1. Each year's return, dividends included; every trade pays 0.05%. What the bonds added or cost: the strategy as posted minus bills instead of the bonds, in percentage points. What the switch added or cost: the strategy with the 200-day switch minus the strategy as posted. Days in BIL: the share of the year's trading days the switch held the T-bill fund. 2010 runs from its first close; every later year includes its first two trading days, carried as the version stood at the end of the year before.
| Year | As posted | Bills instead of the bonds | With the 200-day switch | Holding SPY | What the bonds added or cost | What the switch added or cost | Switch's days in BIL |
|---|---|---|---|---|---|---|---|
| 2010 | +44.8% | +21.6% | +14.9% | +13.1% | +23.1 | −29.9 | 27% |
| 2011 | +65.3% | −1.0% | +11.3% | +1.9% | +66.4 | −54.0 | 40% |
| 2012 | +31.7% | +25.3% | +25.4% | +16.0% | +6.4 | −6.4 | 4% |
| 2013 | +28.2% | +56.4% | +28.2% | +32.3% | −28.2 | 0.0 | 0% |
| 2014 | +62.9% | +20.0% | +53.9% | +13.5% | +42.9 | −9.0 | 3% |
| 2015 | −4.8% | −2.2% | −10.6% | +1.3% | −2.6 | −5.8 | 22% |
| 2016 | +20.2% | +16.3% | +9.2% | +12.0% | +3.9 | −11.0 | 20% |
| 2017 | +48.0% | +35.9% | +48.0% | +21.7% | +12.1 | 0.0 | 0% |
| 2018 | −13.8% | −10.4% | −12.5% | −4.6% | −3.4 | +1.4 | 18% |
Table 2. The same for the years after the post.
| Year | As posted | Bills instead of the bonds | With the 200-day switch | Holding SPY | What the bonds added or cost | What the switch added or cost | Switch's days in BIL |
|---|---|---|---|---|---|---|---|
| 2019 | +80.6% | +54.9% | +49.0% | +31.2% | +25.8 | −31.7 | 13% |
| 2020 | +72.3% | +26.9% | +17.5% | +18.4% | +45.4 | −54.7 | 23% |
| 2021 | +40.3% | +49.3% | +40.3% | +28.7% | −9.0 | 0.0 | 0% |
| 2022 | −64.0% | −33.5% | −33.2% | −18.2% | −30.5 | +30.8 | 83% |
| 2023 | +30.1% | +39.4% | +1.7% | +26.2% | −9.3 | −28.4 | 13% |
| 2024 | +13.7% | +35.5% | +13.7% | +24.9% | −21.7 | 0.0 | 0% |
| 2025 | +18.2% | +20.1% | +21.2% | +17.7% | −1.9 | +3.0 | 18% |
Table 3. A year on average: the steady yearly growth that turns $1 into the next column's amount. Years ahead of SPY: years more than half a point ahead. Worst fall: the deepest fall from a high on the daily path inside those years. Return per unit of risk: the Sharpe ratio of the daily path. Dividends included; every trade pays 0.05%.
| Years | Version | A year on average | $1 became | Years ahead of SPY | Worst fall | Return per unit of risk |
|---|---|---|---|---|---|---|
| 2010 to 2025 | As posted | 22.7% | $26.41 | 11 of 16 | −70% (Dec 2021 to Oct 2023) | 0.85 |
| Bills instead of the bonds | 19.5% | $17.35 | 12 of 16 | −45% (Feb to Mar 2020) | 0.80 | |
| With the 200-day switch | 14.9% | $9.20 | 8 of 16 | −54% (Dec 2021 to Oct 2023) | 0.74 | |
| Holding SPY | 13.9% | $8.03 | −34% (Feb to Mar 2020) | 0.84 | ||
| 2010 to 2018 | As posted | 28.6% | $9.61 | 6 of 9 | −26% (Jan to Dec 2018) | 1.25 |
| Bills instead of the bonds | 16.4% | $3.92 | 6 of 9 | −29% (Apr to Oct 2011) | 0.76 | |
| With the 200-day switch | 16.7% | $4.00 | 5 of 9 | −23% (Mar to Nov 2015) | 0.90 | |
| Holding SPY | 11.4% | $2.64 | −19% (Sep to Dec 2018) | 0.80 | ||
| 2019 to 2025 | As posted | 15.5% | $2.75 | 5 of 7 | −70% (Dec 2021 to Oct 2023) | 0.58 |
| Bills instead of the bonds | 23.7% | $4.43 | 6 of 7 | −45% (Feb to Mar 2020) | 0.86 | |
| With the 200-day switch | 12.6% | $2.30 | 3 of 7 | −54% (Dec 2021 to Oct 2023) | 0.60 | |
| Holding SPY | 17.2% | $3.04 | −34% (Feb to Mar 2020) | 0.90 |
Table 4. The 55/45 version came in August 2019, so Table 3 counts all of 2019, the strategy's best year, as after the post. Counted from 2020, the same columns.
| Years | Version | A year on average | $1 became | Years ahead of SPY | Worst fall | Return per unit of risk |
|---|---|---|---|---|---|---|
| 2020 to 2025 | As posted | 7.3% | $1.52 | 4 of 6 | −70% (Dec 2021 to Oct 2023) | 0.36 |
| Bills instead of the bonds | 19.1% | $2.86 | 5 of 6 | −45% (Feb to Mar 2020) | 0.71 | |
| With the 200-day switch | 7.5% | $1.54 | 2 of 6 | −54% (Dec 2021 to Oct 2023) | 0.39 | |
| Holding SPY | 15.0% | $2.31 | −34% (Feb to Mar 2020) | 0.77 |
Sections 2.2 to 4, the full record: every year, every test, and how each one was run (click to open)
The registration names the two groups compared As posted and Bills instead of bonds; this paper calls them As posted and Bills instead of the bonds.
2.2 Per-step results
| # | Out-of-sample window | As posted SR | Bills instead of the bonds SR | With the 200-day switch SR |
|---|---|---|---|---|
| 1 | 2010-01-04 → 2010-12-31 | 1.70 | 0.82 | 0.73 |
| 2 | 2011-01-03 → 2011-12-30 | 1.85 | 0.11 | 0.67 |
| 3 | 2012-01-03 → 2012-12-31 | 1.87 | 1.08 | 1.53 |
| 4 | 2013-01-02 → 2013-12-31 | 1.23 | 2.32 | 1.23 |
| 5 | 2014-01-02 → 2014-12-31 | 3.04 | 1.17 | 2.74 |
| 6 | 2015-01-02 → 2015-12-31 | -0.09 | 0.16 | -0.39 |
| 7 | 2016-01-04 → 2016-12-30 | 1.05 | 0.94 | 0.58 |
| 8 | 2017-01-03 → 2017-12-29 | 2.75 | 2.67 | 2.75 |
| 9 | 2018-01-02 → 2018-12-31 | -0.49 | -0.38 | -0.51 |
| 10 | 2019-01-02 → 2019-12-31 | 3.32 | 2.44 | 2.42 |
| 11 | 2020-01-02 → 2020-12-31 | 1.31 | 0.73 | 0.55 |
| 12 | 2021-01-04 → 2021-12-31 | 1.53 | 1.99 | 1.53 |
| 13 | 2022-01-03 → 2022-12-30 | -1.73 | -0.95 | -2.23 |
| 14 | 2023-01-03 → 2023-12-29 | 0.81 | 1.62 | 0.21 |
| 15 | 2024-01-02 → 2024-12-31 | 0.69 | 1.68 | 0.69 |
| 16 | 2025-01-02 → 2025-12-31 | 0.62 | 0.74 | 0.89 |
2.3 Search accounting
No search record exists for this design. It was not promoted from a recorded evolving search, so the number of alternatives tried before it, on paper, in another tool, or in the author's head, is unknown. Unknown is a different fact from one: a study with no lineage is not a strategy with one trial, it is a strategy with an unrecorded number of them. Accordingly no count of alternatives tried is claimed, and nothing in this paper is corrected for a search that was never recorded; the number that stands is the raw out-of-sample result plus this disclosure. The registered per-step record below (§4) still guarantees each window's hypothesis was hashed and registered before that window was scored.
2.4 The comparison
Both arms trade the same registered windows, so their returns can be PAIRED: inside each window the two return series are inner-joined date by date and the difference rAs posted − rBills instead of the bonds is the object under test. Because this is ONE pre-declared contrast, frozen at registration before any window was scored, the paired statistic needs no multiple-testing deflation, and the per-arm pooled numbers above are likewise uncorrected, because this design has no recorded search to correct against (§2.3). The paired contrast carries that gap differently from the arm levels: it was declared before each window ran and it is scored on the difference, so no window could be read first and scored after. What the timestamps cannot speak to is how this contrast came to be the declared one, which is the limit §2.3 states.
In the table: Arm A = As posted · Arm B = Bills instead of the bonds.
| # | Window | Paired bars | Arm A | Arm B | Δ | Leader | With the 200-day switch |
|---|---|---|---|---|---|---|---|
| 1 | 2010-01-05 → 2010-12-31 | 251 | +42.7% | +21.0% | +21.7 pp | Arm A | +13.3% |
| 2 | 2011-01-04 → 2011-12-30 | 251 | +64.5% | -2.4% | +66.9 pp | Arm A | +10.8% |
| 3 | 2012-01-04 → 2012-12-31 | 249 | +32.9% | +22.1% | +10.8 pp | Arm A | +25.4% |
| 4 | 2013-01-03 → 2013-12-31 | 251 | +28.2% | +51.0% | -22.8 pp | Arm B | +28.2% |
| 5 | 2014-01-03 → 2014-12-31 | 251 | +65.0% | +22.1% | +42.9 pp | Arm A | +55.8% |
| 6 | 2015-01-05 → 2015-12-31 | 251 | -5.2% | +0.9% | -6.1 pp | Arm B | -11.0% |
| 7 | 2016-01-05 → 2016-12-30 | 251 | +21.8% | +18.8% | +3.0 pp | Arm A | +9.1% |
| 8 | 2017-01-04 → 2017-12-29 | 250 | +43.4% | +33.0% | +10.4 pp | Arm A | +43.4% |
| 9 | 2018-01-03 → 2018-12-31 | 250 | -14.9% | -12.3% | -2.5 pp | Arm B | -13.5% |
| 10 | 2019-01-03 → 2019-12-31 | 251 | +83.8% | +61.3% | +22.6 pp | Arm A | +48.9% |
| 11 | 2020-01-03 → 2020-12-31 | 252 | +65.9% | +26.5% | +39.4 pp | Arm A | +13.2% |
| 12 | 2021-01-05 → 2021-12-31 | 251 | +43.6% | +51.1% | -7.5 pp | Arm B | +43.6% |
| 13 | 2022-01-04 → 2022-12-30 | 250 | -62.9% | -34.1% | -28.8 pp | Arm B | -31.1% |
| 14 | 2023-01-04 → 2023-12-29 | 249 | +24.1% | +38.8% | -14.7 pp | Arm B | +1.7% |
| 15 | 2024-01-03 → 2024-12-31 | 251 | +16.8% | +38.7% | -21.8 pp | Arm B | +16.8% |
| 16 | 2025-01-03 → 2025-12-31 | 249 | +16.6% | +18.3% | -1.6 pp | Arm B | +19.6% |
Paired Sharpe of the difference track: 0.14 · block bootstrap (2000 paths, block 10, seed 1234): P(As posted beats Bills instead of the bonds) = 74.8%.
Window win-rate. As posted led 8 of 16 windows (50.0%), Bills instead of the bonds led 8, and the mean window gap of +6.99 pp points the same way. Widest single window: 2011 at +66.9 pp.
| Period | Windows | As posted | Bills instead of the bonds | Mean gap | As posted led |
|---|---|---|---|---|---|
| All windows | 16 | +29.15% | +22.17% | +6.99 pp | 8/16 |
| Before 2019 | 9 | +30.95% | +17.13% | +13.82 pp | 6/9 |
| 2019 onward | 7 | +26.85% | +28.64% | -1.79 pp | 2/7 |
The two eras disagree by 15.61 pp. The pooled figure is therefore not a standing property of either method, it is dominated by the earlier period. Read the two rows, not the average.
3 The circuit
The strategy is a circuit of platform primitives, frozen when the study is registered. Below is the circuit as wired on the canvas, the objective it encodes and how the search runs through it, followed by the mathematics each primitive actually computes, the same formulas the execution engine runs. The complete parameterisation is preserved in the study ledger (Appendix A).
The sentence below is the registration record, generated when the circuit was registered and printed verbatim; the authored description of the design is Section 1.
A COMPARATIVE study: As posted vs Bills instead of bonds, walked on the same registered out-of-sample windows. As posted: A configured universe, rebalanced quarterly across the selected basket, and run out-of-sample from the anchor: anything the design estimates from history, where it estimates at all, is re-estimated at each anchor from pre-anchor data only, and the walk advances through registered out-of-sample windows; its disposition is the realized forward path versus the benchmark. Bills instead of bonds: A configured universe, rebalanced quarterly across the selected basket, and run out-of-sample from the anchor: anything the design estimates from history, where it estimates at all, is re-estimated at each anchor from pre-anchor data only, and the walk advances through registered out-of-sample windows; its disposition is the realized forward path versus the benchmark. The arms differ in: Portfolio Σ, Fixed weights (T:pct, fixed scheme only): UPRO:55, TMF:45 → UPRO:55, BIL:45. The contrast under test: whether As posted generates better risk-adjusted returns than Bills instead of bonds over the identical out-of-sample windows.
Every block in this study is a card from the platform's catalog: a basket of the three funds, fixed weights of 55% and 45%, a one-year forward test that sets the weights back every quarter with SPY beside it, a cost of 0.05% on every trade, and for the switch, the SPY 200-day average card. You can rebuild every test and change any setting.
Envelopes show counts, ratios, dates, and the parameters the author chose. Full price and per-name data series are not republished: the underlying market data is licensed to QuanterLab. Point figures quoted in the prose, a named holding's return over a stated span, are summary facts derived from public market prices, not redistributed series.
The objective and the search
As posted
| Universe | No explicit universe defined. |
|---|---|
| Validation & out-of-sample | portfolio forward test (holds the weights it is given, re-set at each rebalance) (1y horizon from the anchor, quarterly rebalance, each decision traded at the next day's close, dividends counted); overlays: Transaction Cost. |
| Other components | Combine: Portfolio Σ. |
Bills instead of bonds
The specification is identical to As posted's table above, row for row; the one registered difference between the arms is itemized below.
What differs between the arms, one difference; the comparison is clean:
- paramPortfolio Σ, Fixed weights (T:pct, fixed scheme only): UPRO:55, TMF:45 → UPRO:55, BIL:45
Companion book. With the 200-day switch comes from a companion run of the identical configuration on its own registered anchor schedule. Its results run through this paper's tables under its own name.
Everything else is held identical, so an out-of-sample gap between the arms is attributable to this one change.
Cost elements are wired into the circuit, the realised drag is reported per step in Appendix B.
Show the mathematics, 4 primitives, formulas and parity notes
3.1 Conviction Basket
A hand-picked list of names, your conviction, not a screen.
You type the tickers. With two or more it becomes a basket (routed to portfolio / pairs logic); a single name routes to the single-stock path. No selection math, you ARE the selection.
A user-supplied set 𝒩 = {A, B, C, …}. Routing only: |𝒩| ≥ 2 → basket lane, |𝒩| = 1 → single-name lane.
3.2 Portfolio Builder
From "which names" to "how much of each", the weighting rules.
Turns a basket into capital weights by a simple rule: equal weight, score-weighted, inverse-volatility, or cap-weighted. An optional max-weight cap waterfills the excess onto the under-cap names so nothing is over-concentrated.
w_i^{\text{eq}}=\tfrac1N,\quad w_i^{\text{score}}\propto \text{score}_i,\quad w_i^{\text{ivol}}\propto \tfrac{1}{\sigma_i},\quad w_i^{\text{cap}}\propto \text{mktcap}_iClip any weight above the cap, redistribute the excess proportionally to names still under the cap, and repeat until none exceed it (≤ 24 rounds).
w_i \leftarrow \min(w_i, w_{\max}); \;\; \text{redistribute excess} \propto w_j\,[w_j < w_{\max}]3.3 Portfolio Backtest
Replay the portfolio forward, rebalanced, point-in-time, with costs.
Holds the basket and rebalances on schedule, re-selecting and re-optimizing point-in-time at each rebalance (so it only ever uses information available then), and reports the equity curve, Sharpe, drawdown and trade stats, optionally net of cost and risk overlays.
E_t = E_{t-1}\big(1 + \mathbf w_{t}^{\top}\mathbf r_t - \text{costs}_t\big)\text{DD}_t = \frac{E_t}{\max_{\tau\le t}E_\tau} - 1, \qquad \text{MaxDD} = \min_t \text{DD}_t\text{charge}_t \;=\; \text{loan}_t \cdot \frac{\text{spread}}{252}, \qquad \text{loan}_t = \begin{cases}\max(0,\,-\text{cash}_t) & \text{institutional (netted)}\\ \max(0,\,\text{long MV}_t - E_t) & \text{retail (no netting)}\end{cases}\mathbf w_k = \{\, w_{k,i} : i \in \text{held} \,\}, \qquad \text{cash}_k = 1 - \textstyle\sum_{i \in \text{held}} w_{k,i}3.4 Transaction Cost
Charge for trading, slippage + commission on every turn.
Real trading isn't free. This deducts a cost proportional to how much you trade (turnover), in basis points, so the backtest reflects net, not gross, performance.
\text{cost}_t = \frac{\text{bps}}{10{,}000}\;\times\;\text{turnover}_t, \qquad \text{turnover}_t = \tfrac12\sum_i \lvert w_{i,t}-w_{i,t^-}\rvert4 Projection calibration, pooled across the walk
Every rebalance carried a Monte Carlo cone and a 95% VaR estimated before the segment it is scored against. Two questions, pooled over the whole study: did realized outcomes land inside the band as often as the band claims, and were VaR breaches as frequent as 5%?
This section is produced by the forward tester itself: every portfolio backtest fits the cone and the VaR estimate at each rebalance and scores them against the segment that followed. It does not require, and this circuit does not contain, a Monte Carlo primitive; that primitive is a separate, standalone analysis.
| Arm | Steps | Rebalances | In band | Coverage | Expected | VaR days | Breach rate | Expected |
|---|---|---|---|---|---|---|---|---|
| As posted | 16 | 76 | 57 / 64 | 89.1% ±3.9 | 90.0% | 3960 | 5.58% ±0.365 | 5.0% |
| Bills instead of the bonds | 16 | 76 | 56 / 64 | 87.5% ±4.13 | 90.0% | 3960 | 4.95% ±0.345 | 5.0% |
| With the 200-day switch (companion run) | 16 | 76 | 61 / 64 | 95.3% ±2.64 | 90.0% | 3254 | 4.73% ±0.372 | 5.0% |
± values are binomial standard errors on the estimate. A coverage figure below the expected band means the projection was over-confident; a breach rate above 5% means the same of the risk model. Both forecasts used only data prior to the segment scored.
5 Discussion
5.1 Interpretation
Two things put the strategy behind SPY after the post.
The first is the bonds. From 2010 to 2021 interest rates were low, and in the two big falls of those years, 2011 and 2020, long bond prices rose. That is the cushion the strategy was built on. But bond prices fall when interest rates rise. In 2022 rates rose quickly, long bonds fell in the same year as stocks, and a fund that moves three times as much as long bonds fell much further. The cushion turned into a second loss.
The second is the years the strategy was chosen on. They were mostly years of falling interest rates, when long bond prices rose. The years after the post include 2022, the year the bonds cost the strategy the most.
The 200-day switch helped in 2022 because that fall lasted most of the year, so the switch had time to move to bills. But the switch looks only at the S&P 500, and it moves the bonds too. In 2011 it sold the bonds while they were rising. In 2020 it sold partway into the March crash and missed the rebound. In 2019 and 2023 it came back only after the rebounds had begun. And in 2023 it moved to bills again only after the fall was over: from July to late October the strategy lost more than a third while the S&P 500 lost about a tenth. That year the switch was an umbrella that opened after the rain and closed just before the next shower. Over the whole test it cost more than it saved.
With bills instead of the bonds, what is left is a bet on stocks alone. More than half of the money moves three times as much as the market, so the whole moves more than one and a half times as much. It beat SPY in all twelve years the S&P 500 gained more than two percent, and fell behind in the four years it gained less or fell. Its worst fall, in 2020, took almost half its value, and risk for risk it did a little worse than SPY over the whole test. Since the post, stocks rose in six of the seven years, and it grew faster than SPY.
5.2 Limitations
Sixteen one-year results are not many, and the result after the post rests mostly on one year, 2022. We split at the first post. The 55/45 mix came that August, so 2019, the strategy's best year, counts as after the post. Starting the later years in 2020 leaves it further behind SPY (Table 4).
Both funds started in 2009, so our test cannot show how the strategy would have done in earlier crashes. Longer backtests of this strategy use simulated funds. We use only the funds' own prices.
UPRO and TMF reset their leverage every day and pay fees and borrowing costs. All of that is inside their prices, so it is inside our results. Every trade also pays 0.05% of its value. Taxes are not included.
The switch changes only after the S&P 500 has stayed above or below its 200-day average for five days, and it trades at the next close. We tested one setting of the switch. A faster or slower one is a single change in the lab.
Try it yourself
Every test in this paper can be run again on quanterlab.com, and you can change any setting. Open it in the lab and try, for example:
• the first version of the strategy, 40% UPRO and 60% TMF;
• setting the weights back every month instead of every quarter;
• a 100-day average for the switch instead of 200 days;
• bills instead of the bonds, with a bigger or smaller share in UPRO.
Or ask the lab assistant to build a version for you, in your own words, and watch it build the test step by step. On Practitioner and Research, a version you like can run as a paper trade, with a note on it every morning.
Computed, not featured
The run produced the results below. The author chose not to feature them in this paper; they were computed all the same, are part of the frozen record, and are reproducible from the study's frozen circuit.
- The measurement ladder, 16 windows. The forward tester, per window: the same walk chained price-only, with dividends and net of costs, against the benchmark measured both ways.
References
- Hedgefundie (2019), HEDGEFUNDIE's excellent adventure, Bogleheads forum, February 2019. The first version: 40% UPRO and 60% TMF, set back every quarter. https://www.bogleheads.org/forum/viewtopic.php?t=272007
- Hedgefundie (2019), HEDGEFUNDIE's excellent adventure Part II: The next journey, Bogleheads forum. The 55% UPRO and 45% TMF version tested here. https://www.bogleheads.org/forum/viewtopic.php?t=288192
- Williamson (2025), HEDGEFUNDIE's Excellent Adventure (UPRO/TMF): A Summary, Optimized Portfolio, updated 8 September 2025. The thread's start in February 2019, the quarterly reset and the move to 55/45 in August 2019. https://www.optimizedportfolio.com/hedgefundie-adventure/
- ProShares, UltraPro S&P500 (UPRO): three times the daily return of the S&P 500; fund started 23 June 2009. https://www.proshares.com/our-etfs/leveraged-and-inverse/upro
- Direxion Daily 20+ Year Treasury Bull 3X (TMF): three times the daily return of an index of US Treasury bonds with over 20 years to maturity; fund started 16 April 2009. Fund profile: https://stockanalysis.com/etf/tmf/
- State Street, SPDR Bloomberg 1-3 Month T-Bill ETF (BIL): US Treasury bills with one to three months to maturity; fund started 25 May 2007. https://www.ssga.com/us/en/intermediary/etfs/spdr-bloomberg-1-3-month-t-bill-etf-bil
- Faber (2007), A Quantitative Approach to Tactical Asset Allocation, Journal of Wealth Management 9(4): 69-79. Holding the market only while it is above its long-term average. https://doi.org/10.3905/jwm.2007.674809
Appendix A Reproducibility in QuanterLab
Each step is backed by a frozen run report. The study is re-derivable from the ledger below.
| # | Commit | Report | Anchor | OOS window |
|---|---|---|---|---|
| 1 | 1c5dc648c875 | 14869 | 2010-01-01 | 2010-01-04 → 2010-12-31 |
| 2 | 13a1237f2326 | 14870 | 2011-01-01 | 2011-01-03 → 2011-12-30 |
| 3 | 62c755bb799e | 14872 | 2012-01-01 | 2012-01-03 → 2012-12-31 |
| 4 | 97386ebe8db3 | 14874 | 2013-01-01 | 2013-01-02 → 2013-12-31 |
| 5 | 00fe44d5d81a | 14876 | 2014-01-01 | 2014-01-02 → 2014-12-31 |
| 6 | 32ecea8a5a56 | 14878 | 2015-01-01 | 2015-01-02 → 2015-12-31 |
| 7 | b46844143fbe | 14880 | 2016-01-01 | 2016-01-04 → 2016-12-30 |
| 8 | aea1e3c19500 | 14882 | 2017-01-01 | 2017-01-03 → 2017-12-29 |
| 9 | deadd49e02ca | 14884 | 2018-01-01 | 2018-01-02 → 2018-12-31 |
| 10 | 98ca6d538ba9 | 14886 | 2019-01-01 | 2019-01-02 → 2019-12-31 |
| 11 | 9b43d8833b38 | 14888 | 2020-01-01 | 2020-01-02 → 2020-12-31 |
| 12 | 453313d9a294 | 14890 | 2021-01-01 | 2021-01-04 → 2021-12-31 |
| 13 | e41cc7fce18e | 14892 | 2022-01-01 | 2022-01-03 → 2022-12-30 |
| 14 | c4af6e03760f | 14893 | 2023-01-01 | 2023-01-03 → 2023-12-29 |
| 15 | 074f5a75a463 | 14895 | 2024-01-01 | 2024-01-02 → 2024-12-31 |
| 16 | fafd221cd398 | 14897 | 2025-01-01 | 2025-01-02 → 2025-12-31 |
The methods the platform implements, for every study made on it, rest on these works.
- Gelman, A., & Loken, E. (2013). The garden of forking paths: Why multiple comparisons can be a problem, even when there is no “fishing expedition.” Working paper, Columbia University.
- Harvey, C. R., Liu, Y., & Zhu, H. (2016). … and the Cross-Section of Expected Returns. Review of Financial Studies, 29(1), 5–68. doi:10.1093/rfs/hhv059
- Lo, A. W. (2002). The Statistics of Sharpe Ratios. Financial Analysts Journal, 58(4), 36–52. doi:10.2469/faj.v58.n4.2453
Appendix A2 Registration record
What this record does and does not establish. Every window in this study is historical: the data existed before the study began, so this is sequential registration on past windows, not pre-registration in the clinical-trial sense, and no procedure could make it so. What the platform does enforce is order, each step's specification was frozen and hashed before that step was scored, and the walk cannot advance past a step that was never run or close one with a result registered for a different window. The two timestamp columns below are the evidence: read them together and each registration precedes its own run, and each run precedes the next registration. A study whose registrations all post-date its runs would show it here. Wall-clock spacing between registrations varies with the author's schedule and queue latency; the ordering, not the tempo, is the claim.
“A COMPARATIVE study: As posted vs Bills instead of bonds, walked on the same registered out-of-sample windows. As posted: A configured universe, rebalanced quarterly across the selected basket, and run out-of-sample from the anchor: anything the design estimates from history, where it estimates at all, is re-estimated at each anchor from pre-anchor data only, and the walk advances through registered out-of-sample windows; its disposition is the realized forward path versus the benchmark. Bills instead of bonds: A configured universe, rebalanced quarterly across the selected basket, and run out-of-sample from the anchor: anything the design estimates from history, where it estimates at all, is re-estimated at each anchor from pre-anchor data only, and the walk advances through registered out-of-sample windows; its disposition is the realized forward path versus the benchmark. The arms differ in: Portfolio Σ, Fixed weights (T:pct, fixed scheme only): UPRO:55, TMF:45 → UPRO:55, BIL:45. The contrast under test: whether As posted generates better risk-adjusted returns than Bills instead of bonds over the identical out-of-sample windows.”
The same hypothesis was registered independently at every step, hashed before each step's out-of-sample window was scored:
| # | Anchor | Registered at (UTC) | Run completed (UTC) |
|---|---|---|---|
| 1 | 2010-01-01 | 2026-10-16 15:39:27 | 2026-10-16 15:39:31 |
| 2 | 2011-01-01 | 2026-10-16 15:39:31 | 2026-10-16 15:39:38 |
| 3 | 2012-01-01 | 2026-10-16 15:39:38 | 2026-10-16 15:39:42 |
| 4 | 2013-01-01 | 2026-10-16 15:39:42 | 2026-10-16 15:39:48 |
| 5 | 2014-01-01 | 2026-10-16 15:39:48 | 2026-10-16 15:39:55 |
| 6 | 2015-01-01 | 2026-10-16 15:39:55 | 2026-10-16 15:40:01 |
| 7 | 2016-01-01 | 2026-10-16 15:40:01 | 2026-10-16 15:40:05 |
| 8 | 2017-01-01 | 2026-10-16 15:40:05 | 2026-10-16 15:40:12 |
| 9 | 2018-01-01 | 2026-10-16 15:40:12 | 2026-10-16 15:40:20 |
| 10 | 2019-01-01 | 2026-10-16 15:40:20 | 2026-10-16 15:40:26 |
| 11 | 2020-01-01 | 2026-10-16 15:40:27 | 2026-10-16 15:40:33 |
| 12 | 2021-01-01 | 2026-10-16 15:40:33 | 2026-10-16 15:40:41 |
| 13 | 2022-01-01 | 2026-10-16 15:40:41 | 2026-10-16 15:40:50 |
| 14 | 2023-01-01 | 2026-10-16 15:40:50 | 2026-10-16 15:40:56 |
| 15 | 2024-01-01 | 2026-10-16 15:40:56 | 2026-10-16 15:41:00 |
| 16 | 2025-01-01 | 2026-10-16 15:41:00 | 2026-10-16 15:41:06 |
The companion comparison
This paper reads a second registered study beside its own. Its registration is printed here from its own record, in the same form as the table above: the hypothesis as it was registered, the day it was first locked, the time each window was registered and run, and what each window returned.
With the 200-day switch
Its hypothesis was first locked on 16 October 2026, before its first window was run that day.
The same hypothesis was registered again, unchanged, at each of its 16 windows:
“A COMPARATIVE study: As posted vs With the market switch, walked on the same registered out-of-sample windows. As posted: A configured universe, rebalanced quarterly across the selected basket, and run out-of-sample from the anchor: anything the design estimates from history, where it estimates at all, is re-estimated at each anchor from pre-anchor data only, and the walk advances through registered out-of-sample windows; its disposition is the realized forward path versus the benchmark. With the market switch: A configured universe, rebalanced quarterly across the selected basket, conditioned on the wired regime classifier, and run out-of-sample from the anchor: anything the design estimates from history, where it estimates at all, is re-estimated at each anchor from pre-anchor data only, and the walk advances through registered out-of-sample windows; its disposition is the realized forward path versus the benchmark. The arms differ in: SPY DMA Regime, added in With the market switch. The contrast under test: whether As posted generates better risk-adjusted returns than With the market switch over the identical out-of-sample windows.”
| # | Anchor | Registered at (UTC) | Run completed (UTC) |
|---|---|---|---|
| 1 | 2010-01-01 | 2026-10-16 15:39:27 | 2026-10-16 15:39:31 |
| 2 | 2011-01-01 | 2026-10-16 15:39:31 | 2026-10-16 15:39:40 |
| 3 | 2012-01-01 | 2026-10-16 15:39:40 | 2026-10-16 15:39:46 |
| 4 | 2013-01-01 | 2026-10-16 15:39:46 | 2026-10-16 15:39:52 |
| 5 | 2014-01-01 | 2026-10-16 15:39:52 | 2026-10-16 15:39:56 |
| 6 | 2015-01-01 | 2026-10-16 15:39:57 | 2026-10-16 15:40:03 |
| 7 | 2016-01-01 | 2026-10-16 15:40:03 | 2026-10-16 15:40:11 |
| 8 | 2017-01-01 | 2026-10-16 15:40:11 | 2026-10-16 15:40:19 |
| 9 | 2018-01-01 | 2026-10-16 15:40:19 | 2026-10-16 15:40:26 |
| 10 | 2019-01-01 | 2026-10-16 15:40:26 | 2026-10-16 15:40:32 |
| 11 | 2020-01-01 | 2026-10-16 15:40:32 | 2026-10-16 15:40:40 |
| 12 | 2021-01-01 | 2026-10-16 15:40:41 | 2026-10-16 15:40:49 |
| 13 | 2022-01-01 | 2026-10-16 15:40:49 | 2026-10-16 15:40:57 |
| 14 | 2023-01-01 | 2026-10-16 15:40:57 | 2026-10-16 15:41:05 |
| 15 | 2024-01-01 | 2026-10-16 15:41:06 | 2026-10-16 15:41:10 |
| 16 | 2025-01-01 | 2026-10-16 15:41:10 | 2026-10-16 15:41:14 |
| # | Anchor | As posted | With the market switch |
|---|---|---|---|
| 1 | 2010-01-01 | +42.7% | +13.3% |
| 2 | 2011-01-01 | +64.5% | +10.8% |
| 3 | 2012-01-01 | +32.9% | +25.4% |
| 4 | 2013-01-01 | +28.2% | +28.2% |
| 5 | 2014-01-01 | +65.0% | +55.8% |
| 6 | 2015-01-01 | -5.2% | -11.0% |
| 7 | 2016-01-01 | +21.8% | +9.1% |
| 8 | 2017-01-01 | +43.4% | +43.4% |
| 9 | 2018-01-01 | -14.9% | -13.5% |
| 10 | 2019-01-01 | +83.8% | +48.9% |
| 11 | 2020-01-01 | +65.9% | +13.2% |
| 12 | 2021-01-01 | +43.6% | +43.6% |
| 13 | 2022-01-01 | -62.9% | -31.1% |
| 14 | 2023-01-01 | +24.1% | +1.7% |
| 15 | 2024-01-01 | +16.8% | +16.8% |
| 16 | 2025-01-01 | +16.6% | +19.6% |
Appendix B Per-step diagnostics
Realized in the projection tables below is the risk engine scoring its own forecast: the buy-and-hold return of the segment that followed each rebalance, on the same gross basis the cone was projected on. It is deliberately not the charged, calendar-window total return the study’s tables print, so the two will not reconcile line by line; the cone and its outcome share one basis, which is what a calibration test requires. Each row names its segment’s span so a boundary session is visible.
Names held is the union across the window: the count of distinct instruments the book touched between the window’s first and last session, not the number it held at one time. A book that rotates monthly touches more names than it holds.
What each step's run actually did beyond its return: the portfolio book's rebalancing and cost drag. Harvested from the frozen run reports, present where the circuit produced them. Cost drag is the gap between the step's return before and after its trading costs, in percentage points of the step's starting capital, so on a book that trades every session and compounds it can exceed the step's own net return.
Open the full per-step grid (16 steps: every rebalance, per window)
Step 1 · 2010-01-04 → 2010-12-31
As posted
Portfolio book, rebalanced quarterly · 5 constructions · 2 names held · selection: reselect · 0.4% in cash · turnover 1.7× · cost drag 0.09%
Projection accuracy, realized outcome fell inside the P5–P95 cone in 100.0% of 4 scored rebalances (a well-calibrated 90% band contains ~90.0%) · 95% VaR breached on 5.24% of 248 days (expected ~5.0%)
| Rebalance | P5 | Median | P95 | Realized | In band | VaR 95 (1d) | Breaches |
|---|---|---|---|---|---|---|---|
| 2010-01-01 → 2010-04-01 | -14.8384% | 10.2496% | 39.3968% | 5.3834% | yes | 2.6848% | 2 / 60 |
| 2010-04-01 → 2010-07-01 | -12.5861% | 9.9168% | 38.3968% | -1.5419% | yes | 2.6144% | 4 / 62 |
| 2010-07-01 → 2010-10-01 | -15.5201% | 7.7097% | 34.426% | 26.5768% | yes | 2.6817% | 2 / 63 |
| 2010-10-01 → 2011-01-01 | -12.0612% | 11.2235% | 37.799% | 1.1414% | yes | 2.594% | 5 / 63 |
| 2011-01-01 | no segment follows this rebalance, not scored | ||||||
Bills instead of the bonds
Portfolio book, rebalanced quarterly · 5 constructions · 2 names held · selection: reselect · 0.4% in cash · turnover 1.4× · cost drag 0.07%
Projection accuracy, realized outcome fell inside the P5–P95 cone in 75.0% of 4 scored rebalances (a well-calibrated 90% band contains ~90.0%) · 95% VaR breached on 4.84% of 248 days (expected ~5.0%)
| Rebalance | P5 | Median | P95 | Realized | In band | VaR 95 (1d) | Breaches |
|---|---|---|---|---|---|---|---|
| 2010-01-01 → 2010-04-01 | -8.7319% | 15.3704% | 42.7446% | 5.7121% | yes | 2.9766% | 3 / 60 |
| 2010-04-01 → 2010-07-01 | -8.2645% | 13.7209% | 41.1515% | -20.25% | no | 2.8708% | 7 / 62 |
| 2010-07-01 → 2010-10-01 | -19.8106% | 4.9186% | 34.0688% | 19.0049% | yes | 3.4948% | 2 / 63 |
| 2010-10-01 → 2011-01-01 | -17.4772% | 7.7725% | 37.4839% | 17.186% | yes | 3.3126% | 0 / 63 |
| 2011-01-01 | no segment follows this rebalance, not scored | ||||||
Step 2 · 2011-01-03 → 2011-12-30
As posted
Portfolio book, rebalanced quarterly · 5 constructions · 2 names held · selection: reselect · 0.4% in cash · turnover 2.0× · cost drag 0.1%
Projection accuracy, realized outcome fell inside the P5–P95 cone in 100.0% of 4 scored rebalances (a well-calibrated 90% band contains ~90.0%) · 95% VaR breached on 5.24% of 248 days (expected ~5.0%)
| Rebalance | P5 | Median | P95 | Realized | In band | VaR 95 (1d) | Breaches |
|---|---|---|---|---|---|---|---|
| 2011-01-01 → 2011-04-01 | -11.9113% | 8.3739% | 35.8834% | 6.4947% | yes | 2.6884% | 1 / 61 |
| 2011-04-01 → 2011-07-01 | -12.2391% | 8.6078% | 34.5732% | 2.9489% | yes | 2.5742% | 2 / 62 |
| 2011-07-01 → 2011-10-01 | -12.6369% | 8.9529% | 33.2661% | 9.8843% | yes | 2.5204% | 9 / 63 |
| 2011-10-01 → 2012-01-01 | -13.9041% | 7.1429% | 33.5045% | 24.4854% | yes | 2.7636% | 1 / 62 |
| 2012-01-01 | no segment follows this rebalance, not scored | ||||||
Bills instead of the bonds
Portfolio book, rebalanced quarterly · 5 constructions · 2 names held · selection: reselect · 0.4% in cash · turnover 1.3× · cost drag 0.07%
Projection accuracy, realized outcome fell inside the P5–P95 cone in 75.0% of 4 scored rebalances (a well-calibrated 90% band contains ~90.0%) · 95% VaR breached on 9.27% of 248 days (expected ~5.0%)
| Rebalance | P5 | Median | P95 | Realized | In band | VaR 95 (1d) | Breaches |
|---|---|---|---|---|---|---|---|
| 2011-01-01 → 2011-04-01 | -13.464% | 8.0808% | 37.7646% | 7.5809% | yes | 2.8464% | 3 / 61 |
| 2011-04-01 → 2011-07-01 | -13.664% | 8.5291% | 36.6086% | -1.0504% | yes | 2.8501% | 2 / 62 |
| 2011-07-01 → 2011-10-01 | -14.5257% | 8.4272% | 34.6982% | -24.954% | no | 2.8092% | 13 / 63 |
| 2011-10-01 → 2012-01-01 | -21.2413% | 1.9159% | 32.0797% | 24.5544% | yes | 3.2643% | 5 / 62 |
| 2012-01-01 | no segment follows this rebalance, not scored | ||||||
Step 3 · 2012-01-03 → 2012-12-31
As posted
Portfolio book, rebalanced quarterly · 4 constructions · 2 names held · selection: reselect · 0.4% in cash · turnover 1.7× · cost drag 0.08%
Projection accuracy, realized outcome fell inside the P5–P95 cone in 100.0% of 4 scored rebalances (a well-calibrated 90% band contains ~90.0%) · 95% VaR breached on 1.63% of 246 days (expected ~5.0%)
| Rebalance | P5 | Median | P95 | Realized | In band | VaR 95 (1d) | Breaches |
|---|---|---|---|---|---|---|---|
| 2012-01-01 → 2012-04-01 | -11.7171% | 8.0896% | 34.8145% | 9.1132% | yes | 2.6841% | 1 / 61 |
| 2012-04-01 → 2012-07-01 | -10.6668% | 9.8774% | 35.3091% | 9.7523% | yes | 2.5217% | 2 / 62 |
| 2012-07-01 → 2012-10-01 | -11.3627% | 8.9876% | 34.1714% | 8.4493% | yes | 2.5217% | 1 / 62 |
| 2012-10-01 → window end | -8.5478% | 9.8424% | 34.1618% | -3.5255% | yes | 2.3679% | 0 / 61 |
Bills instead of the bonds
Portfolio book, rebalanced quarterly · 4 constructions · 2 names held · selection: reselect · 0.4% in cash · turnover 1.3× · cost drag 0.07%
Projection accuracy, realized outcome fell inside the P5–P95 cone in 100.0% of 4 scored rebalances (a well-calibrated 90% band contains ~90.0%) · 95% VaR breached on 1.22% of 246 days (expected ~5.0%)
| Rebalance | P5 | Median | P95 | Realized | In band | VaR 95 (1d) | Breaches |
|---|---|---|---|---|---|---|---|
| 2012-01-01 → 2012-04-01 | -20.4823% | 2.8707% | 36.2558% | 17.8452% | yes | 3.3218% | 0 / 61 |
| 2012-04-01 → 2012-07-01 | -20.2604% | 4.4164% | 36.9444% | -6.1608% | yes | 3.2659% | 2 / 62 |
| 2012-07-01 → 2012-10-01 | -22.4789% | 1.885% | 34.1191% | 9.8285% | yes | 3.2659% | 0 / 62 |
| 2012-10-01 → window end | -17.5691% | 4.3003% | 34.8449% | -1.1837% | yes | 2.9674% | 1 / 61 |
Step 4 · 2013-01-02 → 2013-12-31
As posted
Portfolio book, rebalanced quarterly · 5 constructions · 2 names held · selection: reselect · 0.4% in cash · turnover 1.4× · cost drag 0.07%
Projection accuracy, realized outcome fell inside the P5–P95 cone in 100.0% of 4 scored rebalances (a well-calibrated 90% band contains ~90.0%) · 95% VaR breached on 5.24% of 248 days (expected ~5.0%)
| Rebalance | P5 | Median | P95 | Realized | In band | VaR 95 (1d) | Breaches |
|---|---|---|---|---|---|---|---|
| 2013-01-01 → 2013-04-01 | -10.8073% | 8.7308% | 28.8642% | 10.9061% | yes | 2.3491% | 0 / 59 |
| 2013-04-01 → 2013-07-01 | -8.9431% | 10.4031% | 31.612% | -4.1703% | yes | 1.9795% | 8 / 63 |
| 2013-07-01 → 2013-10-01 | -11.4918% | 8.3411% | 30.2821% | 2.5033% | yes | 2.3451% | 3 / 63 |
| 2013-10-01 → 2014-01-01 | -11.2166% | 8.7053% | 30.7501% | 11.4222% | yes | 2.2348% | 2 / 63 |
| 2014-01-01 | no segment follows this rebalance, not scored | ||||||
Bills instead of the bonds
Portfolio book, rebalanced quarterly · 5 constructions · 2 names held · selection: reselect · 0.4% in cash · turnover 1.3× · cost drag 0.06%
Projection accuracy, realized outcome fell inside the P5–P95 cone in 100.0% of 4 scored rebalances (a well-calibrated 90% band contains ~90.0%) · 95% VaR breached on 1.21% of 248 days (expected ~5.0%)
| Rebalance | P5 | Median | P95 | Realized | In band | VaR 95 (1d) | Breaches |
|---|---|---|---|---|---|---|---|
| 2013-01-01 → 2013-04-01 | -19.6779% | 4.0604% | 29.9366% | 12.5799% | yes | 2.9897% | 1 / 59 |
| 2013-04-01 → 2013-07-01 | -20.1821% | 4.005% | 32.4049% | 4.7306% | yes | 3.017% | 2 / 63 |
| 2013-07-01 → 2013-10-01 | -20.4349% | 3.9334% | 32.6141% | 7.3604% | yes | 2.9879% | 0 / 63 |
| 2013-10-01 → 2014-01-01 | -17.9878% | 6.4015% | 34.9208% | 15.8054% | yes | 2.7884% | 0 / 63 |
| 2014-01-01 | no segment follows this rebalance, not scored | ||||||
Step 5 · 2014-01-02 → 2014-12-31
As posted
Portfolio book, rebalanced quarterly · 5 constructions · 2 names held · selection: reselect · 0.4% in cash · turnover 1.2× · cost drag 0.06%
Projection accuracy, realized outcome fell inside the P5–P95 cone in 100.0% of 4 scored rebalances (a well-calibrated 90% band contains ~90.0%) · 95% VaR breached on 4.03% of 248 days (expected ~5.0%)
| Rebalance | P5 | Median | P95 | Realized | In band | VaR 95 (1d) | Breaches |
|---|---|---|---|---|---|---|---|
| 2014-01-01 → 2014-04-01 | -10.876% | 6.5654% | 25.3538% | 14.545% | yes | 1.9221% | 2 / 60 |
| 2014-04-01 → 2014-07-01 | -9.5668% | 6.535% | 25.6233% | 15.5457% | yes | 1.8636% | 1 / 62 |
| 2014-07-01 → 2014-10-01 | -9.1855% | 7.8485% | 26.1569% | 5.8391% | yes | 1.8471% | 4 / 63 |
| 2014-10-01 → 2015-01-01 | -9.6896% | 7.2542% | 25.4662% | 21.111% | yes | 1.8776% | 3 / 63 |
| 2015-01-01 | no segment follows this rebalance, not scored | ||||||
Bills instead of the bonds
Portfolio book, rebalanced quarterly · 5 constructions · 2 names held · selection: reselect · 0.4% in cash · turnover 1.1× · cost drag 0.06%
Projection accuracy, realized outcome fell inside the P5–P95 cone in 100.0% of 4 scored rebalances (a well-calibrated 90% band contains ~90.0%) · 95% VaR breached on 4.03% of 248 days (expected ~5.0%)
| Rebalance | P5 | Median | P95 | Realized | In band | VaR 95 (1d) | Breaches |
|---|---|---|---|---|---|---|---|
| 2014-01-01 → 2014-04-01 | -11.0633% | 7.5179% | 27.7447% | 3.9981% | yes | 2.1799% | 2 / 60 |
| 2014-04-01 → 2014-07-01 | -9.2892% | 7.0288% | 26.4039% | 7.0563% | yes | 2.0575% | 1 / 62 |
| 2014-07-01 → 2014-10-01 | -9.6756% | 7.4296% | 25.8411% | 0.3376% | yes | 2.0517% | 2 / 63 |
| 2014-10-01 → 2015-01-01 | -8.1969% | 7.7004% | 24.5893% | 9.9272% | yes | 1.8933% | 5 / 63 |
| 2015-01-01 | no segment follows this rebalance, not scored | ||||||
Step 6 · 2015-01-02 → 2015-12-31
As posted
Portfolio book, rebalanced quarterly · 5 constructions · 2 names held · selection: reselect · 0.4% in cash · turnover 1.4× · cost drag 0.07%
Projection accuracy, realized outcome fell inside the P5–P95 cone in 75.0% of 4 scored rebalances (a well-calibrated 90% band contains ~90.0%) · 95% VaR breached on 8.06% of 248 days (expected ~5.0%)
| Rebalance | P5 | Median | P95 | Realized | In band | VaR 95 (1d) | Breaches |
|---|---|---|---|---|---|---|---|
| 2015-01-01 → 2015-04-01 | -8.3247% | 8.8515% | 27.2313% | 5.4225% | yes | 1.9193% | 6 / 60 |
| 2015-04-01 → 2015-07-01 | -8.2453% | 9.2682% | 30.2566% | -13.6273% | no | 2.0754% | 5 / 62 |
| 2015-07-01 → 2015-10-01 | -13.0189% | 5.6355% | 26.1181% | -2.9941% | yes | 2.1655% | 6 / 63 |
| 2015-10-01 → 2016-01-01 | -12.5106% | 6.3842% | 27.1554% | 7.3919% | yes | 2.1186% | 3 / 63 |
| 2016-01-01 | no segment follows this rebalance, not scored | ||||||
Bills instead of the bonds
Portfolio book, rebalanced quarterly · 5 constructions · 2 names held · selection: reselect · 0.4% in cash · turnover 1.1× · cost drag 0.06%
Projection accuracy, realized outcome fell inside the P5–P95 cone in 75.0% of 4 scored rebalances (a well-calibrated 90% band contains ~90.0%) · 95% VaR breached on 9.68% of 248 days (expected ~5.0%)
| Rebalance | P5 | Median | P95 | Realized | In band | VaR 95 (1d) | Breaches |
|---|---|---|---|---|---|---|---|
| 2015-01-01 → 2015-04-01 | -8.7199% | 7.3403% | 24.3687% | 1.0254% | yes | 2.023% | 7 / 60 |
| 2015-04-01 → 2015-07-01 | -9.3064% | 6.2371% | 24.5588% | 0.6307% | yes | 2.1437% | 1 / 62 |
| 2015-07-01 → 2015-10-01 | -10.4692% | 5.7164% | 23.018% | -12.3189% | no | 2.0495% | 11 / 63 |
| 2015-10-01 → 2016-01-01 | -14.6682% | 2.813% | 21.8629% | 10.6402% | yes | 2.2416% | 5 / 63 |
| 2016-01-01 | no segment follows this rebalance, not scored | ||||||
Step 7 · 2016-01-04 → 2016-12-30
As posted
Portfolio book, rebalanced quarterly · 4 constructions · 2 names held · selection: reselect · 0.4% in cash · turnover 1.4× · cost drag 0.07%
Projection accuracy, realized outcome fell inside the P5–P95 cone in 100.0% of 4 scored rebalances (a well-calibrated 90% band contains ~90.0%) · 95% VaR breached on 5.24% of 248 days (expected ~5.0%)
| Rebalance | P5 | Median | P95 | Realized | In band | VaR 95 (1d) | Breaches |
|---|---|---|---|---|---|---|---|
| 2016-01-01 → 2016-04-01 | -12.8042% | 5.7701% | 26.0545% | 15.6407% | yes | 2.1235% | 3 / 60 |
| 2016-04-01 → 2016-07-01 | -11.7022% | 8.0105% | 29.8045% | 11.8827% | yes | 2.0928% | 1 / 63 |
| 2016-07-01 → 2016-10-01 | -12.2625% | 7.4702% | 29.3145% | 2.6441% | yes | 2.0922% | 4 / 63 |
| 2016-10-01 → window end | -12.9637% | 5.9695% | 29.1689% | -10.8397% | yes | 2.1428% | 5 / 62 |
Bills instead of the bonds
Portfolio book, rebalanced quarterly · 4 constructions · 2 names held · selection: reselect · 0.4% in cash · turnover 1.1× · cost drag 0.05%
Projection accuracy, realized outcome fell inside the P5–P95 cone in 100.0% of 4 scored rebalances (a well-calibrated 90% band contains ~90.0%) · 95% VaR breached on 3.63% of 248 days (expected ~5.0%)
| Rebalance | P5 | Median | P95 | Realized | In band | VaR 95 (1d) | Breaches |
|---|---|---|---|---|---|---|---|
| 2016-01-01 → 2016-04-01 | -14.966% | 2.7701% | 22.0717% | 3.9693% | yes | 2.2955% | 6 / 60 |
| 2016-04-01 → 2016-07-01 | -15.4079% | 3.9028% | 25.336% | 2.2741% | yes | 2.4646% | 2 / 63 |
| 2016-07-01 → 2016-10-01 | -16.7867% | 2.63% | 24.2654% | 5.5864% | yes | 2.485% | 1 / 63 |
| 2016-10-01 → window end | -16.2669% | 2.015% | 24.4313% | 6.6634% | yes | 2.485% | 0 / 62 |
Step 8 · 2017-01-03 → 2017-12-29
As posted
Portfolio book, rebalanced quarterly · 5 constructions · 2 names held · selection: reselect · 0.4% in cash · turnover 1.1× · cost drag 0.06%
Projection accuracy, realized outcome fell inside the P5–P95 cone in 100.0% of 4 scored rebalances (a well-calibrated 90% band contains ~90.0%) · 95% VaR breached on 2.02% of 247 days (expected ~5.0%)
| Rebalance | P5 | Median | P95 | Realized | In band | VaR 95 (1d) | Breaches |
|---|---|---|---|---|---|---|---|
| 2017-01-01 → 2017-04-01 | -14.6544% | 2.7303% | 25.7723% | 9.7986% | yes | 2.3083% | 0 / 61 |
| 2017-04-01 → 2017-07-01 | -16.3523% | 1.6998% | 23.7883% | 9.1148% | yes | 2.2163% | 2 / 62 |
| 2017-07-01 → 2017-10-01 | -13.9183% | 3.6493% | 24.9368% | 7.0069% | yes | 2.118% | 1 / 62 |
| 2017-10-01 → 2018-01-01 | -12.5476% | 4.3572% | 24.6578% | 13.564% | yes | 1.9627% | 2 / 62 |
| 2018-01-01 | no segment follows this rebalance, not scored | ||||||
Bills instead of the bonds
Portfolio book, rebalanced quarterly · 5 constructions · 2 names held · selection: reselect · 0.4% in cash · turnover 1.2× · cost drag 0.06%
Projection accuracy, realized outcome fell inside the P5–P95 cone in 100.0% of 4 scored rebalances (a well-calibrated 90% band contains ~90.0%) · 95% VaR breached on 0.81% of 247 days (expected ~5.0%)
| Rebalance | P5 | Median | P95 | Realized | In band | VaR 95 (1d) | Breaches |
|---|---|---|---|---|---|---|---|
| 2017-01-01 → 2017-04-01 | -15.0635% | 1.7772% | 23.9928% | 8.0739% | yes | 2.3605% | 0 / 61 |
| 2017-04-01 → 2017-07-01 | -14.4189% | 2.9352% | 23.9412% | 4.8342% | yes | 2.293% | 1 / 62 |
| 2017-07-01 → 2017-10-01 | -14.3862% | 2.5512% | 22.9682% | 6.3722% | yes | 2.2728% | 1 / 62 |
| 2017-10-01 → 2018-01-01 | -13.2875% | 3.4248% | 23.4845% | 10.02% | yes | 2.2721% | 0 / 62 |
| 2018-01-01 | no segment follows this rebalance, not scored | ||||||
Step 9 · 2018-01-02 → 2018-12-31
As posted
Portfolio book, rebalanced quarterly · 5 constructions · 2 names held · selection: reselect · 0.4% in cash · turnover 1.2× · cost drag 0.06%
Projection accuracy, realized outcome fell inside the P5–P95 cone in 75.0% of 4 scored rebalances (a well-calibrated 90% band contains ~90.0%) · 95% VaR breached on 13.36% of 247 days (expected ~5.0%)
| Rebalance | P5 | Median | P95 | Realized | In band | VaR 95 (1d) | Breaches |
|---|---|---|---|---|---|---|---|
| 2018-01-01 → 2018-04-01 | -10.3403% | 5.9824% | 23.3746% | -7.2135% | yes | 1.7525% | 12 / 60 |
| 2018-04-01 → 2018-07-01 | -10.6499% | 6.5485% | 25.1065% | 8.449% | yes | 1.9487% | 4 / 63 |
| 2018-07-01 → 2018-10-01 | -11.4638% | 4.6985% | 23.932% | 6.3633% | yes | 2.2542% | 0 / 62 |
| 2018-10-01 → 2019-01-01 | -12.275% | 3.315% | 21.7913% | -17.8981% | no | 2.1094% | 17 / 62 |
| 2019-01-01 | no segment follows this rebalance, not scored | ||||||
Bills instead of the bonds
Portfolio book, rebalanced quarterly · 5 constructions · 2 names held · selection: reselect · 0.4% in cash · turnover 1.2× · cost drag 0.06%
Projection accuracy, realized outcome fell inside the P5–P95 cone in 75.0% of 4 scored rebalances (a well-calibrated 90% band contains ~90.0%) · 95% VaR breached on 12.15% of 247 days (expected ~5.0%)
| Rebalance | P5 | Median | P95 | Realized | In band | VaR 95 (1d) | Breaches |
|---|---|---|---|---|---|---|---|
| 2018-01-01 → 2018-04-01 | -10.3808% | 4.5682% | 20.3011% | -3.7093% | yes | 1.8408% | 9 / 60 |
| 2018-04-01 → 2018-07-01 | -9.3702% | 6.5442% | 23.4847% | 8.7384% | yes | 1.5896% | 4 / 63 |
| 2018-07-01 → 2018-10-01 | -9.5023% | 5.0164% | 21.9698% | 11.546% | yes | 1.4916% | 0 / 62 |
| 2018-10-01 → 2019-01-01 | -8.0806% | 5.6901% | 21.6224% | -23.2588% | no | 1.3871% | 17 / 62 |
| 2019-01-01 | no segment follows this rebalance, not scored | ||||||
Step 10 · 2019-01-02 → 2019-12-31
As posted
Portfolio book, rebalanced quarterly · 5 constructions · 2 names held · selection: reselect · 0.4% in cash · turnover 1.6× · cost drag 0.08%
Projection accuracy, realized outcome fell inside the P5–P95 cone in 75.0% of 4 scored rebalances (a well-calibrated 90% band contains ~90.0%) · 95% VaR breached on 2.42% of 248 days (expected ~5.0%)
| Rebalance | P5 | Median | P95 | Realized | In band | VaR 95 (1d) | Breaches |
|---|---|---|---|---|---|---|---|
| 2019-01-01 → 2019-04-01 | -15.3071% | 2.2981% | 21.4467% | 27.5821% | no | 2.4401% | 1 / 60 |
| 2019-04-01 → 2019-07-01 | -12.2894% | 4.9457% | 25.6985% | 13.2279% | yes | 2.4009% | 1 / 62 |
| 2019-07-01 → 2019-10-01 | -12.805% | 5.9357% | 26.5207% | 11.9374% | yes | 2.4343% | 2 / 63 |
| 2019-10-01 → 2020-01-01 | -13.2824% | 5.9499% | 27.1885% | 8.035% | yes | 2.4026% | 2 / 63 |
| 2020-01-01 | no segment follows this rebalance, not scored | ||||||
Bills instead of the bonds
Portfolio book, rebalanced quarterly · 5 constructions · 2 names held · selection: reselect · 0.4% in cash · turnover 1.4× · cost drag 0.07%
Projection accuracy, realized outcome fell inside the P5–P95 cone in 75.0% of 4 scored rebalances (a well-calibrated 90% band contains ~90.0%) · 95% VaR breached on 3.23% of 248 days (expected ~5.0%)
| Rebalance | P5 | Median | P95 | Realized | In band | VaR 95 (1d) | Breaches |
|---|---|---|---|---|---|---|---|
| 2019-01-01 → 2019-04-01 | -14.0027% | 3.0384% | 21.4315% | 21.6711% | no | 2.2701% | 2 / 60 |
| 2019-04-01 → 2019-07-01 | -13.242% | 3.8552% | 24.4517% | 3.819% | yes | 2.362% | 2 / 62 |
| 2019-07-01 → 2019-10-01 | -14.536% | 4.1348% | 24.7% | 0.4178% | yes | 2.5951% | 3 / 63 |
| 2019-10-01 → 2020-01-01 | -16.2051% | 3.2243% | 24.8492% | 16.4499% | yes | 2.6928% | 1 / 63 |
| 2020-01-01 | no segment follows this rebalance, not scored | ||||||
Step 11 · 2020-01-02 → 2020-12-31
As posted
Portfolio book, rebalanced quarterly · 4 constructions · 2 names held · selection: reselect · 0.4% in cash · turnover 2.2× · cost drag 0.11%
Projection accuracy, realized outcome fell inside the P5–P95 cone in 50.0% of 4 scored rebalances (a well-calibrated 90% band contains ~90.0%) · 95% VaR breached on 9.24% of 249 days (expected ~5.0%)
| Rebalance | P5 | Median | P95 | Realized | In band | VaR 95 (1d) | Breaches |
|---|---|---|---|---|---|---|---|
| 2020-01-01 → 2020-04-01 | -12.36% | 5.0086% | 27.9185% | -12.6404% | no | 2.4443% | 10 / 61 |
| 2020-04-01 → 2020-07-01 | -23.9845% | 1.9419% | 36.9445% | 42.0586% | no | 2.7642% | 6 / 62 |
| 2020-07-01 → 2020-10-01 | -21.0602% | 9.0161% | 46.3399% | 13.4063% | yes | 2.7642% | 5 / 63 |
| 2020-10-01 → window end | -21.577% | 9.1074% | 47.4553% | 12.6101% | yes | 3.0163% | 2 / 63 |
Bills instead of the bonds
Portfolio book, rebalanced quarterly · 4 constructions · 2 names held · selection: reselect · 0.4% in cash · turnover 1.7× · cost drag 0.08%
Projection accuracy, realized outcome fell inside the P5–P95 cone in 50.0% of 4 scored rebalances (a well-calibrated 90% band contains ~90.0%) · 95% VaR breached on 9.24% of 249 days (expected ~5.0%)
| Rebalance | P5 | Median | P95 | Realized | In band | VaR 95 (1d) | Breaches |
|---|---|---|---|---|---|---|---|
| 2020-01-01 → 2020-04-01 | -14.122% | 3.3783% | 26.5752% | -34.8423% | no | 2.7427% | 15 / 61 |
| 2020-04-01 → 2020-07-01 | -30.7399% | -3.9113% | 33.5636% | 43.9076% | no | 3.8118% | 5 / 62 |
| 2020-07-01 → 2020-10-01 | -28.7203% | 2.764% | 43.4671% | 13.3473% | yes | 3.9237% | 2 / 63 |
| 2020-10-01 → window end | -29.1054% | 2.8961% | 44.5321% | 18.785% | yes | 4.0853% | 1 / 63 |
Step 12 · 2021-01-04 → 2021-12-31
As posted
Portfolio book, rebalanced quarterly · 5 constructions · 2 names held · selection: reselect · 0.4% in cash · turnover 1.3× · cost drag 0.07%
Projection accuracy, realized outcome fell inside the P5–P95 cone in 100.0% of 4 scored rebalances (a well-calibrated 90% band contains ~90.0%) · 95% VaR breached on 3.23% of 248 days (expected ~5.0%)
| Rebalance | P5 | Median | P95 | Realized | In band | VaR 95 (1d) | Breaches |
|---|---|---|---|---|---|---|---|
| 2021-01-01 → 2021-04-01 | -19.8067% | 11.1103% | 49.4227% | -8.0621% | yes | 3.0169% | 5 / 60 |
| 2021-04-01 → 2021-07-01 | -20.0268% | 9.2729% | 49.5782% | 19.4584% | yes | 3.016% | 1 / 62 |
| 2021-07-01 → 2021-10-01 | -21.0137% | 10.7468% | 50.7336% | -0.0638% | yes | 3.0303% | 1 / 63 |
| 2021-10-01 → 2022-01-01 | -21.8039% | 9.8499% | 49.7753% | 19.5766% | yes | 3.0736% | 1 / 63 |
| 2022-01-01 | no segment follows this rebalance, not scored | ||||||
Bills instead of the bonds
Portfolio book, rebalanced quarterly · 5 constructions · 2 names held · selection: reselect · 0.4% in cash · turnover 1.3× · cost drag 0.06%
Projection accuracy, realized outcome fell inside the P5–P95 cone in 100.0% of 4 scored rebalances (a well-calibrated 90% band contains ~90.0%) · 95% VaR breached on 0.4% of 248 days (expected ~5.0%)
| Rebalance | P5 | Median | P95 | Realized | In band | VaR 95 (1d) | Breaches |
|---|---|---|---|---|---|---|---|
| 2021-01-01 → 2021-04-01 | -27.4605% | 4.7115% | 46.1609% | 12.5493% | yes | 4.0666% | 0 / 60 |
| 2021-04-01 → 2021-07-01 | -24.5046% | 6.273% | 49.8954% | 11.7647% | yes | 3.9123% | 0 / 62 |
| 2021-07-01 → 2021-10-01 | -25.6093% | 7.3121% | 49.8967% | -0.4326% | yes | 3.9123% | 0 / 63 |
| 2021-10-01 → 2022-01-01 | -24.8158% | 8.2522% | 50.9499% | 15.8918% | yes | 3.5478% | 1 / 63 |
| 2022-01-01 | no segment follows this rebalance, not scored | ||||||
Step 13 · 2022-01-03 → 2022-12-30
As posted
Portfolio book, rebalanced quarterly · 5 constructions · 2 names held · selection: reselect · 0.4% in cash · turnover 1.2× · cost drag 0.06%
Projection accuracy, realized outcome fell inside the P5–P95 cone in 75.0% of 4 scored rebalances (a well-calibrated 90% band contains ~90.0%) · 95% VaR breached on 13.77% of 247 days (expected ~5.0%)
| Rebalance | P5 | Median | P95 | Realized | In band | VaR 95 (1d) | Breaches |
|---|---|---|---|---|---|---|---|
| 2022-01-01 → 2022-04-01 | -19.2896% | 8.895% | 51.0053% | -19.1479% | yes | 3.1379% | 7 / 61 |
| 2022-04-01 → 2022-07-01 | -23.8531% | 4.2468% | 46.8785% | -39.7636% | no | 3.6711% | 12 / 61 |
| 2022-07-01 → 2022-10-01 | -25.4031% | 0.3709% | 31.5728% | -25.2798% | yes | 3.7649% | 10 / 63 |
| 2022-10-01 → 2023-01-01 | -30.6801% | -6.6536% | 25.9182% | -1.5395% | yes | 4.1082% | 5 / 62 |
| 2023-01-01 | no segment follows this rebalance, not scored | ||||||
Bills instead of the bonds
Portfolio book, rebalanced quarterly · 5 constructions · 2 names held · selection: reselect · 0.4% in cash · turnover 1.3× · cost drag 0.07%
Projection accuracy, realized outcome fell inside the P5–P95 cone in 75.0% of 4 scored rebalances (a well-calibrated 90% band contains ~90.0%) · 95% VaR breached on 8.91% of 247 days (expected ~5.0%)
| Rebalance | P5 | Median | P95 | Realized | In band | VaR 95 (1d) | Breaches |
|---|---|---|---|---|---|---|---|
| 2022-01-01 → 2022-04-01 | -22.3364% | 6.9375% | 51.62% | -9.2149% | yes | 3.4857% | 3 / 61 |
| 2022-04-01 → 2022-07-01 | -24.6446% | 4.8652% | 50.4125% | -26.7498% | no | 3.5802% | 10 / 61 |
| 2022-07-01 → 2022-10-01 | -18.8167% | 5.9896% | 35.1705% | -10.9257% | yes | 3.2689% | 4 / 63 |
| 2022-10-01 → 2023-01-01 | -21.338% | 0.9044% | 29.6236% | 5.4231% | yes | 3.2689% | 5 / 62 |
| 2023-01-01 | no segment follows this rebalance, not scored | ||||||
Step 14 · 2023-01-03 → 2023-12-29
As posted
Portfolio book, rebalanced quarterly · 5 constructions · 2 names held · selection: reselect · 0.4% in cash · turnover 1.4× · cost drag 0.07%
Projection accuracy, realized outcome fell inside the P5–P95 cone in 75.0% of 4 scored rebalances (a well-calibrated 90% band contains ~90.0%) · 95% VaR breached on 2.85% of 246 days (expected ~5.0%)
| Rebalance | P5 | Median | P95 | Realized | In band | VaR 95 (1d) | Breaches |
|---|---|---|---|---|---|---|---|
| 2023-01-01 → 2023-04-01 | -30.2934% | -5.4734% | 31.8079% | 17.2887% | yes | 4.2278% | 1 / 61 |
| 2023-04-01 → 2023-07-01 | -30.5952% | -5.2277% | 33.1544% | 5.6485% | yes | 4.2647% | 0 / 61 |
| 2023-07-01 → 2023-10-01 | -31.5644% | -4.9551% | 32.2528% | -24.5705% | yes | 4.2278% | 1 / 62 |
| 2023-10-01 → 2024-01-01 | -35.5762% | -10.0119% | 25.9413% | 37.9054% | no | 4.2278% | 5 / 62 |
| 2024-01-01 | no segment follows this rebalance, not scored | ||||||
Bills instead of the bonds
Portfolio book, rebalanced quarterly · 5 constructions · 2 names held · selection: reselect · 0.4% in cash · turnover 1.3× · cost drag 0.07%
Projection accuracy, realized outcome fell inside the P5–P95 cone in 100.0% of 4 scored rebalances (a well-calibrated 90% band contains ~90.0%) · 95% VaR breached on 0.0% of 246 days (expected ~5.0%)
| Rebalance | P5 | Median | P95 | Realized | In band | VaR 95 (1d) | Breaches |
|---|---|---|---|---|---|---|---|
| 2023-01-01 → 2023-04-01 | -20.3288% | 1.7052% | 32.7671% | 11.1994% | yes | 3.3169% | 0 / 61 |
| 2023-04-01 → 2023-07-01 | -21.5469% | 0.3751% | 31.3519% | 11.9509% | yes | 3.2924% | 0 / 61 |
| 2023-07-01 → 2023-10-01 | -23.035% | -0.1193% | 29.8159% | -7.1989% | yes | 3.2706% | 0 / 62 |
| 2023-10-01 → 2024-01-01 | -24.3061% | -1.8079% | 27.5702% | 17.4953% | yes | 3.2351% | 0 / 62 |
| 2024-01-01 | no segment follows this rebalance, not scored | ||||||
Step 15 · 2024-01-02 → 2024-12-31
As posted
Portfolio book, rebalanced quarterly · 4 constructions · 2 names held · selection: reselect · 0.4% in cash · turnover 1.5× · cost drag 0.07%
Projection accuracy, realized outcome fell inside the P5–P95 cone in 100.0% of 4 scored rebalances (a well-calibrated 90% band contains ~90.0%) · 95% VaR breached on 2.02% of 248 days (expected ~5.0%)
| Rebalance | P5 | Median | P95 | Realized | In band | VaR 95 (1d) | Breaches |
|---|---|---|---|---|---|---|---|
| 2024-01-01 → 2024-04-01 | -35.4383% | -7.0775% | 29.3601% | 9.3541% | yes | 4.3927% | 1 / 60 |
| 2024-04-01 → 2024-07-01 | -33.8328% | -6.3053% | 32.9429% | 2.9648% | yes | 4.3927% | 1 / 62 |
| 2024-07-01 → 2024-10-01 | -30.5378% | -0.9018% | 37.0311% | 19.2026% | yes | 4.1263% | 2 / 63 |
| 2024-10-01 → window end | -27.4201% | 1.061% | 36.683% | -12.4966% | yes | 3.9659% | 1 / 63 |
Bills instead of the bonds
Portfolio book, rebalanced quarterly · 4 constructions · 2 names held · selection: reselect · 0.4% in cash · turnover 1.3× · cost drag 0.06%
Projection accuracy, realized outcome fell inside the P5–P95 cone in 100.0% of 4 scored rebalances (a well-calibrated 90% band contains ~90.0%) · 95% VaR breached on 2.82% of 248 days (expected ~5.0%)
| Rebalance | P5 | Median | P95 | Realized | In band | VaR 95 (1d) | Breaches |
|---|---|---|---|---|---|---|---|
| 2024-01-01 → 2024-04-01 | -24.5633% | -0.7986% | 27.2253% | 16.7411% | yes | 3.188% | 0 / 60 |
| 2024-04-01 → 2024-07-01 | -21.8177% | 0.9498% | 30.5411% | 5.614% | yes | 2.993% | 0 / 62 |
| 2024-07-01 → 2024-10-01 | -19.0943% | 4.1505% | 31.1302% | 7.1237% | yes | 2.6074% | 5 / 63 |
| 2024-10-01 → window end | -16.3968% | 4.9711% | 29.1899% | 3.5717% | yes | 2.5378% | 2 / 63 |
Step 16 · 2025-01-02 → 2025-12-31
As posted
Portfolio book, rebalanced quarterly · 5 constructions · 2 names held · selection: reselect · 0.4% in cash · turnover 1.4× · cost drag 0.07%
Projection accuracy, realized outcome fell inside the P5–P95 cone in 100.0% of 4 scored rebalances (a well-calibrated 90% band contains ~90.0%) · 95% VaR breached on 5.69% of 246 days (expected ~5.0%)
| Rebalance | P5 | Median | P95 | Realized | In band | VaR 95 (1d) | Breaches |
|---|---|---|---|---|---|---|---|
| 2025-01-01 → 2025-04-01 | -21.3139% | 5.5374% | 35.7585% | -4.3118% | yes | 3.3442% | 5 / 59 |
| 2025-04-01 → 2025-07-01 | -21.2667% | 0.4558% | 31.0619% | 7.6541% | yes | 3.3353% | 8 / 61 |
| 2025-07-01 → 2025-10-01 | -24.4874% | 3.0151% | 36.7498% | 13.1058% | yes | 3.3938% | 0 / 63 |
| 2025-10-01 → 2026-01-01 | -22.7056% | 4.8368% | 38.4348% | -1.5253% | yes | 3.3353% | 1 / 63 |
| 2026-01-01 | no segment follows this rebalance, not scored | ||||||
Bills instead of the bonds
Portfolio book, rebalanced quarterly · 5 constructions · 2 names held · selection: reselect · 0.4% in cash · turnover 1.3× · cost drag 0.06%
Projection accuracy, realized outcome fell inside the P5–P95 cone in 100.0% of 4 scored rebalances (a well-calibrated 90% band contains ~90.0%) · 95% VaR breached on 7.72% of 246 days (expected ~5.0%)
| Rebalance | P5 | Median | P95 | Realized | In band | VaR 95 (1d) | Breaches |
|---|---|---|---|---|---|---|---|
| 2025-01-01 → 2025-04-01 | -11.5443% | 7.602% | 27.2928% | -8.3443% | yes | 2.3372% | 8 / 59 |
| 2025-04-01 → 2025-07-01 | -12.0501% | 4.0029% | 24.8876% | 14.6573% | yes | 2.3391% | 7 / 61 |
| 2025-07-01 → 2025-10-01 | -15.0277% | 6.8478% | 31.677% | 12.0467% | yes | 2.3834% | 1 / 63 |
| 2025-10-01 → 2026-01-01 | -15.0983% | 6.5259% | 31.0186% | 1.8951% | yes | 2.4468% | 3 / 63 |
| 2026-01-01 | no segment follows this rebalance, not scored | ||||||