

Antonacci's Dual Momentum Taken Apart: Gate, Relative Leg, and Blends Across Four Lookbacks
Antonacci's Global Equities Momentum is two ideas welded together. The famous one is relative momentum: each month, hold the stronger of US and international equity. The quiet one is absolute momentum: first ask whether equities beat Treasury bills at all, and when they do not, stand in bonds. This study takes the weld apart and prices each idea separately, on instruments you can actually buy.
Three books run on the same clock. Dual momentum as published. Absolute momentum only, where the international comparison is deleted and the gate switches SPY against AGG. And relative momentum only, where the gate is welded open and the book holds the stronger of SPY and VEU through everything. Eighteen one-year windows from July 2008, every signal read from total-return series, ten basis points per one-way traded dollar, at four trailing lookbacks and, after those were read, a combined signal. Fifteen registered configurations in ten walks, three derived averages, eighteen evaluated books in all, every one reported; the family matrix in the results section holds the whole search.
Two results hold everywhere. First, the international leg subtracted at every lookback tested: removing VEU improved the strategy by 1.4 to 3.2 points a year, and at the published 12 months the leg won one window of eighteen. Second, the gate's drawdown separation holds across every configuration tested: every book with the gate bottomed between 20 and 35.5 percent, every book without it between 47 and 51, and the two ranges do not touch. How that protection depends on crash speed, 2008 read and sidestepped, 2020 taken whole, is the discussion's subject. The gate bought that protection with one great year, 2008, and paid whipsaw premium in most years after; on net it cost about half a point a year at the published lookback.
The lookback dial is a U, not a shelf: 3 and 12 months work, the middle sags, and dual momentum at 9 months is the worst configuration in the family at 5.7 percent a year. Averaging the four signals into one decision lands in that valley; averaging the four books instead lands near the top, with the second best Sharpe in the family. Both combined runs were added after the eight single-lookback walks were read, are sealed with that admission, and should be discounted accordingly.
The yardstick verdict is stated plainly rather than buried. At the published 12 months the gate on SPY alone beat a monthly 60/40 SPY/AGG on return, 10.7 against 8.80 a year, and cleared it on nothing else: Sharpe 0.73 against 0.77, worst loss 33.7 against 30.1. Exactly one family cell clears 60/40 on Sharpe, the gate alone at 3 months, 0.85 with the smallest drawdown of the eighteen; it is one cell of a declared search and priced as such. The gate is real, and at the published lookback it still does not clear a balanced portfolio on risk-adjusted terms.
Every walk is a registered study on this platform; the circuits, per-window books and frozen records are linked below.
1 Methodology
Instruments, not indices. The published GEM is usually presented on index series reaching back to 1974. This study runs the tradable reading: SPY for US equity, VEU for all-world ex-US, AGG for the bond escape, BIL as the bill series. July 2008 is the first month at which every one of the four carries the full year of history the longest tested lookback reads, so the walk runs eighteen one-year windows anchored each July from 2008 through 2025, with the financial crisis inside the first window.
Every signal reads total returns. This is not a refinement, it is the difference between running the rule and running a different rule. A bill fund's entire return is its yield: priced on raw closes, BIL's trailing return reads near zero and the gate silently degrades into asking whether SPY went up at all. VEU yields roughly three percent to SPY's one and a half, so raw-close relative momentum would handicap the international leg by about the size of the margins being compared. The platform therefore builds each signal series from raw closes with cash distributions reinvested on their ex-dates, the same dividend record the profit and loss is credited from. The declared bill series is BIL's total return; Antonacci's original used the three-month Treasury yield, which is close but not identical, and the choice is stated here so the reader is not left to guess.
The rule, on the strategy's own clock. At each month-end close, compare SPY's trailing total return over the lookback against the same measure on BIL. At or below bills, the coming month is spent in AGG; ties retreat. Above bills, dual momentum holds the stronger of SPY and VEU by the same trailing measure, while the gate-only book holds SPY. Note that the published gate never looks at VEU: international equity is absent from the absolute test by Antonacci's own design, in every arm here. Signals fire on the month-end close and the book earns the new allocation from the next bar.
Costs. Ten basis points per one-way traded dollar, charged wherever the book moves, whether the momentum leg rotates between SPY and VEU or the gate moves the whole book to bonds and back.
The registered family. Each pairing is a two-arm registered study whose arms differ in exactly one sealed field. Dual momentum against absolute momentum only: the offensive book shrinks from the SPY and VEU pair to SPY alone. Dual momentum against relative momentum only: the gate node is welded open. Both pairings ran at trailing lookbacks of 3, 6, 9 and 12 months, eight walks in all, every one reported, none selected after the fact. The published arm is bit-identical across pairings at every lookback, so twelve configurations rest on eight runs and one shared record. The full search this paper draws on, counted in the search accounting of section 2.3, is eighteen evaluated books: those twelve, the three blended-signal books registered afterwards, and the three derived averages. The family matrix in the results section shows every one of them; nothing was run that is not in that table. What Antonacci searched before publishing the 12-month rule is not knowable from here, so this paper counts only its own search.
The combined runs, and their discount. After the eight walks were run and read, two more were registered: the same pairings with both legs reading the equal-weight average of the 3, 6, 9 and 12 month trailing returns, the unweighted cousin of the 13612W blend Keller published. Separately, a derived series averages the four sealed books themselves, a quarter of capital to each lookback, reset at each window boundary, computed from the frozen records without any new run. Both exist to answer the question the eight raise, whether the reader must pick a lookback at all. Both were results-motivated, are sealed or stated with that admission, and carry less evidential weight than the pre-specified eight.
Benchmarks. The platform reference in grey is SPY total return in every study on this site. The study benchmark is 60/40 SPY/AGG, rebalanced monthly from the same total-return series the signals read, shown in purple. GEM never claimed to beat equities; it claimed to cut drawdown, and it is judged here against the portfolio a reader would actually hold instead.
2 Results
Findings
At the published 12-month lookback, over eighteen years: dual momentum returned 394 percent, 9.3 a year, Sharpe 0.63, worst drawdown 33.7 percent. Delete the international leg and the same gate on SPY alone returned 523 percent, 10.7 a year, Sharpe 0.73, the same worst drawdown. Weld the gate open and pure relative momentum returned 438 percent, 9.8 a year, Sharpe 0.56, drawdown 51 percent. SPY itself did 470 percent, 10.15 a year, Sharpe 0.59, drawdown 47.9. The 60/40 line reads 8.80 a year, Sharpe 0.77, worst loss 30.1, and against it the polite framing dissolves: strip the international leg, keep the gate, run it eighteen years at the published lookback, and you finish 1.9 points a year ahead of a monthly 60/40 with a slightly worse Sharpe and a slightly worse worst day. Across the family matrix exactly one book clears 60/40 on Sharpe: the gate alone at 3 months, 0.85, with the smallest drawdown of the eighteen, 22.1. It is a real cell in a declared search, reported like the rest, and one cell of eighteen is what it is. The derived gate-only average of the four lookbacks, Sharpe 0.78, also edges the benchmark, and this paper has already told the reader to discount it.
The international leg's ledger is short. In nine of eighteen windows it did nothing: VEU never out-ranked SPY and the two arms are identical to the decimal. In the other nine it acted, and it won once, 2025, by 3.8 points. Its losses: 11.4 points in the 2009 window, 6.2 in 2020, 4.9 in 2017, 2.9 in 2010, 2.6 in 2012. The book spent 41 of 212 months in VEU and paid for the privilege with 16 of its 25 switches. Removing the leg entirely, which is the one sealed field the first pairing varies, added 1.42 points a year. The same deletion added 1.44 points a year at 3 months, 1.74 at 6, 3.19 at 9. There is no tested speed at which the leg paid. The toll also survives the era split: set aside the two pre-2010 windows, one of which is the crisis, and removing the leg still added 2.1, 1.8, 3.4 and 0.9 points a window at 3, 6, 9 and 12 months over the sixteen windows since. The pre-2010 rows in the era table are two windows and should be read as two windows.
The gate's ledger is one payout and a stream of premiums. In the 2008 window the gate was worth 39.3 points against the welded book: it walked the strategy into AGG while equities halved. It never paid like that again. Its whipsaw years read 14.5 points given back in 2019, 14.2 in 2022, 13.1 in 2015, 11.0 in 2018, 8.7 in 2009, each one a retreat to bonds that equities did not honor. Head to head it won two windows of eighteen, and on net it cost about half a point a year at the published lookback. What it bought is the entire drawdown result: 51 percent worst loss welded open, 33.7 with the gate live, and a Sharpe of 0.63 against 0.56.
The gate filters crash speed, not crash size. The 2008 collapse unfolded over more than a year, slow enough for a month-end rule to read it: the gated books bottomed at 20.9 percent in that whole era, the gate-only book at 15.8, while the ungated book and SPY both halved. March 2020 was the opposite case, a full bear market inside twenty-three sessions, faster than any monthly clock: every book in the study, gated or not, bottomed within half a point of 34 percent on the same day, and that day, not 2009, is the gated books' worst loss in the record. A monthly gate protects against crashes that outlast its clock and eats the ones that do not; both halves of that sentence are in Figure 4.
The lookback dial is a U. Across 3, 6, 9 and 12 months, both gated books do their best work at the ends and sag in the middle. Dual momentum reads 8.9, 6.7, 5.7, 9.3 a year across the four speeds; the gate-only book 10.3, 8.5, 8.9, 10.7. The 9-month dual momentum book is the worst configuration in the family, at barely half of SPY's rate. Drawdown, unlike return, is flat: every gated configuration at every speed bottoms between 20 and 35.5 percent, every ungated one between 46.8 and 51. Only two configurations of fifteen beat SPY's rate of return, the gate-only book at 3 and at 12 months, and both did it with roughly half of SPY's drawdown.
The dial is also a live argument. In 2019 Corey Hoffstein published a fragility case study on GEM, arguing a single lookback is brittle and proposing a composite across several; Antonacci answered that twelve months is the convention the literature supports, citing Jegadeesh and Titman's 3, 6, 9 and 12 month grid. The four lookbacks walked here are that grid, out of sample. This paper does not settle Hoffstein's proposal: his composite ran roughly six to twelve months, and the blend registered here is the equal-weight average of all four. What the family does show is the shape of the neighborhood, a U rather than a cliff, with the published value at one of the two good ends.
Refusing to choose a lookback works only one way. The blended-signal walks, registered after the eight, average the four trailing returns into one decision, and that decision behaves like a mid-speed lookback: dual momentum on the blend returns 6.6 a year, deep in the valley. Averaging the four books instead, a quarter of capital to each, derived from the frozen records, returns 7.8 a year for dual momentum and 9.7 for the gate-only book at Sharpe 0.78, the second best in the whole family, with drawdown near 29. Blending signals buys the average opinion; blending books buys the disagreement between them, and only the second one diversifies.
The switch table below counts where the eighteen years were actually spent. Dual momentum changed instrument 25 times, and 16 of those were the international leg shuffling between SPY and VEU. The gate-only book changed 9 times in eighteen years, one move every two years, and beat everything in the family.
2.1 Headline
| Book | Total return | Per year | Volatility | Sharpe | Worst drawdown | Mean window |
|---|---|---|---|---|---|---|
| Absolute momentum only (no international leg) | +523.4% | 10.70% | 15.6% | 0.73 | -33.7% | +11.55% |
| Benchmark (reference) | +469.9% | 10.15% | 19.9% | 0.59 | -47.9% | +11.23% |
| Relative momentum, blended signal (companion run) | +446.7% | 9.90% | 20.2% | 0.57 | -47.3% | +10.73% |
| Relative momentum only (gate welded open) (companion run) | +437.6% | 9.80% | 20.3% | 0.56 | -51.0% | +10.98% |
| Dual momentum (gate + relative leg) | +393.9% | 9.28% | 16.2% | 0.63 | -33.7% | +10.10% |
| Absolute momentum, blended signal (companion run) | +379.2% | 9.10% | 14.7% | 0.67 | -33.7% | +9.83% |
| 60/40 SPY/AGG, rebalanced monthly (computed) (companion run) | +356.3% | 8.80% | 11.9% | 0.77 | -30.1% | +9.16% |
| Dual momentum, blended signal (companion run) | +214.1% | 6.56% | 15.3% | 0.49 | -35.2% | +7.21% |
Volatility, Sharpe and worst drawdown are computed on each book's own stitched daily series over the identical trading days that Figure 1 draws, so the panel and the figure are the same arithmetic. Sharpe carries no cash hurdle. Mean window is the arithmetic average of the one-year window returns, each from its first close after the opening trade, and does not compound to the total beside it: the difference is volatility drag, plus that opening charge where the walk pays one.
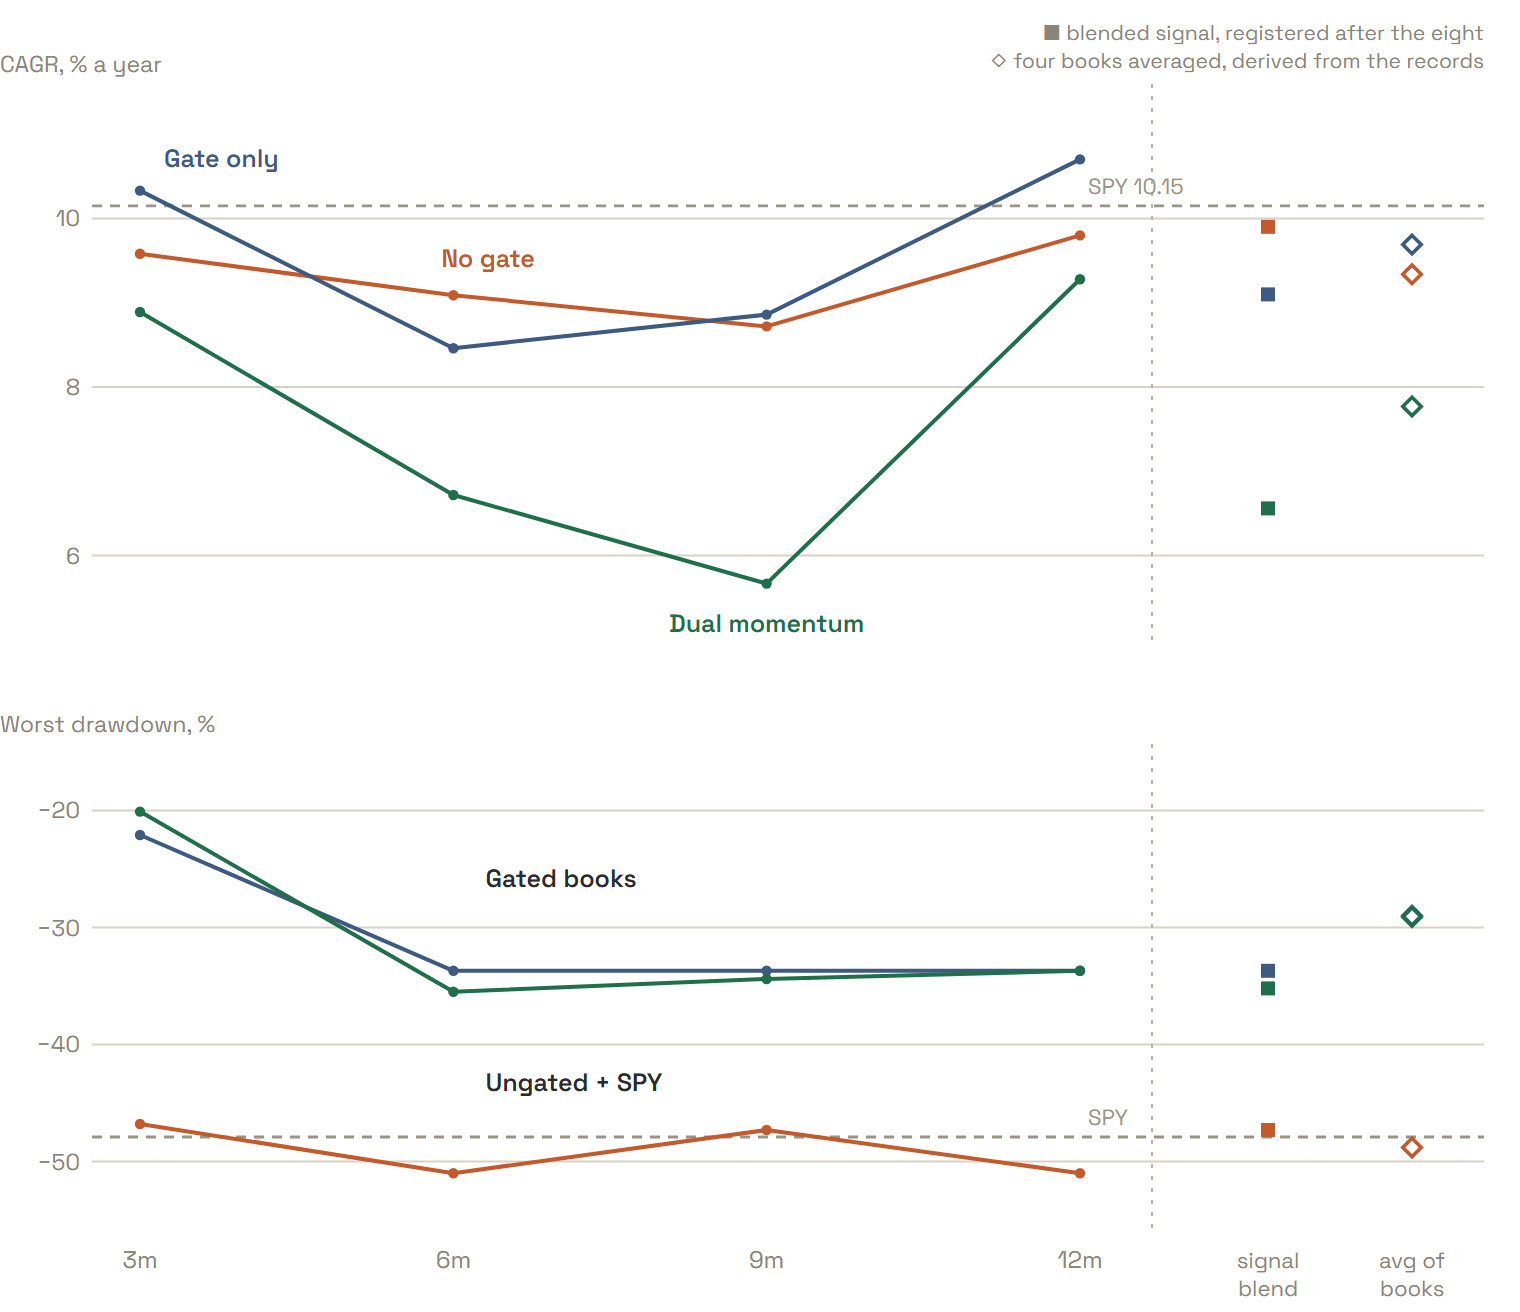
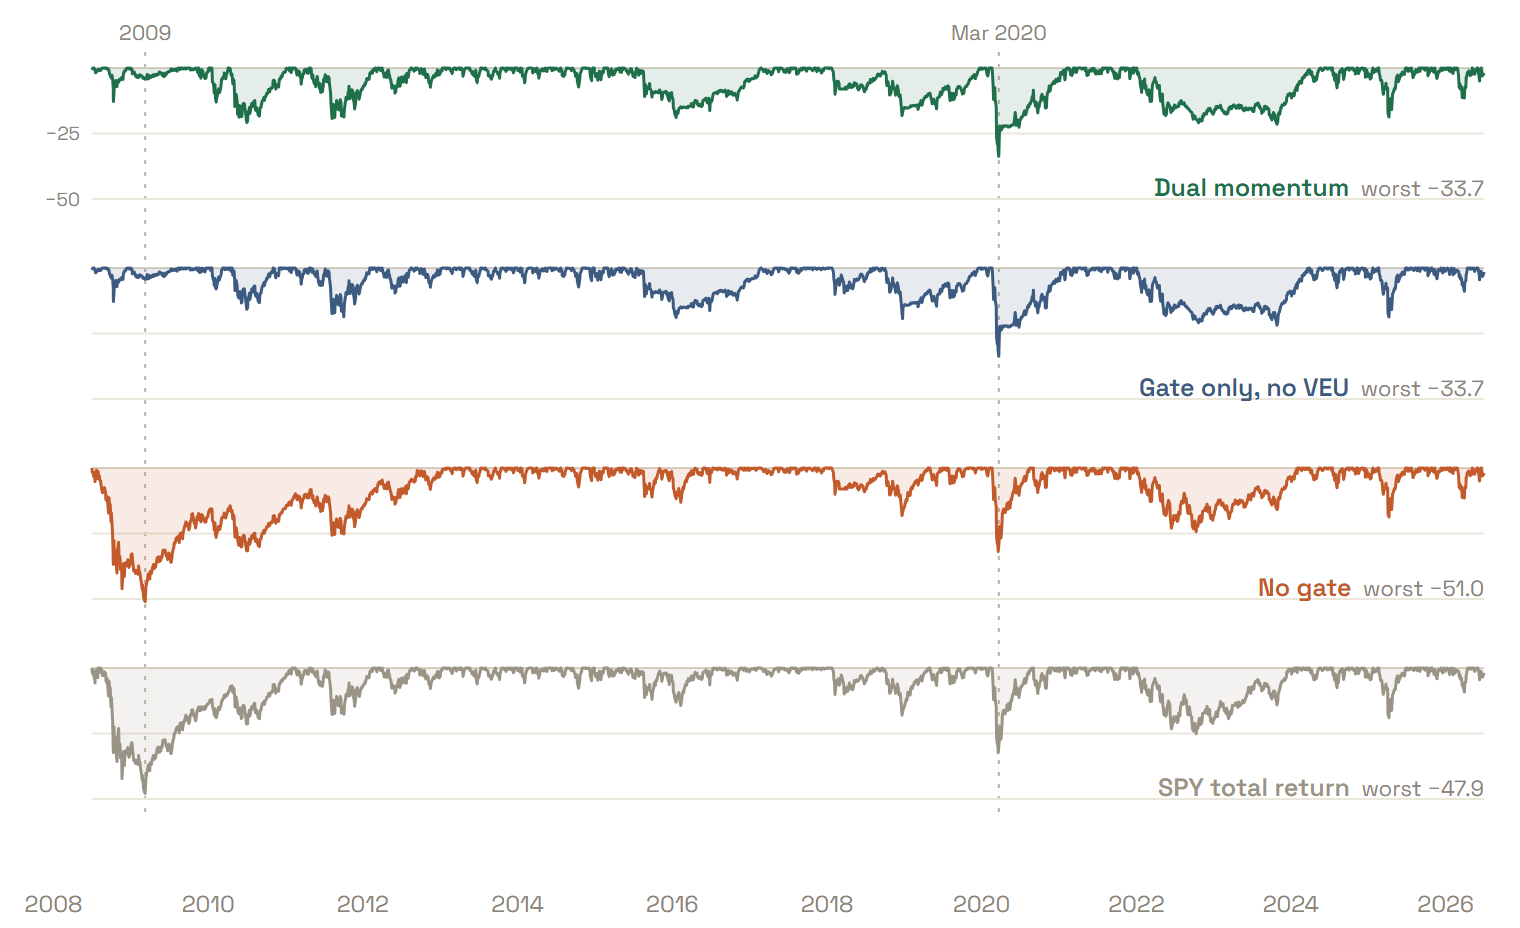
Table 2. The whole search, one cell per evaluated book: CAGR percent a year, Sharpe, and worst drawdown percent, eighteen windows, costs charged. The four lookback columns are the eight pre-registered walks; the signal blend was registered after reading them; the books average is derived from the frozen records, a quarter of capital per lookback, reset yearly. On the same ruler: SPY total return 10.15 / 0.59 / −47.9, and 60/40 SPY/AGG 8.80 / 0.77 / −30.1.
| Book | 3m | 6m | 9m | 12m | Signal blend | Books averaged |
|---|---|---|---|---|---|---|
| Dual momentum | 8.89 0.71 · −20.1 | 6.72 0.52 · −35.5 | 5.67 0.44 · −34.4 | 9.28 0.63 · −33.7 | 6.56 0.49 · −35.2 | 7.77 0.62 · −29.1 |
| Gate only (no VEU) | 10.33 0.85 · −22.1 | 8.46 0.65 · −33.7 | 8.86 0.66 · −33.7 | 10.70 0.73 · −33.7 | 9.10 0.67 · −33.7 | 9.69 0.78 · −29.0 |
| No gate (welded open) | 9.58 0.55 · −46.8 | 9.09 0.53 · −51.0 | 8.72 0.52 · −47.3 | 9.80 0.56 · −51.0 | 9.90 0.57 · −47.3 | 9.34 0.55 · −48.8 |
Table 3. Where the eighteen years were spent, at the published 12-month lookback: months held per instrument and instrument changes, counted on the strategy’s monthly clock inside the sealed windows (212 monthly marks).
| Book | Months in SPY | Months in VEU | Months in AGG | Switches | Gate moves | SPY/VEU moves |
|---|---|---|---|---|---|---|
| Dual momentum (gate + leg) | 154 | 41 | 17 | 25 | 9 | 16 |
| Absolute momentum only | 195 | 0 | 17 | 9 | 9 | 0 |
| Relative momentum only | 169 | 43 | 0 | 18 | 0 | 18 |
2.2 Per-step results
| # | Out-of-sample window | Dual momentum (gate + relative leg) SR | Absolute momentum only (no international leg) SR | Relative momentum only (gate welded open) SR | Dual momentum, blended signal SR | Absolute momentum, blended signal SR | Relative momentum, blended signal SR |
|---|---|---|---|---|---|---|---|
| 1 | 2008-07-01 → 2009-07-01 | 0.57 | 0.57 | -0.65 | 0.57 | 0.57 | -0.33 |
| 2 | 2009-07-01 → 2010-07-01 | -0.25 | 0.35 | 0.19 | -0.10 | 0.49 | 0.22 |
| 3 | 2010-07-01 → 2011-07-01 | 1.80 | 2.09 | 1.80 | 0.54 | 1.14 | 1.51 |
| 4 | 2011-07-01 → 2012-06-29 | 0.27 | 0.27 | 0.27 | -0.25 | -0.25 | 0.27 |
| 5 | 2012-07-02 → 2013-07-01 | 1.42 | 1.62 | 1.42 | 1.40 | 1.62 | 1.40 |
| 6 | 2013-07-01 → 2014-07-01 | 2.21 | 2.21 | 2.21 | 2.21 | 2.21 | 2.21 |
| 7 | 2014-07-01 → 2015-07-01 | 0.65 | 0.65 | 0.65 | 0.65 | 0.65 | 0.65 |
| 8 | 2015-07-01 → 2016-06-30 | -0.60 | -0.60 | 0.26 | -0.44 | -0.44 | 0.26 |
| 9 | 2016-07-01 → 2017-06-30 | 1.95 | 2.01 | 1.95 | 1.14 | 2.01 | 1.14 |
| 10 | 2017-07-03 → 2018-06-29 | 0.89 | 1.12 | 0.89 | 0.65 | 1.12 | 0.65 |
| 11 | 2018-07-02 → 2019-07-01 | 0.05 | 0.05 | 0.74 | -0.39 | -0.39 | 0.74 |
| 12 | 2019-07-01 → 2020-06-30 | -0.14 | -0.14 | 0.35 | -0.14 | -0.14 | 0.35 |
| 13 | 2020-07-01 → 2021-07-01 | 2.03 | 2.35 | 2.03 | 1.80 | 2.35 | 1.80 |
| 14 | 2021-07-01 → 2022-07-01 | -0.14 | -0.14 | -0.45 | -0.15 | -0.15 | -0.45 |
| 15 | 2022-07-01 → 2023-06-30 | -0.20 | -0.20 | 0.71 | 0.47 | 0.81 | 0.71 |
| 16 | 2023-07-03 → 2024-06-28 | 1.93 | 2.03 | 1.93 | 1.65 | 1.65 | 2.03 |
| 17 | 2024-07-01 → 2025-07-01 | 0.76 | 0.77 | 0.76 | 0.55 | 0.65 | 0.90 |
| 18 | 2025-07-01 → 2026-07-01 | 1.47 | 1.65 | 1.47 | 1.51 | 1.65 | 1.51 |
2.2b The family, walk by walk
This paper answers for a declared family of 18 registered studies. 10 member walks are drawn as 20 lines (a comparative walk contributes one line per arm), each chained across its own out-of-sample windows, on one calendar axis, all rebased to 1× on the first session they share. 6 of them are shown to start: the paper’s own walk and the four that grew most; the others are switched off until their name is clicked. The paper’s own walk is the heavy line; the dashed grey line is the study’s own benchmark.
 Open in the lab starts from the heavy lines marked with it, this study’s strategy.
| Walk | Windows | Span | Growth | CAGR | Worst drawdown | Pooled Sharpe |
|---|---|---|---|---|---|---|
| 12m: absolute · Dual momentum (gate + relative leg) (this paper, the one the lab opens) | 18 | 2008-07-01 → 2026-07-01 | +393.9% | +9.3% | -33.7% | 0.63 |
| 12m: absolute · Absolute momentum only (no international leg) (this paper, the one the lab opens) | 18 | 2008-07-01 → 2026-07-01 | +523.4% | +10.7% | -33.7% | 0.73 |
| 12m: relative · Dual momentum (gate + relative leg) | 18 | 2008-07-01 → 2026-07-01 | +393.9% | +9.3% | -33.7% | 0.63 |
| 12m: relative · Relative momentum only (gate welded open) | 18 | 2008-07-01 → 2026-07-01 | +437.6% | +9.8% | -51.0% | 0.56 |
| 3m: absolute · Dual momentum (gate + relative leg) | 18 | 2008-07-01 → 2026-07-01 | +362.8% | +8.9% | -20.1% | 0.71 |
| 3m: absolute · Absolute momentum only (no international leg) | 18 | 2008-07-01 → 2026-07-01 | +486.5% | +10.3% | -22.1% | 0.85 |
| 3m: relative · Dual momentum (gate + relative leg) | 18 | 2008-07-01 → 2026-07-01 | +362.8% | +8.9% | -20.1% | 0.71 |
| 3m: relative · Relative momentum only (gate welded open) | 18 | 2008-07-01 → 2026-07-01 | +418.8% | +9.6% | -46.8% | 0.56 |
| 6m: absolute · Dual momentum (gate + relative leg) | 18 | 2008-07-01 → 2026-07-01 | +222.6% | +6.7% | -35.5% | 0.52 |
| 6m: absolute · Absolute momentum only (no international leg) | 18 | 2008-07-01 → 2026-07-01 | +331.2% | +8.5% | -33.7% | 0.65 |
| 6m: relative · Dual momentum (gate + relative leg) | 18 | 2008-07-01 → 2026-07-01 | +222.6% | +6.7% | -35.5% | 0.52 |
| 6m: relative · Relative momentum only (gate welded open) | 18 | 2008-07-01 → 2026-07-01 | +378.5% | +9.1% | -51.0% | 0.53 |
| 9m: absolute · Dual momentum (gate + relative leg) | 18 | 2008-07-01 → 2026-07-01 | +169.9% | +5.7% | -34.4% | 0.44 |
| 9m: absolute · Absolute momentum only (no international leg) | 18 | 2008-07-01 → 2026-07-01 | +360.9% | +8.9% | -33.7% | 0.66 |
| 9m: relative · Dual momentum (gate + relative leg) | 18 | 2008-07-01 → 2026-07-01 | +169.9% | +5.7% | -34.4% | 0.44 |
| 9m: relative · Relative momentum only (gate welded open) | 18 | 2008-07-01 → 2026-07-01 | +350.1% | +8.7% | -47.3% | 0.52 |
| blended 3+6+9+12m: absolute · Dual momentum (gate + relative leg) | 18 | 2008-07-01 → 2026-07-01 | +214.1% | +6.6% | -35.2% | 0.49 |
| blended 3+6+9+12m: absolute · Absolute momentum only (no international leg) | 18 | 2008-07-01 → 2026-07-01 | +379.2% | +9.1% | -33.7% | 0.67 |
| blended 3+6+9+12m: relative · Dual momentum (gate + relative leg) | 18 | 2008-07-01 → 2026-07-01 | +214.1% | +6.6% | -35.2% | 0.49 |
| blended 3+6+9+12m: relative · Relative momentum only (gate welded open) | 18 | 2008-07-01 → 2026-07-01 | +446.7% | +9.9% | -47.3% | 0.57 |
| 60/40 SPY/AGG, rebalanced monthly (computed) (benchmark) | 2008-07-01 → 2026-07-01 | +356.3% | +8.8% | -30.1% |
2.3 Search accounting
This paper's search is a declared family: the GEM lookback family: fifteen registered configurations from ten walks, plus three derived averages, counted at N = 18 evaluated books. Every member is either a registered walk with its own hypothesis and frozen record, or a derived average computed from those frozen records; every member is reported, in the family figure and table, and none was selected away. The count is declared by the author rather than derived from one project's ledger, because the members are sibling registered studies; the declaration names them and is frozen in this artifact. What the source strategy's author searched before publishing is not knowable from here and is not counted. The registered per-step record below still guarantees each window's hypothesis was hashed and registered before that window was scored.
2.4 The comparison
Both arms trade the same registered windows, so their returns can be PAIRED: inside each window the two return series are inner-joined date by date and the difference rDual momentum (gate + relative leg) − rAbsolute momentum only (no international leg) is the object under test. Because this is ONE pre-declared contrast, frozen at registration before any window was scored, the paired statistic needs no multiple-testing deflation; the arm-level records carry the declared family count of §2.3 as their search accounting, and this contrast, registered per window before scoring, is not multiplied by it.
In the table: Arm A = Dual momentum (gate + relative leg) · Arm B = Absolute momentum only (no international leg).
| # | Window | Paired bars | Arm A | Arm B | Δ | Leader | Relative momentum only (gate welded open) | Dual momentum, blended signal | Absolute momentum, blended signal | Relative momentum, blended signal |
|---|---|---|---|---|---|---|---|---|---|---|
| 1 | 2008-07-02 → 2009-07-01 | 252 | +6.6% | +6.6% | +0.0 pp | tie | -32.8% | +6.6% | +6.6% | -22.9% |
| 2 | 2009-07-02 → 2010-07-01 | 252 | -7.1% | +4.4% | -11.4 pp | Arm B | +1.6% | -4.4% | +7.3% | +2.6% |
| 3 | 2010-07-02 → 2011-07-01 | 253 | +29.8% | +32.7% | -2.9 pp | Arm B | +29.8% | +6.9% | +13.9% | +25.9% |
| 4 | 2011-07-05 → 2012-06-29 | 251 | +3.7% | +3.7% | +0.0 pp | tie | +3.7% | -6.4% | -6.4% | +3.7% |
| 5 | 2012-07-03 → 2013-07-01 | 249 | +18.1% | +20.7% | -2.6 pp | Arm B | +18.1% | +17.7% | +20.7% | +17.7% |
| 6 | 2013-07-02 → 2014-07-01 | 252 | +24.4% | +24.4% | +0.0 pp | tie | +24.4% | +24.4% | +24.4% | +24.4% |
| 7 | 2014-07-02 → 2015-07-01 | 252 | +7.3% | +7.3% | +0.0 pp | tie | +7.3% | +7.3% | +7.3% | +7.3% |
| 8 | 2015-07-02 → 2016-06-30 | 252 | -10.0% | -10.0% | +0.0 pp | tie | +3.0% | -6.9% | -6.9% | +3.0% |
| 9 | 2016-07-05 → 2017-06-30 | 251 | +17.1% | +17.4% | -0.3 pp | Arm B | +17.1% | +9.8% | +17.4% | +9.8% |
| 10 | 2017-07-05 → 2018-06-29 | 250 | +9.1% | +14.0% | -4.9 pp | Arm B | +9.1% | +7.4% | +14.0% | +7.4% |
| 11 | 2018-07-03 → 2019-07-01 | 250 | -0.3% | -0.3% | +0.0 pp | tie | +10.8% | -6.1% | -6.1% | +10.8% |
| 12 | 2019-07-02 → 2020-06-30 | 252 | -8.2% | -8.2% | +0.0 pp | tie | +6.3% | -8.2% | -8.2% | +6.3% |
| 13 | 2020-07-02 → 2021-07-01 | 252 | +34.3% | +40.5% | -6.2 pp | Arm B | +34.3% | +29.5% | +40.5% | +29.5% |
| 14 | 2021-07-02 → 2022-07-01 | 252 | -4.1% | -4.1% | +0.0 pp | tie | -10.3% | -3.6% | -3.6% | -10.3% |
| 15 | 2022-07-05 → 2023-06-30 | 250 | -1.9% | -1.9% | +0.0 pp | tie | +12.2% | +4.0% | +7.4% | +12.2% |
| 16 | 2023-07-05 → 2024-06-28 | 249 | +23.1% | +24.2% | -1.1 pp | Arm B | +23.1% | +18.6% | +18.6% | +24.2% |
| 17 | 2024-07-02 → 2025-07-01 | 250 | +14.3% | +14.5% | -0.2 pp | Arm B | +14.3% | +6.7% | +8.1% | +15.2% |
| 18 | 2025-07-02 → 2026-07-01 | 251 | +25.7% | +21.9% | +3.8 pp | Arm A | +25.7% | +26.4% | +22.0% | +26.4% |
Paired Sharpe of the difference track: -0.33 · block bootstrap (2000 paths, block 10, seed 1234): P(Dual momentum (gate + relative leg) beats Absolute momentum only (no international leg)) = 6.5%.
Window win-rate. Dual momentum (gate + relative leg) led 1 of 18 windows (5.6%), Absolute momentum only (no international leg) led 8, and 9 windows were ties, and the mean window gap of -1.44 pp points the same way. Widest single window: 2009 at -11.4 pp.
| Period | Windows | Dual momentum (gate + relative leg) | Absolute momentum only (no international leg) | 60/40 SPY/AGG | Mean gap | Dual momentum (gate + relative leg) led |
|---|---|---|---|---|---|---|
| All windows | 18 | +10.10% | +11.55% | +9.23% | -1.44 pp | 1/18 |
| Before 2010 | 2 | -0.24% | +5.47% | +0.99% | -5.72 pp | 0/2 |
| 2010 onward | 16 | +11.40% | +12.31% | +10.26% | -0.91 pp | 1/16 |
3 The circuit
The strategy is a circuit of platform primitives, frozen when the study is registered. Below is the circuit as wired on the canvas, the objective it encodes and how the search runs through it, followed by the mathematics each primitive actually computes, the same formulas the execution engine runs. The complete parameterisation is preserved in the study ledger (Appendix A).
The sentence below is the registration record, generated when the circuit was registered and printed verbatim; the authored description of the design is Section 1.
A COMPARATIVE study: Dual momentum (gate + relative leg) vs Absolute momentum only (no international leg), walked on the same registered out-of-sample windows. Dual momentum (gate + relative leg): A regime-routed strategy-of-strategies allocating one book across 2 lanes, (A) GEM instrument books (fixed lists) · a re-selected ranked basket; (B) GEM instrument books (fixed lists) · a re-selected ranked basket, routed by the wired regime classifier, forward-tested out-of-sample from the anchor. Absolute momentum only (no international leg): A regime-routed strategy-of-strategies allocating one book across 2 lanes, (A) GEM instrument books (fixed lists) · a re-selected ranked basket; (B) GEM instrument books (fixed lists) · a re-selected ranked basket, routed by the wired regime classifier, forward-tested out-of-sample from the anchor. The arms differ in: Universe #1, gem_book: risky → risky_us. The contrast under test: whether Dual momentum (gate + relative leg) generates better risk-adjusted returns than Absolute momentum only (no international leg) over the identical out-of-sample windows.
Envelopes show counts, ratios, dates, and the parameters the author chose. Full price and per-name data series are not republished: the underlying market data is licensed to QuanterLab. Point figures quoted in the prose, a named holding's return over a stated span, are summary facts derived from public market prices, not redistributed series.
The objective and the search
Dual momentum (gate + relative leg)
| Universe | 2 strategy lanes over GEM instrument books (fixed lists) (see Strategy lanes). |
|---|---|
| Selection | metric across mom_trailing, mom_trailing → highest 1 kept by mom_trailing. |
| Validation & out-of-sample | portfolio forward test (buy-and-hold book) (1y horizon from the anchor, monthly rebalance); regime-routed allocation across the wired strategies; overlays: Transaction Cost. |
| Regime layer | macro regime detected via Absolute Momentum Gate (Antonacci). |
| Router lanes | (A) GEM instrument books (fixed lists) · a re-selected ranked basket; (B) GEM instrument books (fixed lists) · a re-selected ranked basket. |
Absolute momentum only (no international leg)
The specification is identical to Dual momentum (gate + relative leg)'s table above, row for row; the one registered difference between the arms is itemized below.
What differs between the arms, one difference; the comparison is clean:
- paramUniverse #1, gem_book: risky → risky_us
Companion book. Relative momentum only (gate welded open) comes from a companion run whose one change against this study's Dual momentum (gate + relative leg) arm is Dual Momentum Gate, regime_override: auto → offensive. Its results run through this paper's tables under its own name.
Companion book. Dual momentum, blended signal comes from a companion run whose one change against this study's Dual momentum (gate + relative leg) arm is Dual Momentum Gate, lookback_mode: None → blend_3_6_9_12; Filter Mom Trailing, formation_mode: None → blend_3_6_9_12. Its results run through this paper's tables under its own name.
Companion book. Absolute momentum, blended signal comes from a companion run whose one change against this study's Dual momentum (gate + relative leg) arm is Dual Momentum Gate, lookback_mode: None → blend_3_6_9_12; Filter Mom Trailing, formation_mode: None → blend_3_6_9_12. Its results run through this paper's tables under its own name.
Companion book. Relative momentum, blended signal comes from a companion run whose one change against this study's Dual momentum (gate + relative leg) arm is Dual Momentum Gate, lookback_mode: None → blend_3_6_9_12; Dual Momentum Gate, regime_override: auto → offensive; Filter Mom Trailing, formation_mode: None → blend_3_6_9_12. Its results run through this paper's tables under its own name.
Everything else is held identical, so an out-of-sample gap between the arms is attributable to this one change.
Cost elements are wired into the circuit, the realised drag is reported per step in Appendix B.
Show the mathematics, 5 primitives, formulas and parity notes
3.1 Price Loader
Bulk OHLCV fetch for the whole universe, point-in-time, no future bars.
Momentum, volatility, trend, every price-based metric needs history. This loads open/high/low/close/volume for all names in parallel, clipped so nothing after the anchor can leak in. The lookback window is derived automatically from the deepest metric you wired.
It loads exactly enough history for the hungriest downstream metric plus a warm-up buffer:
W = \max_k(\text{lookback}_k) + \text{buffer}, \qquad \text{bars} \le \text{anchor } t3.2 Top N
Keep the best N, rank, then cut.
Sort the survivors by the Composite Σ (or, if none is wired, the last metric in the chain) and keep the top (or bottom) N. The final narrowing from a scored list to a committed basket.
\text{Top-}N = \{\, i : \operatorname{rank}(\text{score}_i) \le N \,\}N = \operatorname{round}(f \cdot n_{\text{ranked}})\text{kept} = \{\, i \in H : \operatorname{rank}_i \le K \,\} \;\cup\; \text{best ranked } i \notin H \text{ up to } N3.3 Portfolio Backtest
Replay the portfolio forward, rebalanced, point-in-time, with costs.
Holds the basket and rebalances on schedule, re-selecting and re-optimizing point-in-time at each rebalance (so it only ever uses information available then), and reports the equity curve, Sharpe, drawdown and trade stats, optionally net of cost and risk overlays.
E_t = E_{t-1}\big(1 + \mathbf w_{t}^{\top}\mathbf r_t - \text{costs}_t\big)\text{DD}_t = \frac{E_t}{\max_{\tau\le t}E_\tau} - 1, \qquad \text{MaxDD} = \min_t \text{DD}_t\text{charge}_t \;=\; \text{loan}_t \cdot \frac{\text{spread}}{252}, \qquad \text{loan}_t = \begin{cases}\max(0,\,-\text{cash}_t) & \text{institutional (netted)}\\ \max(0,\,\text{long MV}_t - E_t) & \text{retail (no netting)}\end{cases}\mathbf w_k = \{\, w_{k,i} : i \in \text{held} \,\}, \qquad \text{cash}_k = 1 - \textstyle\sum_{i \in \text{held}} w_{k,i}3.4 Transaction Cost
Charge for trading, slippage + commission on every turn.
Real trading isn't free. This deducts a cost proportional to how much you trade (turnover), in basis points, so the backtest reflects net, not gross, performance.
\text{cost}_t = \frac{\text{bps}}{10{,}000}\;\times\;\text{turnover}_t, \qquad \text{turnover}_t = \tfrac12\sum_i \lvert w_{i,t}-w_{i,t^-}\rvert3.5 Portfolio Forward Autopsy
The post-mortem, where the forward test’s return actually came from.
Runs after the Portfolio Forward Test and dissects its realized path: per-rebalance contributions, winners and losers, exposure and cash periods, and how the realized route compares to what the risk cones projected. It computes nothing new about the future, it explains the past the book just lived.
Depth I–IV: headline attribution, per-segment breakdown, per-name contributions, and the calibration ledger (projected cone vs realized, segment by segment). In a study, this is the node that fills the appendices.
4 Projection calibration, pooled across the walk
Every rebalance carried a Monte Carlo cone and a 95% VaR estimated before the segment it is scored against. Two questions, pooled over the whole study: did realized outcomes land inside the band as often as the band claims, and were VaR breaches as frequent as 5%?
This section is produced by the forward tester itself: every portfolio backtest fits the cone and the VaR estimate at each rebalance and scores them against the segment that followed. It does not require, and this circuit does not contain, a Monte Carlo primitive; that primitive is a separate, standalone analysis.
| Arm | Steps | Rebalances | In band | Coverage | Expected | VaR days | Breach rate | Expected |
|---|---|---|---|---|---|---|---|---|
| Portfolio | 18 | 230 | 191 / 216 | 88.4% ±2.18 | 90.0% | 4311 | 4.38% ±0.312 | 5.0% |
Note. The pooled row passes and hides the failure mode: coverage 88.4 percent against 90 expected, value-at-risk breaches 4.38 percent against 5. Per step, the cone caught 41.7 percent of marks in the 2022 window against 90 promised, the VaR breached at 13.75 percent in the 2021 window, and the 2008 and 2019 windows both breached above 9. The projections degrade precisely in stress, the only time anyone consults them. That is a finding about this platform's risk model, not about the strategy, and it is reported as one. This section exists because the forward tester scores its own projections against the segment that followed and publishes the misses. A risk model reported only when it passes is not a risk model.
± values are binomial standard errors on the estimate. A coverage figure below the expected band means the projection was over-confident; a breach rate above 5% means the same of the risk model. Both forecasts used only data prior to the segment scored.
5 Discussion
5.1 Interpretation
Antonacci's own 2012 paper already contains most of this verdict. He reported that both momentum ideas raise returns but that absolute momentum does far more to cut volatility and drawdown; the combination was his recommendation. This record sharpens that finding into something blunter: over 2008 through 2026, on tradable funds, with the yield handicap removed and costs charged, the relative leg did not merely trail the gate, it subtracted at every speed tested. The half of dual momentum that carries the famous chart is the gate. The half that gives the strategy its name spent eighteen years as a toll.
Judged on the thing it promised, the strategy delivered. GEM's claim was never that it beats equities; it was that it cuts the catastrophic loss. It did: no gated configuration in this family, at any lookback, lost more than 35.5 percent while SPY and every ungated book lost 47 to 51. The premium for that insurance at the published lookback was about half a point a year, which is cheap if drawdown is what a reader fears and expensive if it is not. What the insurance did not buy, in this window and at the published lookback, is superiority over sitting still: a monthly 60/40 of the same two instruments landed in the gated books' drawdown class with a better Sharpe and not one signal read. The 3-month gate is the family's one exception, and the discount for finding it in an eighteen-book search is stated where the search is. What the record adds to the sales brochure is the mechanism: the protection is conditional on crash speed. A grinding 2008 is exactly what a month-end rule reads well, and the gated books sailed through it at a fifth to a sixth off the peak. A twenty-three-session 2020 is invisible to the same rule until the month turns, and every book ate it whole. The gate's worst loss in the record is the crash it is famous for missing, shifted twelve years late.
The lookback result answers the quiet objection that 12 months was chosen because it worked. It was not the best possible choice in this record; it was one of the two good ones, and the shape around it is a U rather than a cliff, with the middle speeds worse and the ends similar. A reader who refuses to choose can hold all four books at a quarter each and land near the top of the family on risk-adjusted terms. The same reader averaging the four signals into one decision lands in the valley instead. The distinction matters beyond this strategy: a blend of signals is one opinion at one implied speed, while a blend of books is four opinions that disagree, and the disagreement is where the diversification lives. Keller's 13612W measure, the front-weighted cousin of the blend tested here, sits on the same spectrum and was priced in this platform's Bold Asset Allocation study.
What would change the verdict on the international leg is an era in which international equity leads for years at a time. This record does not contain one, and the leg's price here is the price of shuffling into the weaker market during the strongest US run in the sample's history. The gate's verdict rests on mechanics rather than era and travels better. Every number above is read from registered, frozen walk records on this platform, and the two combined runs are labeled with the order in which they were added.
This study is one member of a declared search family: the same design walked at several settings across sibling registered projects, every member either a registered walk with its own frozen record or a derived average of those records, and every member reported. The family size is declared by the author and named in the lineage; it is the search-accounting count for this paper. What was searched before the source strategy was published is not knowable from here and is not counted.
5.2 Limitations
The window is the great US era. 2008 through 2026 contains the longest stretch of US over international outperformance in modern records, and the international leg's toll is measured inside it. Antonacci's index-based history reaches eras where the leg led for years; a tradable-fund study cannot reach them, because VEU and BIL did not exist. The verdict on the leg is a verdict about this era, stated as such. The verdict on the gate rests on drawdown mechanics and is less era-bound, with its own conditionality shown in 2020.
The clock is monthly, and 2020 shows what that costs: a crash that completes inside the month is taken in full, gate or no gate. A faster clock would catch faster crashes and pay more whipsaw; that trade is not measured here.
The bill series is BIL's total return, not the three-month Treasury yield Antonacci used. The two are close; they are not the same number, and the gate's marginal months could differ under the other choice. Costs are a flat ten basis points per one-way traded dollar, which understates trading in stressed months and overstates it in calm ones; there are no taxes, and a taxable reader switching whole books between funds would keep less than every number above. Returns are stated raw, not as excess over cash, and no cash hurdle is applied to any comparison. Through the zero-rate decade that distinction is nearly empty; from 2023 on, with bills near five percent, it is not, and the family-against-60/40 reading is the one it touches most. Instrument switches are counted on the strategy's monthly clock inside each sealed window, so a flip occurring exactly at a window boundary is not counted; the tally understates by at most a handful.
The blended-signal walks were registered after the eight single-lookback walks were read, and the book-average line is derived from the frozen records rather than walked. Both are results-motivated extensions, both say so in their sealed texts or their captions, and a skeptical reader should weight the pre-specified eight above either.
Fifteen registered configurations and three derived averages is a family, and families flatter their best member. The claims this paper stands on are deliberately the two that hold across every member at once: the leg subtracted everywhere, and the gated and ungated drawdown ranges do not touch. The study benchmark is a US 60/40, which is what a reader of this literature would hold, but it contains no international exposure and therefore cannot isolate what the relative leg added or cost; that job belongs to the welded-open arm, which is why both are reported.
References
- Antonacci, G. (2012, rev. 2017). Risk Premia Harvesting Through Dual Momentum. Journal of Management and Entrepreneurship 2(1), 27-55. SSRN 2042750.
- Antonacci, G. (2014). Dual Momentum Investing: An Innovative Strategy for Higher Returns with Lower Risk. McGraw-Hill.
- Keller, W. J. (2022). Relative and Absolute Momentum in Times of Rising/Low Yields: Bold Asset Allocation (BAA). SSRN 4166845.
- Hoffstein, C. (2019). Fragility Case Study: Dual Momentum GEM. Newfound Research, Flirting with Models.
- Antonacci, G. (2019). Whither Fragility? Dual Momentum GEM. dualmomentum.net.
Appendix A Reproducibility in QuanterLab
Each step is backed by a frozen run report. The study is re-derivable from the ledger below.
| # | Commit | Report | Anchor | OOS window |
|---|---|---|---|---|
| 1 | faeee651ce09 | 1670 | 2008-07-01 | 2008-07-01 → 2009-07-01 |
| 2 | d4c285b26548 | 1671 | 2009-07-01 | 2009-07-01 → 2010-07-01 |
| 3 | 85393f29ef1a | 1672 | 2010-07-01 | 2010-07-01 → 2011-07-01 |
| 4 | 78b005758a2a | 1673 | 2011-07-01 | 2011-07-01 → 2012-06-29 |
| 5 | 887448e16425 | 1674 | 2012-07-01 | 2012-07-02 → 2013-07-01 |
| 6 | 0b05df5de0fa | 1675 | 2013-07-01 | 2013-07-01 → 2014-07-01 |
| 7 | 76b1d671ec74 | 1676 | 2014-07-01 | 2014-07-01 → 2015-07-01 |
| 8 | 223fd9fe321f | 1677 | 2015-07-01 | 2015-07-01 → 2016-06-30 |
| 9 | 34b511b86bda | 1678 | 2016-07-01 | 2016-07-01 → 2017-06-30 |
| 10 | ed31aa3246b8 | 1679 | 2017-07-01 | 2017-07-03 → 2018-06-29 |
| 11 | a8a1042b9cff | 1680 | 2018-07-01 | 2018-07-02 → 2019-07-01 |
| 12 | 207b64a5a529 | 1681 | 2019-07-01 | 2019-07-01 → 2020-06-30 |
| 13 | b3943538125b | 1682 | 2020-07-01 | 2020-07-01 → 2021-07-01 |
| 14 | 9162b398023c | 1683 | 2021-07-01 | 2021-07-01 → 2022-07-01 |
| 15 | 6944983450bb | 1684 | 2022-07-01 | 2022-07-01 → 2023-06-30 |
| 16 | 12df253f6a8e | 1685 | 2023-07-01 | 2023-07-03 → 2024-06-28 |
| 17 | 3f196d27eb3d | 1686 | 2024-07-01 | 2024-07-01 → 2025-07-01 |
| 18 | 0f2989db23e6 | 1687 | 2025-07-01 | 2025-07-01 → 2026-07-01 |
The methods the platform implements, for every study made on it, rest on these works.
- Gelman, A., & Loken, E. (2013). The garden of forking paths: Why multiple comparisons can be a problem, even when there is no “fishing expedition.” Working paper, Columbia University.
- Harvey, C. R., Liu, Y., & Zhu, H. (2016). … and the Cross-Section of Expected Returns. Review of Financial Studies, 29(1), 5–68. doi:10.1093/rfs/hhv059
- Lo, A. W. (2002). The Statistics of Sharpe Ratios. Financial Analysts Journal, 58(4), 36–52. doi:10.2469/faj.v58.n4.2453
Appendix A2 Registration record
What this record does and does not establish. Every window in this study is historical: the data existed before the study began, so this is sequential registration on past windows, not pre-registration in the clinical-trial sense, and no procedure could make it so. What the platform does enforce is order, each step's specification was frozen and hashed before that step was scored, and the walk cannot advance past a step that was never run or close one with a result registered for a different window. The two timestamp columns below are the evidence: read them together and each registration precedes its own run, and each run precedes the next registration. A study whose registrations all post-date its runs would show it here. Wall-clock spacing between registrations varies with the author's schedule and queue latency; the ordering, not the tempo, is the claim.
“A COMPARATIVE study: Dual momentum (gate + relative leg) vs Absolute momentum only (no international leg), walked on the same registered out-of-sample windows. Dual momentum (gate + relative leg): A regime-routed strategy-of-strategies allocating one book across 2 lanes, (A) GEM instrument books (fixed lists) · a re-selected ranked basket; (B) GEM instrument books (fixed lists) · a re-selected ranked basket, routed by the wired regime classifier, forward-tested out-of-sample from the anchor. Absolute momentum only (no international leg): A regime-routed strategy-of-strategies allocating one book across 2 lanes, (A) GEM instrument books (fixed lists) · a re-selected ranked basket; (B) GEM instrument books (fixed lists) · a re-selected ranked basket, routed by the wired regime classifier, forward-tested out-of-sample from the anchor. The arms differ in: Universe #1, gem_book: risky → risky_us. The contrast under test: whether Dual momentum (gate + relative leg) generates better risk-adjusted returns than Absolute momentum only (no international leg) over the identical out-of-sample windows.”
The same hypothesis was registered independently at every step, hashed before each step's out-of-sample window was scored:
| # | Anchor | Registered at (UTC) | Run completed (UTC) |
|---|---|---|---|
| 1 | 2008-07-01 | 2026-08-27 18:32:57 | 2026-08-27 18:33:30 |
| 2 | 2009-07-01 | 2026-08-27 18:33:33 | 2026-08-27 18:34:03 |
| 3 | 2010-07-01 | 2026-08-27 18:34:06 | 2026-08-27 18:34:36 |
| 4 | 2011-07-01 | 2026-08-27 18:34:39 | 2026-08-27 18:35:10 |
| 5 | 2012-07-01 | 2026-08-27 18:35:13 | 2026-08-27 18:35:43 |
| 6 | 2013-07-01 | 2026-08-27 18:35:46 | 2026-08-27 18:36:16 |
| 7 | 2014-07-01 | 2026-08-27 18:36:19 | 2026-08-27 18:36:49 |
| 8 | 2015-07-01 | 2026-08-27 18:36:52 | 2026-08-27 18:37:23 |
| 9 | 2016-07-01 | 2026-08-27 18:37:26 | 2026-08-27 18:37:56 |
| 10 | 2017-07-01 | 2026-08-27 18:37:59 | 2026-08-27 18:38:29 |
| 11 | 2018-07-01 | 2026-08-27 18:38:32 | 2026-08-27 18:39:02 |
| 12 | 2019-07-01 | 2026-08-27 18:39:05 | 2026-08-27 18:39:20 |
| 13 | 2020-07-01 | 2026-08-27 18:39:24 | 2026-08-27 18:39:54 |
| 14 | 2021-07-01 | 2026-08-27 18:39:57 | 2026-08-27 18:40:27 |
| 15 | 2022-07-01 | 2026-08-27 18:40:30 | 2026-08-27 18:41:00 |
| 16 | 2023-07-01 | 2026-08-27 18:41:03 | 2026-08-27 18:41:33 |
| 17 | 2024-07-01 | 2026-08-27 18:41:37 | 2026-08-27 18:42:07 |
| 18 | 2025-07-01 | 2026-08-27 18:42:10 | 2026-08-27 18:42:40 |
The companion comparisons
This paper reads 3 more registered studies beside its own. Each one’s registration is printed here from their own record, in the same form as the table above: the hypothesis as it was registered, the day it was first locked, the time each window was registered and run, and what each window returned.
Relative momentum only (gate welded open)
Its hypothesis was first locked on 27 August 2026, before its first window was run that day.
The same hypothesis was registered again, unchanged, at each of its 18 windows:
“A COMPARATIVE study: Dual momentum (gate + relative leg) vs Relative momentum only (gate welded open), walked on the same registered out-of-sample windows. Dual momentum (gate + relative leg): A regime-routed strategy-of-strategies allocating one book across 2 lanes, (A) GEM instrument books (fixed lists) · a re-selected ranked basket; (B) GEM instrument books (fixed lists) · a re-selected ranked basket, routed by the wired regime classifier, forward-tested out-of-sample from the anchor. Relative momentum only (gate welded open): A regime-routed strategy-of-strategies allocating one book across 2 lanes, (A) GEM instrument books (fixed lists) · a re-selected ranked basket; (B) GEM instrument books (fixed lists) · a re-selected ranked basket, routed by the wired regime classifier, forward-tested out-of-sample from the anchor. The arms differ in: Absolute Momentum Gate (Antonacci), regime_override: auto → offensive. The contrast under test: whether Dual momentum (gate + relative leg) generates better risk-adjusted returns than Relative momentum only (gate welded open) over the identical out-of-sample windows.”
| # | Anchor | Registered at (UTC) | Run completed (UTC) |
|---|---|---|---|
| 1 | 2008-07-01 | 2026-08-27 18:43:05 | 2026-08-27 18:43:22 |
| 2 | 2009-07-01 | 2026-08-27 18:43:26 | 2026-08-27 18:43:41 |
| 3 | 2010-07-01 | 2026-08-27 18:43:44 | 2026-08-27 18:43:59 |
| 4 | 2011-07-01 | 2026-08-27 18:44:02 | 2026-08-27 18:44:17 |
| 5 | 2012-07-01 | 2026-08-27 18:44:20 | 2026-08-27 18:44:35 |
| 6 | 2013-07-01 | 2026-08-27 18:44:38 | 2026-08-27 18:44:53 |
| 7 | 2014-07-01 | 2026-08-27 18:44:56 | 2026-08-27 18:45:12 |
| 8 | 2015-07-01 | 2026-08-27 18:45:15 | 2026-08-27 18:45:30 |
| 9 | 2016-07-01 | 2026-08-27 18:45:33 | 2026-08-27 18:45:48 |
| 10 | 2017-07-01 | 2026-08-27 18:45:51 | 2026-08-27 18:46:06 |
| 11 | 2018-07-01 | 2026-08-27 18:46:09 | 2026-08-27 18:46:25 |
| 12 | 2019-07-01 | 2026-08-27 18:46:28 | 2026-08-27 18:46:43 |
| 13 | 2020-07-01 | 2026-08-27 18:46:46 | 2026-08-27 18:47:01 |
| 14 | 2021-07-01 | 2026-08-27 18:47:04 | 2026-08-27 18:47:19 |
| 15 | 2022-07-01 | 2026-08-27 18:47:22 | 2026-08-27 18:47:37 |
| 16 | 2023-07-01 | 2026-08-27 18:47:41 | 2026-08-27 18:47:56 |
| 17 | 2024-07-01 | 2026-08-27 18:47:59 | 2026-08-27 18:48:14 |
| 18 | 2025-07-01 | 2026-08-27 18:48:17 | 2026-08-27 18:48:32 |
| # | Anchor | Dual momentum (gate + relative leg) | Relative momentum only (gate welded open) |
|---|---|---|---|
| 1 | 2008-07-01 | +6.6% | -32.8% |
| 2 | 2009-07-01 | -7.1% | +1.6% |
| 3 | 2010-07-01 | +29.8% | +29.8% |
| 4 | 2011-07-01 | +3.7% | +3.7% |
| 5 | 2012-07-01 | +18.1% | +18.1% |
| 6 | 2013-07-01 | +24.4% | +24.4% |
| 7 | 2014-07-01 | +7.3% | +7.3% |
| 8 | 2015-07-01 | -10.0% | +3.0% |
| 9 | 2016-07-01 | +17.1% | +17.1% |
| 10 | 2017-07-01 | +9.1% | +9.1% |
| 11 | 2018-07-01 | -0.3% | +10.8% |
| 12 | 2019-07-01 | -8.2% | +6.3% |
| 13 | 2020-07-01 | +34.3% | +34.3% |
| 14 | 2021-07-01 | -4.1% | -10.3% |
| 15 | 2022-07-01 | -1.9% | +12.2% |
| 16 | 2023-07-01 | +23.1% | +23.1% |
| 17 | 2024-07-01 | +14.3% | +14.3% |
| 18 | 2025-07-01 | +25.7% | +25.7% |
Dual momentum, blended signal
Its hypothesis was first locked on 28 August 2026, before its first window was run that day.
The same hypothesis was registered again, unchanged, at each of its 18 windows:
“A COMPARATIVE study: Dual momentum (gate + relative leg) vs Absolute momentum only (no international leg), walked on the same registered out-of-sample windows. Dual momentum (gate + relative leg): A regime-routed strategy-of-strategies allocating one book across 2 lanes, (A) GEM instrument books (fixed lists) · a re-selected ranked basket; (B) GEM instrument books (fixed lists) · a re-selected ranked basket, routed by the wired regime classifier, forward-tested out-of-sample from the anchor. Absolute momentum only (no international leg): A regime-routed strategy-of-strategies allocating one book across 2 lanes, (A) GEM instrument books (fixed lists) · a re-selected ranked basket; (B) GEM instrument books (fixed lists) · a re-selected ranked basket, routed by the wired regime classifier, forward-tested out-of-sample from the anchor. The arms differ in: Universe #1, gem_book: risky → risky_us. The contrast under test: whether Dual momentum (gate + relative leg) generates better risk-adjusted returns than Absolute momentum only (no international leg) over the identical out-of-sample windows.”
| # | Anchor | Registered at (UTC) | Run completed (UTC) |
|---|---|---|---|
| 1 | 2008-07-01 | 2026-08-28 15:40:22 | 2026-08-28 15:43:34 |
| 2 | 2009-07-01 | 2026-08-28 15:43:37 | 2026-08-28 15:44:07 |
| 3 | 2010-07-01 | 2026-08-28 15:44:11 | 2026-08-28 15:44:41 |
| 4 | 2011-07-01 | 2026-08-28 15:44:44 | 2026-08-28 15:45:14 |
| 5 | 2012-07-01 | 2026-08-28 15:45:17 | 2026-08-28 15:45:47 |
| 6 | 2013-07-01 | 2026-08-28 15:45:50 | 2026-08-28 15:46:20 |
| 7 | 2014-07-01 | 2026-08-28 15:46:23 | 2026-08-28 15:46:54 |
| 8 | 2015-07-01 | 2026-08-28 15:46:57 | 2026-08-28 15:47:27 |
| 9 | 2016-07-01 | 2026-08-28 15:47:30 | 2026-08-28 15:48:00 |
| 10 | 2017-07-01 | 2026-08-28 15:48:03 | 2026-08-28 15:48:33 |
| 11 | 2018-07-01 | 2026-08-28 15:48:36 | 2026-08-28 15:49:06 |
| 12 | 2019-07-01 | 2026-08-28 15:49:10 | 2026-08-28 15:49:25 |
| 13 | 2020-07-01 | 2026-08-28 15:49:28 | 2026-08-28 15:49:58 |
| 14 | 2021-07-01 | 2026-08-28 15:50:01 | 2026-08-28 15:50:31 |
| 15 | 2022-07-01 | 2026-08-28 15:50:34 | 2026-08-28 15:51:04 |
| 16 | 2023-07-01 | 2026-08-28 15:51:08 | 2026-08-28 15:51:38 |
| 17 | 2024-07-01 | 2026-08-28 15:51:41 | 2026-08-28 15:52:11 |
| 18 | 2025-07-01 | 2026-08-28 15:52:14 | 2026-08-28 15:52:44 |
| # | Anchor | Dual momentum (gate + relative leg) | Absolute momentum only (no international leg) |
|---|---|---|---|
| 1 | 2008-07-01 | +6.6% | +6.6% |
| 2 | 2009-07-01 | -4.4% | +7.3% |
| 3 | 2010-07-01 | +6.9% | +13.9% |
| 4 | 2011-07-01 | -6.4% | -6.4% |
| 5 | 2012-07-01 | +17.7% | +20.7% |
| 6 | 2013-07-01 | +24.4% | +24.4% |
| 7 | 2014-07-01 | +7.3% | +7.3% |
| 8 | 2015-07-01 | -6.9% | -6.9% |
| 9 | 2016-07-01 | +9.8% | +17.4% |
| 10 | 2017-07-01 | +7.4% | +14.0% |
| 11 | 2018-07-01 | -6.1% | -6.1% |
| 12 | 2019-07-01 | -8.2% | -8.2% |
| 13 | 2020-07-01 | +29.5% | +40.5% |
| 14 | 2021-07-01 | -3.6% | -3.6% |
| 15 | 2022-07-01 | +4.0% | +7.4% |
| 16 | 2023-07-01 | +18.6% | +18.6% |
| 17 | 2024-07-01 | +6.7% | +8.1% |
| 18 | 2025-07-01 | +26.4% | +22.0% |
Relative momentum, blended signal
Its hypothesis was first locked on 28 August 2026, before its first window was run that day.
The same hypothesis was registered again, unchanged, at each of its 18 windows:
“A COMPARATIVE study: Dual momentum (gate + relative leg) vs Relative momentum only (gate welded open), walked on the same registered out-of-sample windows. Dual momentum (gate + relative leg): A regime-routed strategy-of-strategies allocating one book across 2 lanes, (A) GEM instrument books (fixed lists) · a re-selected ranked basket; (B) GEM instrument books (fixed lists) · a re-selected ranked basket, routed by the wired regime classifier, forward-tested out-of-sample from the anchor. Relative momentum only (gate welded open): A regime-routed strategy-of-strategies allocating one book across 2 lanes, (A) GEM instrument books (fixed lists) · a re-selected ranked basket; (B) GEM instrument books (fixed lists) · a re-selected ranked basket, routed by the wired regime classifier, forward-tested out-of-sample from the anchor. The arms differ in: Absolute Momentum Gate (Antonacci), regime_override: auto → offensive. The contrast under test: whether Dual momentum (gate + relative leg) generates better risk-adjusted returns than Relative momentum only (gate welded open) over the identical out-of-sample windows.”
| # | Anchor | Registered at (UTC) | Run completed (UTC) |
|---|---|---|---|
| 1 | 2008-07-01 | 2026-08-28 15:53:09 | 2026-08-28 15:53:27 |
| 2 | 2009-07-01 | 2026-08-28 15:53:30 | 2026-08-28 15:53:45 |
| 3 | 2010-07-01 | 2026-08-28 15:53:48 | 2026-08-28 15:54:03 |
| 4 | 2011-07-01 | 2026-08-28 15:54:06 | 2026-08-28 15:54:21 |
| 5 | 2012-07-01 | 2026-08-28 15:54:25 | 2026-08-28 15:54:40 |
| 6 | 2013-07-01 | 2026-08-28 15:54:43 | 2026-08-28 15:54:58 |
| 7 | 2014-07-01 | 2026-08-28 15:55:01 | 2026-08-28 15:55:16 |
| 8 | 2015-07-01 | 2026-08-28 15:55:19 | 2026-08-28 15:55:34 |
| 9 | 2016-07-01 | 2026-08-28 15:55:37 | 2026-08-28 15:55:52 |
| 10 | 2017-07-01 | 2026-08-28 15:55:56 | 2026-08-28 15:56:11 |
| 11 | 2018-07-01 | 2026-08-28 15:56:14 | 2026-08-28 15:56:29 |
| 12 | 2019-07-01 | 2026-08-28 15:56:32 | 2026-08-28 15:56:47 |
| 13 | 2020-07-01 | 2026-08-28 15:56:50 | 2026-08-28 15:57:05 |
| 14 | 2021-07-01 | 2026-08-28 15:57:08 | 2026-08-28 15:57:23 |
| 15 | 2022-07-01 | 2026-08-28 15:57:27 | 2026-08-28 15:57:42 |
| 16 | 2023-07-01 | 2026-08-28 15:57:45 | 2026-08-28 15:58:00 |
| 17 | 2024-07-01 | 2026-08-28 15:58:03 | 2026-08-28 15:58:18 |
| 18 | 2025-07-01 | 2026-08-28 15:58:21 | 2026-08-28 15:58:36 |
| # | Anchor | Dual momentum (gate + relative leg) | Relative momentum only (gate welded open) |
|---|---|---|---|
| 1 | 2008-07-01 | +6.6% | -22.9% |
| 2 | 2009-07-01 | -4.4% | +2.6% |
| 3 | 2010-07-01 | +6.9% | +25.9% |
| 4 | 2011-07-01 | -6.4% | +3.7% |
| 5 | 2012-07-01 | +17.7% | +17.7% |
| 6 | 2013-07-01 | +24.4% | +24.4% |
| 7 | 2014-07-01 | +7.3% | +7.3% |
| 8 | 2015-07-01 | -6.9% | +3.0% |
| 9 | 2016-07-01 | +9.8% | +9.8% |
| 10 | 2017-07-01 | +7.4% | +7.4% |
| 11 | 2018-07-01 | -6.1% | +10.8% |
| 12 | 2019-07-01 | -8.2% | +6.3% |
| 13 | 2020-07-01 | +29.5% | +29.5% |
| 14 | 2021-07-01 | -3.6% | -10.3% |
| 15 | 2022-07-01 | +4.0% | +12.2% |
| 16 | 2023-07-01 | +18.6% | +24.2% |
| 17 | 2024-07-01 | +6.7% | +15.2% |
| 18 | 2025-07-01 | +26.4% | +26.4% |
Appendix B Per-step diagnostics
Realized in the projection tables below is the risk engine scoring its own forecast: the buy-and-hold return of the segment that followed each rebalance, on the same gross basis the cone was projected on. It is deliberately not the charged, calendar-window total return the study’s tables print, so the two will not reconcile line by line; the cone and its outcome share one basis, which is what a calibration test requires. Each row names its segment’s span so a boundary session is visible.
Names held is the union across the window: the count of distinct instruments the book touched between the window’s first and last session, not the number it held at one time. A book that rotates monthly touches more names than it holds.
What each step's run actually did beyond its return: capital allocation across lanes and regimes, and the portfolio book's rebalancing and cost drag. Harvested from the frozen run reports, present where the circuit produced them. Cost drag is the gap between the step's return before and after its trading costs, in percentage points of the step's starting capital, so on a book that trades every session and compounds it can exceed the step's own net return.
Open the full per-step grid (18 steps: every rebalance and capital routing, per window)
Step 1 · 2008-07-01 → 2009-07-01
Portfolio book, rebalanced monthly · 13 constructions · 1 names held · selection: reselect · 0.0% in cash · turnover 1.0× · cost drag 0.1%
Projection accuracy, realized outcome fell inside the P5–P95 cone in 75.0% of 12 scored rebalances (a well-calibrated 90% band contains ~90.0%) · 95% VaR breached on 9.17% of 240 days (expected ~5.0%)
| Rebalance | P5 | Median | P95 | Realized | In band | VaR 95 (1d) | Breaches |
|---|---|---|---|---|---|---|---|
| 2008-07-01 → 2008-08-01 | -1.8729% | 0.0963% | 2.2289% | 0.7425% | yes | 0.5046% | 4 / 21 |
| 2008-08-01 → 2008-09-01 | -1.9347% | 0.094% | 2.2073% | 0.8609% | yes | 0.5194% | 0 / 20 |
| 2008-09-01 → 2008-10-01 | -1.8594% | 0.1651% | 2.2738% | -2.0856% | no | 0.5195% | 2 / 20 |
| 2008-10-01 → 2008-11-01 | -2.277% | 0.004% | 2.2604% | -1.5795% | yes | 0.5336% | 7 / 22 |
| 2008-11-01 → 2008-12-01 | -3.4714% | -0.0782% | 3.6342% | 4.6895% | no | 0.5809% | 3 / 18 |
| 2008-12-01 → 2009-01-01 | -3.7637% | 0.0319% | 4.2226% | 4.7973% | no | 0.6055% | 0 / 21 |
| 2009-01-01 → 2009-02-01 | -3.6272% | 0.1713% | 4.2731% | -1.3713% | yes | 0.6065% | 3 / 19 |
| 2009-02-01 → 2009-03-01 | -3.6535% | 0.0674% | 4.1524% | -0.8859% | yes | 0.6369% | 0 / 18 |
| 2009-03-01 → 2009-04-01 | -3.8531% | 0.0788% | 4.4263% | 0.7646% | yes | 0.636% | 2 / 21 |
| 2009-04-01 → 2009-05-01 | -3.9015% | 0.1093% | 4.3742% | 0.564% | yes | 0.6611% | 0 / 20 |
| 2009-05-01 → 2009-06-01 | -3.929% | 0.023% | 4.2977% | 1.0999% | yes | 0.6781% | 0 / 19 |
| 2009-06-01 → 2009-07-01 | -3.976% | 0.0717% | 4.5528% | 1.6823% | yes | 0.6846% | 1 / 21 |
| 2009-07-01 | no segment follows this rebalance, not scored | ||||||
Regime router, 2 lanes · regimes: defensive · 1 switches · switch cost 10.0 bps · cost drag 0.1%
| Regime | Pipeline A | Pipeline B |
|---|---|---|
| defensive | 0.0 | 1.0 |
Step 2 · 2009-07-01 → 2010-07-01
Portfolio book, rebalanced monthly · 13 constructions · 1 names held · selection: reselect · 0.0% in cash · turnover 1.0× · cost drag 0.1%
Projection accuracy, realized outcome fell inside the P5–P95 cone in 100.0% of 12 scored rebalances (a well-calibrated 90% band contains ~90.0%) · 95% VaR breached on 0.42% of 240 days (expected ~5.0%)
| Rebalance | P5 | Median | P95 | Realized | In band | VaR 95 (1d) | Breaches |
|---|---|---|---|---|---|---|---|
| 2009-07-01 → 2009-08-01 | -3.9558% | 0.1204% | 4.6344% | 1.3069% | yes | 0.6893% | 0 / 21 |
| 2009-08-01 → 2009-09-01 | -3.9277% | 0.2037% | 4.6023% | 1.4334% | yes | 0.6893% | 0 / 20 |
| 2009-09-01 → 2009-10-01 | -3.8873% | 0.2585% | 4.6731% | 1.3622% | yes | 0.6844% | 0 / 20 |
| 2009-10-01 → 2009-11-01 | -3.8273% | 0.2826% | 4.8353% | -0.0095% | yes | 0.6844% | 1 / 21 |
| 2009-11-01 → 2009-12-01 | -3.864% | 0.2011% | 4.603% | 1.4475% | yes | 0.6938% | 0 / 19 |
| 2009-12-01 → 2010-01-01 | -3.8408% | 0.2586% | 4.7992% | -1.9293% | yes | 0.6755% | 0 / 21 |
| 2010-01-01 → 2010-02-01 | -3.7691% | 0.1194% | 4.396% | 1.2971% | yes | 0.6532% | 0 / 18 |
| 2010-02-01 → 2010-03-01 | -3.766% | 0.109% | 4.37% | 0.336% | yes | 0.6532% | 0 / 18 |
| 2010-03-01 → 2010-04-01 | -4.1575% | 0.1773% | 4.5556% | -0.1533% | yes | 0.6532% | 0 / 22 |
| 2010-04-01 → 2010-05-01 | -3.9964% | 0.0749% | 4.407% | 1.0112% | yes | 0.6528% | 0 / 20 |
| 2010-05-01 → 2010-06-01 | -3.8757% | 0.091% | 4.3821% | 1.2742% | yes | 0.6478% | 0 / 19 |
| 2010-06-01 → 2010-07-01 | -3.7766% | 0.1959% | 4.59% | 1.601% | yes | 0.623% | 0 / 21 |
| 2010-07-01 | no segment follows this rebalance, not scored | ||||||
Regime router, 2 lanes · regimes: defensive, offensive · 2 switches · switch cost 10.0 bps · cost drag 0.3%
| Regime | Pipeline A | Pipeline B |
|---|---|---|
| defensive | 0.0 | 1.0 |
| offensive | 1.0 | 0.0 |
Step 3 · 2010-07-01 → 2011-07-01
Portfolio book, rebalanced monthly · 13 constructions · 1 names held · selection: reselect · 0.0% in cash · turnover 1.0× · cost drag 0.1%
Projection accuracy, realized outcome fell inside the P5–P95 cone in 100.0% of 12 scored rebalances (a well-calibrated 90% band contains ~90.0%) · 95% VaR breached on 0.83% of 241 days (expected ~5.0%)
| Rebalance | P5 | Median | P95 | Realized | In band | VaR 95 (1d) | Breaches |
|---|---|---|---|---|---|---|---|
| 2010-07-01 → 2010-08-01 | -3.7704% | 0.218% | 4.458% | 0.9076% | yes | 0.623% | 0 / 20 |
| 2010-08-01 → 2010-09-01 | -3.6379% | 0.3035% | 4.6615% | 1.4244% | yes | 0.623% | 0 / 21 |
| 2010-09-01 → 2010-10-01 | -3.6082% | 0.3558% | 4.5685% | 0.2214% | yes | 0.6144% | 0 / 20 |
| 2010-10-01 → 2010-11-01 | -3.5861% | 0.3497% | 4.5311% | 0.2679% | yes | 0.6046% | 0 / 20 |
| 2010-11-01 → 2010-12-01 | -3.6203% | 0.308% | 4.4814% | -0.7946% | yes | 0.6041% | 0 / 20 |
| 2010-12-01 → 2011-01-01 | -3.4866% | 0.3647% | 4.6189% | -0.48% | yes | 0.5786% | 2 / 21 |
| 2011-01-01 → 2011-02-01 | -2.1149% | 0.4179% | 3.1166% | 0.0284% | yes | 0.5519% | 0 / 19 |
| 2011-02-01 → 2011-03-01 | -1.9912% | 0.1975% | 2.5616% | 0.5042% | yes | 0.5465% | 0 / 18 |
| 2011-03-01 → 2011-04-01 | -2.308% | 0.08% | 2.4449% | -0.1425% | yes | 0.5328% | 0 / 22 |
| 2011-04-01 → 2011-05-01 | -1.9459% | 0.1195% | 2.3096% | 1.4291% | yes | 0.5017% | 0 / 19 |
| 2011-05-01 → 2011-06-01 | -1.8539% | 0.2264% | 2.3945% | 1.1864% | yes | 0.4877% | 0 / 20 |
| 2011-06-01 → 2011-07-01 | -1.6747% | 0.2779% | 2.3921% | -0.8735% | yes | 0.4829% | 0 / 21 |
| 2011-07-01 | no segment follows this rebalance, not scored | ||||||
Regime router, 2 lanes · regimes: offensive · 1 switches · switch cost 10.0 bps · cost drag 0.1%
| Regime | Pipeline A | Pipeline B |
|---|---|---|
| offensive | 1.0 | 0.0 |
Step 4 · 2011-07-01 → 2012-06-29
Portfolio book, rebalanced monthly · 12 constructions · 1 names held · selection: reselect · 0.0% in cash · turnover 1.0× · cost drag 0.1%
Projection accuracy, realized outcome fell inside the P5–P95 cone in 100.0% of 12 scored rebalances (a well-calibrated 90% band contains ~90.0%) · 95% VaR breached on 2.5% of 240 days (expected ~5.0%)
| Rebalance | P5 | Median | P95 | Realized | In band | VaR 95 (1d) | Breaches |
|---|---|---|---|---|---|---|---|
| 2011-07-01 → 2011-08-01 | -1.7018% | 0.1868% | 2.1857% | 1.6541% | yes | 0.4816% | 0 / 19 |
| 2011-08-01 → 2011-09-01 | -1.6382% | 0.2999% | 2.2106% | 1.2764% | yes | 0.4629% | 3 / 22 |
| 2011-09-01 → 2011-10-01 | -1.5718% | 0.2869% | 2.2195% | 0.447% | yes | 0.4629% | 1 / 20 |
| 2011-10-01 → 2011-11-01 | -1.54% | 0.2805% | 2.1729% | -0.2809% | yes | 0.4465% | 0 / 20 |
| 2011-11-01 → 2011-12-01 | -1.5567% | 0.2319% | 2.0903% | -0.8071% | yes | 0.417% | 0 / 20 |
| 2011-12-01 → 2012-01-01 | -1.6125% | 0.1641% | 2.01% | 1.2955% | yes | 0.4216% | 0 / 20 |
| 2012-01-01 → 2012-02-01 | -1.5208% | 0.1978% | 2.0136% | 0.927% | yes | 0.4064% | 0 / 19 |
| 2012-02-01 → 2012-03-01 | -1.5343% | 0.1849% | 2.0013% | 0.1628% | yes | 0.4068% | 0 / 19 |
| 2012-03-01 → 2012-04-01 | -1.4521% | 0.2726% | 2.1355% | -0.3718% | yes | 0.4001% | 1 / 21 |
| 2012-04-01 → 2012-05-01 | -1.5038% | 0.1894% | 1.9779% | 0.894% | yes | 0.3993% | 1 / 19 |
| 2012-05-01 → 2012-06-01 | -1.4814% | 0.2336% | 2.0858% | 1.1148% | yes | 0.4001% | 0 / 21 |
| 2012-06-01 → window end | -1.4076% | 0.3055% | 2.0843% | -0.2688% | yes | 0.3947% | 0 / 20 |
Regime router, 2 lanes · regimes: offensive · 1 switches · switch cost 10.0 bps · cost drag 0.1%
| Regime | Pipeline A | Pipeline B |
|---|---|---|
| offensive | 1.0 | 0.0 |
Step 5 · 2012-07-02 → 2013-07-01
Portfolio book, rebalanced monthly · 13 constructions · 1 names held · selection: reselect · 0.0% in cash · turnover 1.0× · cost drag 0.1%
Projection accuracy, realized outcome fell inside the P5–P95 cone in 83.3% of 12 scored rebalances (a well-calibrated 90% band contains ~90.0%) · 95% VaR breached on 3.8% of 237 days (expected ~5.0%)
| Rebalance | P5 | Median | P95 | Realized | In band | VaR 95 (1d) | Breaches |
|---|---|---|---|---|---|---|---|
| 2012-07-01 → 2012-08-01 | -1.4466% | 0.2538% | 2.019% | 1.1681% | yes | 0.3823% | 0 / 20 |
| 2012-08-01 → 2012-09-01 | -1.5% | 0.2822% | 2.0364% | 0.1158% | yes | 0.3767% | 0 / 22 |
| 2012-09-01 → 2012-10-01 | -1.4093% | 0.1719% | 1.8689% | 0.2854% | yes | 0.3767% | 1 / 18 |
| 2012-10-01 → 2012-11-01 | -1.4964% | 0.1756% | 1.9108% | -0.0089% | yes | 0.3767% | 0 / 20 |
| 2012-11-01 → 2012-12-01 | -1.4993% | 0.1443% | 1.8495% | 0.4025% | yes | 0.3685% | 0 / 20 |
| 2012-12-01 → 2013-01-01 | -1.4606% | 0.1252% | 1.7984% | -0.4659% | yes | 0.3517% | 0 / 19 |
| 2013-01-01 → 2013-02-01 | -1.5114% | 0.1076% | 1.787% | -0.5047% | yes | 0.3519% | 0 / 20 |
| 2013-02-01 → 2013-03-01 | -1.3523% | 0.1122% | 1.6821% | 0.8095% | yes | 0.3354% | 0 / 18 |
| 2013-03-01 → 2013-04-01 | -1.2728% | 0.1673% | 1.6844% | 0.0633% | yes | 0.3199% | 0 / 19 |
| 2013-04-01 → 2013-05-01 | -1.2088% | 0.2133% | 1.7445% | 0.8773% | yes | 0.3017% | 0 / 21 |
| 2013-05-01 → 2013-06-01 | -1.141% | 0.2553% | 1.7584% | -2.0469% | no | 0.2909% | 3 / 21 |
| 2013-06-01 → 2013-07-01 | -1.2612% | 0.1343% | 1.6039% | -1.6151% | no | 0.2989% | 5 / 19 |
| 2013-07-01 | no segment follows this rebalance, not scored | ||||||
Regime router, 2 lanes · regimes: offensive · 1 switches · switch cost 10.0 bps · cost drag 0.1%
| Regime | Pipeline A | Pipeline B |
|---|---|---|
| offensive | 1.0 | 0.0 |
Step 6 · 2013-07-01 → 2014-07-01
Portfolio book, rebalanced monthly · 13 constructions · 1 names held · selection: reselect · 0.0% in cash · turnover 1.0× · cost drag 0.1%
Projection accuracy, realized outcome fell inside the P5–P95 cone in 91.7% of 12 scored rebalances (a well-calibrated 90% band contains ~90.0%) · 95% VaR breached on 3.75% of 240 days (expected ~5.0%)
| Rebalance | P5 | Median | P95 | Realized | In band | VaR 95 (1d) | Breaches |
|---|---|---|---|---|---|---|---|
| 2013-07-01 → 2013-08-01 | -1.4026% | 0.0514% | 1.6174% | 0.1306% | yes | 0.3121% | 2 / 21 |
| 2013-08-01 → 2013-09-01 | -1.5361% | -0.0115% | 1.6318% | -0.2629% | yes | 0.3224% | 3 / 21 |
| 2013-09-01 → 2013-10-01 | -1.533% | -0.0154% | 1.5848% | 1.3712% | yes | 0.3345% | 1 / 19 |
| 2013-10-01 → 2013-11-01 | -1.692% | -0.0397% | 1.5846% | 0.9071% | yes | 0.3363% | 0 / 22 |
| 2013-11-01 → 2013-12-01 | -1.5094% | -0.0856% | 1.4142% | -0.0093% | yes | 0.3345% | 1 / 19 |
| 2013-12-01 → 2014-01-01 | -1.533% | -0.0824% | 1.4197% | -0.3744% | yes | 0.3345% | 0 / 20 |
| 2014-01-01 → 2014-02-01 | -1.5332% | -0.1075% | 1.3684% | 1.4742% | no | 0.3253% | 0 / 20 |
| 2014-02-01 → 2014-03-01 | -1.379% | -0.0254% | 1.4239% | 0.037% | yes | 0.3226% | 0 / 18 |
| 2014-03-01 → 2014-04-01 | -1.4755% | -0.0442% | 1.4377% | -0.4061% | yes | 0.3226% | 2 / 20 |
| 2014-04-01 → 2014-05-01 | -1.5205% | -0.0872% | 1.3968% | 0.9764% | yes | 0.3345% | 0 / 20 |
| 2014-05-01 → 2014-06-01 | -1.4791% | -0.0502% | 1.4292% | 1.0318% | yes | 0.325% | 0 / 20 |
| 2014-06-01 → 2014-07-01 | -1.3944% | 0.0169% | 1.4777% | 0.2474% | yes | 0.3219% | 0 / 20 |
| 2014-07-01 | no segment follows this rebalance, not scored | ||||||
Regime router, 2 lanes · regimes: offensive · 1 switches · switch cost 10.0 bps · cost drag 0.1%
| Regime | Pipeline A | Pipeline B |
|---|---|---|
| offensive | 1.0 | 0.0 |
Step 7 · 2014-07-01 → 2015-07-01
Portfolio book, rebalanced monthly · 13 constructions · 1 names held · selection: reselect · 0.0% in cash · turnover 1.0× · cost drag 0.1%
Projection accuracy, realized outcome fell inside the P5–P95 cone in 91.7% of 12 scored rebalances (a well-calibrated 90% band contains ~90.0%) · 95% VaR breached on 7.08% of 240 days (expected ~5.0%)
| Rebalance | P5 | Median | P95 | Realized | In band | VaR 95 (1d) | Breaches |
|---|---|---|---|---|---|---|---|
| 2014-07-01 → 2014-08-01 | -1.4294% | -0.0313% | 1.4738% | -0.1284% | yes | 0.3214% | 2 / 21 |
| 2014-08-01 → 2014-09-01 | -1.4746% | -0.0582% | 1.408% | 0.7697% | yes | 0.325% | 0 / 20 |
| 2014-09-01 → 2014-10-01 | -1.4373% | -0.0258% | 1.4352% | -0.3106% | yes | 0.3251% | 0 / 20 |
| 2014-10-01 → 2014-11-01 | -1.5732% | -0.0758% | 1.394% | 0.5021% | yes | 0.3345% | 0 / 22 |
| 2014-11-01 → 2014-12-01 | -1.381% | -0.0509% | 1.3729% | 0.8479% | yes | 0.3345% | 0 / 18 |
| 2014-12-01 → 2015-01-01 | -1.469% | -0.0597% | 1.4575% | 0.0363% | yes | 0.3421% | 2 / 21 |
| 2015-01-01 → 2015-02-01 | -1.4612% | -0.0512% | 1.434% | 1.7658% | no | 0.3478% | 1 / 19 |
| 2015-02-01 → 2015-03-01 | -1.3358% | 0.0336% | 1.5002% | -0.8913% | yes | 0.3478% | 4 / 18 |
| 2015-03-01 → 2015-04-01 | -1.4472% | 0.022% | 1.6047% | 0.8873% | yes | 0.363% | 1 / 21 |
| 2015-04-01 → 2015-05-01 | -1.4806% | 0.0559% | 1.6484% | -0.6453% | yes | 0.3685% | 1 / 20 |
| 2015-05-01 → 2015-06-01 | -1.5135% | -0.0033% | 1.5889% | -0.1541% | yes | 0.3691% | 2 / 19 |
| 2015-06-01 → 2015-07-01 | -1.5718% | -0.0087% | 1.6769% | -0.8025% | yes | 0.384% | 4 / 21 |
| 2015-07-01 | no segment follows this rebalance, not scored | ||||||
Regime router, 2 lanes · regimes: offensive · 1 switches · switch cost 10.0 bps · cost drag 0.1%
| Regime | Pipeline A | Pipeline B |
|---|---|---|
| offensive | 1.0 | 0.0 |
Step 8 · 2015-07-01 → 2016-06-30
Portfolio book, rebalanced monthly · 12 constructions · 1 names held · selection: reselect · 0.0% in cash · turnover 1.0× · cost drag 0.1%
Projection accuracy, realized outcome fell inside the P5–P95 cone in 91.7% of 12 scored rebalances (a well-calibrated 90% band contains ~90.0%) · 95% VaR breached on 3.32% of 241 days (expected ~5.0%)
| Rebalance | P5 | Median | P95 | Realized | In band | VaR 95 (1d) | Breaches |
|---|---|---|---|---|---|---|---|
| 2015-07-01 → 2015-08-01 | -1.6976% | -0.0895% | 1.6454% | 1.1174% | yes | 0.403% | 1 / 21 |
| 2015-08-01 → 2015-09-01 | -1.5877% | 0.0353% | 1.719% | -0.4388% | yes | 0.403% | 1 / 20 |
| 2015-09-01 → 2015-10-01 | -1.4982% | 0.0854% | 1.7275% | 0.5137% | yes | 0.3908% | 1 / 20 |
| 2015-10-01 → 2015-11-01 | -1.4014% | 0.1114% | 1.7418% | -0.0091% | yes | 0.3852% | 1 / 21 |
| 2015-11-01 → 2015-12-01 | -1.3658% | 0.1242% | 1.6948% | -0.1926% | yes | 0.384% | 1 / 19 |
| 2015-12-01 → 2016-01-01 | -1.3892% | 0.0803% | 1.6634% | -0.7443% | yes | 0.3852% | 2 / 21 |
| 2016-01-01 → 2016-02-01 | -1.3879% | 0.0247% | 1.5382% | 1.2781% | yes | 0.3915% | 0 / 18 |
| 2016-02-01 → 2016-03-01 | -1.3837% | 0.0699% | 1.6016% | 1.0093% | yes | 0.3841% | 0 / 19 |
| 2016-03-01 → 2016-04-01 | -1.3576% | 0.1269% | 1.7265% | 1.1777% | yes | 0.3854% | 0 / 21 |
| 2016-04-01 → 2016-05-01 | -1.4001% | 0.0928% | 1.6393% | 0.3439% | yes | 0.3853% | 0 / 20 |
| 2016-05-01 → 2016-06-01 | -1.3908% | 0.1011% | 1.6467% | 0.0814% | yes | 0.3852% | 1 / 20 |
| 2016-06-01 → window end | -1.3459% | 0.1235% | 1.7064% | 1.9924% | no | 0.3853% | 0 / 21 |
Regime router, 2 lanes · regimes: defensive, offensive · 5 switches · switch cost 10.0 bps · cost drag 0.9%
| Regime | Pipeline A | Pipeline B |
|---|---|---|
| defensive | 0.0 | 1.0 |
| offensive | 1.0 | 0.0 |
Step 9 · 2016-07-01 → 2017-06-30
Portfolio book, rebalanced monthly · 13 constructions · 1 names held · selection: reselect · 0.0% in cash · turnover 1.0× · cost drag 0.1%
Projection accuracy, realized outcome fell inside the P5–P95 cone in 91.7% of 12 scored rebalances (a well-calibrated 90% band contains ~90.0%) · 95% VaR breached on 2.92% of 240 days (expected ~5.0%)
| Rebalance | P5 | Median | P95 | Realized | In band | VaR 95 (1d) | Breaches |
|---|---|---|---|---|---|---|---|
| 2016-07-01 → 2016-08-01 | -1.3426% | 0.1306% | 1.6832% | 0.3285% | yes | 0.3852% | 0 / 19 |
| 2016-08-01 → 2016-09-01 | -1.437% | 0.161% | 1.731% | 0.0178% | yes | 0.3852% | 0 / 22 |
| 2016-09-01 → 2016-10-01 | -1.3717% | 0.1429% | 1.7123% | -0.0356% | yes | 0.3852% | 1 / 20 |
| 2016-10-01 → 2016-11-01 | -1.3915% | 0.1257% | 1.6979% | -0.7048% | yes | 0.3908% | 0 / 20 |
| 2016-11-01 → 2016-12-01 | -1.4505% | 0.0648% | 1.635% | -2.5128% | no | 0.3852% | 4 / 20 |
| 2016-12-01 → 2017-01-01 | -1.6093% | -0.0378% | 1.5914% | 0.3529% | yes | 0.4013% | 1 / 20 |
| 2017-01-01 → 2017-02-01 | -1.5959% | -0.0476% | 1.5855% | 0.1109% | yes | 0.4058% | 1 / 19 |
| 2017-02-01 → 2017-03-01 | -1.5494% | -0.0545% | 1.5486% | 0.7876% | yes | 0.4059% | 0 / 18 |
| 2017-03-01 → 2017-04-01 | -1.7415% | -0.0617% | 1.59% | 0.4165% | yes | 0.402% | 0 / 22 |
| 2017-04-01 → 2017-05-01 | -1.5871% | -0.0996% | 1.4955% | 0.5337% | yes | 0.4013% | 0 / 18 |
| 2017-05-01 → 2017-06-01 | -1.5797% | -0.0368% | 1.6266% | 0.9473% | yes | 0.3935% | 0 / 21 |
| 2017-06-01 → 2017-07-01 | -1.5646% | -0.0522% | 1.5779% | 0.0274% | yes | 0.3928% | 0 / 21 |
| 2017-07-01 | no segment follows this rebalance, not scored | ||||||
Regime router, 2 lanes · regimes: offensive · 1 switches · switch cost 10.0 bps · cost drag 0.1%
| Regime | Pipeline A | Pipeline B |
|---|---|---|
| offensive | 1.0 | 0.0 |
Step 10 · 2017-07-03 → 2018-06-29
Portfolio book, rebalanced monthly · 13 constructions · 1 names held · selection: reselect · 0.0% in cash · turnover 1.0× · cost drag 0.1%
Projection accuracy, realized outcome fell inside the P5–P95 cone in 100.0% of 12 scored rebalances (a well-calibrated 90% band contains ~90.0%) · 95% VaR breached on 1.26% of 239 days (expected ~5.0%)
| Rebalance | P5 | Median | P95 | Realized | In band | VaR 95 (1d) | Breaches |
|---|---|---|---|---|---|---|---|
| 2017-07-01 → 2017-08-01 | -1.5046% | -0.0155% | 1.5543% | 0.5133% | yes | 0.3899% | 0 / 19 |
| 2017-08-01 → 2017-09-01 | -1.5094% | 0.0591% | 1.5996% | 0.6653% | yes | 0.3657% | 0 / 22 |
| 2017-09-01 → 2017-10-01 | -1.3675% | 0.0403% | 1.5229% | -0.3455% | yes | 0.3539% | 0 / 19 |
| 2017-10-01 → 2017-11-01 | -1.39% | 0.0239% | 1.5461% | 0.0366% | yes | 0.3454% | 0 / 21 |
| 2017-11-01 → 2017-12-01 | -1.3892% | 0.0236% | 1.4861% | -0.1921% | yes | 0.3411% | 1 / 20 |
| 2017-12-01 → 2018-01-01 | -1.3618% | -0.0032% | 1.427% | 0.1557% | yes | 0.3387% | 0 / 19 |
| 2018-01-01 → 2018-02-01 | -1.3358% | 0.0319% | 1.4471% | -0.9801% | yes | 0.3312% | 0 / 20 |
| 2018-02-01 → 2018-03-01 | -1.2909% | -0.0123% | 1.3558% | -0.6975% | yes | 0.3297% | 1 / 18 |
| 2018-03-01 → 2018-04-01 | -1.3996% | -0.0313% | 1.3845% | 0.5814% | yes | 0.3297% | 0 / 20 |
| 2018-04-01 → 2018-05-01 | -1.4023% | -0.0445% | 1.3602% | -0.8419% | yes | 0.3286% | 0 / 20 |
| 2018-05-01 → 2018-06-01 | -1.4525% | -0.1181% | 1.3175% | 0.7476% | yes | 0.3255% | 1 / 21 |
| 2018-06-01 → 2018-07-01 | -1.4997% | -0.139% | 1.2687% | 0.2262% | yes | 0.331% | 0 / 20 |
| 2018-07-01 | no segment follows this rebalance, not scored | ||||||
Regime router, 2 lanes · regimes: offensive · 1 switches · switch cost 10.0 bps · cost drag 0.1%
| Regime | Pipeline A | Pipeline B |
|---|---|---|
| offensive | 1.0 | 0.0 |
Step 11 · 2018-07-02 → 2019-07-01
Portfolio book, rebalanced monthly · 13 constructions · 1 names held · selection: reselect · 0.0% in cash · turnover 1.0× · cost drag 0.1%
Projection accuracy, realized outcome fell inside the P5–P95 cone in 75.0% of 12 scored rebalances (a well-calibrated 90% band contains ~90.0%) · 95% VaR breached on 1.26% of 238 days (expected ~5.0%)
| Rebalance | P5 | Median | P95 | Realized | In band | VaR 95 (1d) | Breaches |
|---|---|---|---|---|---|---|---|
| 2018-07-01 → 2018-08-01 | -1.4877% | -0.1304% | 1.2737% | 0.066% | yes | 0.331% | 1 / 20 |
| 2018-08-01 → 2018-09-01 | -1.5995% | -0.1634% | 1.2453% | 0.6717% | yes | 0.3359% | 0 / 22 |
| 2018-09-01 → 2018-10-01 | -1.4388% | -0.1872% | 1.1516% | -0.5091% | yes | 0.3359% | 1 / 18 |
| 2018-10-01 → 2018-11-01 | -1.633% | -0.2366% | 1.1327% | -0.6176% | yes | 0.331% | 1 / 22 |
| 2018-11-01 → 2018-12-01 | -1.5766% | -0.2555% | 1.1108% | 0.5175% | yes | 0.331% | 0 / 20 |
| 2018-12-01 → 2019-01-01 | -1.4412% | -0.2099% | 1.107% | 1.6126% | no | 0.3284% | 0 / 18 |
| 2019-01-01 → 2019-02-01 | -1.4575% | -0.1441% | 1.2141% | 0.8351% | yes | 0.3261% | 0 / 20 |
| 2019-02-01 → 2019-03-01 | -1.2129% | -0.0261% | 1.2425% | 0.0935% | yes | 0.2996% | 0 / 18 |
| 2019-03-01 → 2019-04-01 | -1.2868% | -0.0395% | 1.2494% | 2.2883% | no | 0.299% | 0 / 20 |
| 2019-04-01 → 2019-05-01 | -1.2415% | 0.0142% | 1.3118% | 0.2585% | yes | 0.2975% | 0 / 20 |
| 2019-05-01 → 2019-06-01 | -1.1804% | 0.0347% | 1.3403% | 1.845% | no | 0.2926% | 0 / 21 |
| 2019-06-01 → 2019-07-01 | -1.1334% | 0.0587% | 1.3113% | 0.8605% | yes | 0.2918% | 0 / 19 |
| 2019-07-01 | no segment follows this rebalance, not scored | ||||||
Regime router, 2 lanes · regimes: defensive, offensive · 3 switches · switch cost 10.0 bps · cost drag 0.5%
| Regime | Pipeline A | Pipeline B |
|---|---|---|
| defensive | 0.0 | 1.0 |
| offensive | 1.0 | 0.0 |
Step 12 · 2019-07-01 → 2020-06-30
Portfolio book, rebalanced monthly · 12 constructions · 1 names held · selection: reselect · 0.0% in cash · turnover 1.0× · cost drag 0.1%
Projection accuracy, realized outcome fell inside the P5–P95 cone in 75.0% of 12 scored rebalances (a well-calibrated 90% band contains ~90.0%) · 95% VaR breached on 9.13% of 241 days (expected ~5.0%)
| Rebalance | P5 | Median | P95 | Realized | In band | VaR 95 (1d) | Breaches |
|---|---|---|---|---|---|---|---|
| 2019-07-01 → 2019-08-01 | -1.1023% | 0.0953% | 1.3817% | 0.1079% | yes | 0.2877% | 2 / 21 |
| 2019-08-01 → 2019-09-01 | -1.116% | 0.0867% | 1.3787% | 1.9837% | no | 0.2918% | 0 / 21 |
| 2019-09-01 → 2019-10-01 | -1.0539% | 0.1613% | 1.4386% | -0.5885% | yes | 0.2877% | 5 / 19 |
| 2019-10-01 → 2019-11-01 | -1.2103% | 0.1482% | 1.4796% | 0.0265% | yes | 0.2964% | 3 / 22 |
| 2019-11-01 → 2019-12-01 | -1.1909% | 0.0821% | 1.4211% | -0.062% | yes | 0.2988% | 2 / 19 |
| 2019-12-01 → 2020-01-01 | -1.1837% | 0.1276% | 1.4836% | -0.1067% | yes | 0.3112% | 1 / 20 |
| 2020-01-01 → 2020-02-01 | -1.2159% | 0.1149% | 1.4913% | 1.7483% | no | 0.326% | 0 / 20 |
| 2020-02-01 → 2020-03-01 | -1.0888% | 0.1731% | 1.5229% | 1.6176% | no | 0.3183% | 1 / 18 |
| 2020-03-01 → 2020-04-01 | -1.093% | 0.2592% | 1.714% | -0.4916% | yes | 0.326% | 5 / 21 |
| 2020-04-01 → 2020-05-01 | -2.434% | 0.2683% | 3.1028% | 2.0657% | yes | 0.3318% | 2 / 20 |
| 2020-05-01 → 2020-06-01 | -2.3452% | 0.3361% | 3.1976% | 0.6674% | yes | 0.3384% | 1 / 19 |
| 2020-06-01 → window end | -2.32% | 0.3991% | 3.3667% | 0.7157% | yes | 0.343% | 0 / 21 |
Regime router, 2 lanes · regimes: defensive, offensive · 3 switches · switch cost 10.0 bps · cost drag 0.5%
| Regime | Pipeline A | Pipeline B |
|---|---|---|
| defensive | 0.0 | 1.0 |
| offensive | 1.0 | 0.0 |
Step 13 · 2020-07-01 → 2021-07-01
Portfolio book, rebalanced monthly · 13 constructions · 1 names held · selection: reselect · 0.0% in cash · turnover 1.0× · cost drag 0.1%
Projection accuracy, realized outcome fell inside the P5–P95 cone in 100.0% of 12 scored rebalances (a well-calibrated 90% band contains ~90.0%) · 95% VaR breached on 4.17% of 240 days (expected ~5.0%)
| Rebalance | P5 | Median | P95 | Realized | In band | VaR 95 (1d) | Breaches |
|---|---|---|---|---|---|---|---|
| 2020-07-01 → 2020-08-01 | -2.2633% | 0.4576% | 3.4273% | 1.2791% | yes | 0.343% | 0 / 21 |
| 2020-08-01 → 2020-09-01 | -2.2472% | 0.4792% | 3.3395% | -0.8626% | yes | 0.3318% | 2 / 20 |
| 2020-09-01 → 2020-10-01 | -2.303% | 0.4271% | 3.2916% | -0.304% | yes | 0.343% | 1 / 20 |
| 2020-10-01 → 2020-11-01 | -2.2574% | 0.4499% | 3.4042% | -0.6948% | yes | 0.3419% | 0 / 21 |
| 2020-11-01 → 2020-12-01 | -2.3208% | 0.3572% | 3.215% | 1.0237% | yes | 0.3419% | 1 / 19 |
| 2020-12-01 → 2021-01-01 | -2.2339% | 0.4849% | 3.4522% | 0.297% | yes | 0.3419% | 0 / 21 |
| 2021-01-01 → 2021-02-01 | -2.1393% | 0.4426% | 3.2427% | -0.6184% | yes | 0.3431% | 1 / 18 |
| 2021-02-01 → 2021-03-01 | -2.2029% | 0.3842% | 3.1901% | -1.6122% | yes | 0.3463% | 2 / 18 |
| 2021-03-01 → 2021-04-01 | -2.574% | 0.3595% | 3.2803% | -1.0948% | yes | 0.3704% | 3 / 22 |
| 2021-04-01 → 2021-05-01 | -2.5063% | 0.2653% | 3.1746% | 0.3946% | yes | 0.3837% | 0 / 20 |
| 2021-05-01 → 2021-06-01 | -2.4685% | 0.2519% | 3.1562% | 0.1399% | yes | 0.3724% | 0 / 19 |
| 2021-06-01 → 2021-07-01 | -2.4965% | 0.2455% | 3.2392% | 0.8747% | yes | 0.3703% | 0 / 21 |
| 2021-07-01 | no segment follows this rebalance, not scored | ||||||
Regime router, 2 lanes · regimes: offensive · 1 switches · switch cost 10.0 bps · cost drag 0.1%
| Regime | Pipeline A | Pipeline B |
|---|---|---|
| offensive | 1.0 | 0.0 |
Step 14 · 2021-07-01 → 2022-07-01
Portfolio book, rebalanced monthly · 13 constructions · 1 names held · selection: reselect · 0.0% in cash · turnover 1.0× · cost drag 0.1%
Projection accuracy, realized outcome fell inside the P5–P95 cone in 83.3% of 12 scored rebalances (a well-calibrated 90% band contains ~90.0%) · 95% VaR breached on 13.75% of 240 days (expected ~5.0%)
| Rebalance | P5 | Median | P95 | Realized | In band | VaR 95 (1d) | Breaches |
|---|---|---|---|---|---|---|---|
| 2021-07-01 → 2021-08-01 | -2.5183% | 0.2529% | 3.1617% | 1.1728% | yes | 0.3702% | 0 / 20 |
| 2021-08-01 → 2021-09-01 | -2.5163% | 0.24% | 3.2495% | -0.4119% | yes | 0.3702% | 1 / 21 |
| 2021-09-01 → 2021-10-01 | -2.5873% | 0.1868% | 3.0989% | -0.9488% | yes | 0.3702% | 2 / 20 |
| 2021-10-01 → 2021-11-01 | -2.6606% | 0.1128% | 3.0242% | -0.313% | yes | 0.3837% | 0 / 20 |
| 2021-11-01 → 2021-12-01 | -2.7176% | 0.0478% | 2.9504% | 0.3322% | yes | 0.383% | 3 / 20 |
| 2021-12-01 → 2022-01-01 | -2.6841% | 0.0672% | 3.0713% | -0.4798% | yes | 0.3699% | 0 / 21 |
| 2022-01-01 → 2022-02-01 | -2.668% | 0.0519% | 2.9559% | -1.3239% | yes | 0.3701% | 3 / 19 |
| 2022-02-01 → 2022-03-01 | -2.6428% | -0.0153% | 2.8361% | -1.1111% | yes | 0.3927% | 5 / 18 |
| 2022-03-01 → 2022-04-01 | -3.0138% | -0.0189% | 2.9652% | -3.3568% | no | 0.4144% | 6 / 22 |
| 2022-04-01 → 2022-05-01 | -3.0762% | -0.2314% | 2.8101% | -3.6347% | no | 0.4711% | 6 / 19 |
| 2022-05-01 → 2022-06-01 | -3.3488% | -0.4051% | 2.691% | 1.3121% | yes | 0.5019% | 3 / 20 |
| 2022-06-01 → 2022-07-01 | -2.3197% | -0.3845% | 1.6297% | -1.1472% | yes | 0.496% | 4 / 20 |
| 2022-07-01 | no segment follows this rebalance, not scored | ||||||
Regime router, 2 lanes · regimes: defensive, offensive · 2 switches · switch cost 10.0 bps · cost drag 0.3%
| Regime | Pipeline A | Pipeline B |
|---|---|---|
| defensive | 0.0 | 1.0 |
| offensive | 1.0 | 0.0 |
Step 15 · 2022-07-01 → 2023-06-30
Portfolio book, rebalanced monthly · 13 constructions · 1 names held · selection: reselect · 0.0% in cash · turnover 1.0× · cost drag 0.1%
Projection accuracy, realized outcome fell inside the P5–P95 cone in 41.7% of 12 scored rebalances (a well-calibrated 90% band contains ~90.0%) · 95% VaR breached on 7.95% of 239 days (expected ~5.0%)
| Rebalance | P5 | Median | P95 | Realized | In band | VaR 95 (1d) | Breaches |
|---|---|---|---|---|---|---|---|
| 2022-07-01 → 2022-08-01 | -2.4663% | -0.459% | 1.6685% | 1.6904% | no | 0.5568% | 1 / 19 |
| 2022-08-01 → 2022-09-01 | -2.6735% | -0.4458% | 1.7571% | -3.3771% | no | 0.5592% | 4 / 22 |
| 2022-09-01 → 2022-10-01 | -2.7885% | -0.5846% | 1.7156% | -3.7274% | no | 0.5879% | 3 / 20 |
| 2022-10-01 → 2022-11-01 | -3.1092% | -0.7588% | 1.6981% | -2.0741% | yes | 0.5977% | 2 / 20 |
| 2022-11-01 → 2022-12-01 | -3.2103% | -0.7918% | 1.7382% | 3.6159% | no | 0.606% | 0 / 20 |
| 2022-12-01 → 2023-01-01 | -3.1797% | -0.6157% | 2.0705% | -1.9114% | yes | 0.606% | 4 / 20 |
| 2023-01-01 → 2023-02-01 | -3.2363% | -0.652% | 2.1038% | 2.7265% | no | 0.6268% | 0 / 19 |
| 2023-02-01 → 2023-03-01 | -3.0528% | -0.5025% | 2.2631% | -3.3472% | no | 0.6276% | 2 / 18 |
| 2023-03-01 → 2023-04-01 | -3.6889% | -0.7701% | 2.1366% | 3.2325% | no | 0.6692% | 1 / 22 |
| 2023-04-01 → 2023-05-01 | -3.221% | -0.5145% | 2.4254% | 0.1403% | yes | 0.6757% | 1 / 18 |
| 2023-05-01 → 2023-06-01 | -3.4345% | -0.556% | 2.5919% | -0.1216% | yes | 0.6781% | 0 / 21 |
| 2023-06-01 → 2023-07-01 | -3.4366% | -0.4937% | 2.6016% | -0.6693% | yes | 0.6782% | 1 / 20 |
| 2023-07-01 | no segment follows this rebalance, not scored | ||||||
Regime router, 2 lanes · regimes: defensive, offensive · 1 switches · switch cost 10.0 bps · cost drag 0.1%
| Regime | Pipeline A | Pipeline B |
|---|---|---|
| defensive | 0.0 | 1.0 |
| offensive | 1.0 | 0.0 |
Step 16 · 2023-07-03 → 2024-06-28
Portfolio book, rebalanced monthly · 12 constructions · 1 names held · selection: reselect · 0.0% in cash · turnover 1.0× · cost drag 0.1%
Projection accuracy, realized outcome fell inside the P5–P95 cone in 91.7% of 12 scored rebalances (a well-calibrated 90% band contains ~90.0%) · 95% VaR breached on 4.62% of 238 days (expected ~5.0%)
| Rebalance | P5 | Median | P95 | Realized | In band | VaR 95 (1d) | Breaches |
|---|---|---|---|---|---|---|---|
| 2023-07-01 → 2023-08-01 | -3.4505% | -0.5321% | 2.5909% | 0.1025% | yes | 0.683% | 1 / 19 |
| 2023-08-01 → 2023-09-01 | -3.8292% | -0.6256% | 2.5738% | 0.031% | yes | 0.6989% | 0 / 22 |
| 2023-09-01 → 2023-10-01 | -3.6537% | -0.6406% | 2.5871% | -2.0825% | yes | 0.7166% | 1 / 19 |
| 2023-10-01 → 2023-11-01 | -3.8421% | -0.7871% | 2.5603% | -0.8805% | yes | 0.7239% | 3 / 21 |
| 2023-11-01 → 2023-12-01 | -3.953% | -0.7741% | 2.5779% | 3.4498% | no | 0.7824% | 1 / 20 |
| 2023-12-01 → 2024-01-01 | -3.7829% | -0.5872% | 2.8425% | 2.4992% | yes | 0.7849% | 0 / 19 |
| 2024-01-01 → 2024-02-01 | -3.7986% | -0.4939% | 2.9951% | 0.324% | yes | 0.7851% | 0 / 20 |
| 2024-02-01 → 2024-03-01 | -3.7473% | -0.5036% | 2.9794% | -2.0328% | yes | 0.7851% | 3 / 19 |
| 2024-03-01 → 2024-04-01 | -3.7899% | -0.5146% | 3.0034% | 0.4204% | yes | 0.7945% | 0 / 19 |
| 2024-04-01 → 2024-05-01 | -3.8246% | -0.5034% | 3.1457% | -1.764% | yes | 0.8101% | 1 / 21 |
| 2024-05-01 → 2024-06-01 | -3.8039% | -0.5091% | 3.1099% | 1.3121% | yes | 0.7942% | 0 / 21 |
| 2024-06-01 → window end | -3.4269% | -0.3127% | 3.0847% | 0.2789% | yes | 0.7851% | 1 / 18 |
Regime router, 2 lanes · regimes: offensive · 1 switches · switch cost 10.0 bps · cost drag 0.1%
| Regime | Pipeline A | Pipeline B |
|---|---|---|
| offensive | 1.0 | 0.0 |
Step 17 · 2024-07-01 → 2025-07-01
Portfolio book, rebalanced monthly · 13 constructions · 1 names held · selection: reselect · 0.0% in cash · turnover 1.0× · cost drag 0.1%
Projection accuracy, realized outcome fell inside the P5–P95 cone in 100.0% of 12 scored rebalances (a well-calibrated 90% band contains ~90.0%) · 95% VaR breached on 1.68% of 238 days (expected ~5.0%)
| Rebalance | P5 | Median | P95 | Realized | In band | VaR 95 (1d) | Breaches |
|---|---|---|---|---|---|---|---|
| 2024-07-01 → 2024-08-01 | -3.4541% | -0.1983% | 3.3761% | 2.9714% | yes | 0.7851% | 0 / 21 |
| 2024-08-01 → 2024-09-01 | -3.3236% | -0.0985% | 3.4409% | 1.0381% | yes | 0.7834% | 0 / 21 |
| 2024-09-01 → 2024-10-01 | -3.1912% | -0.0698% | 3.2771% | 0.9067% | yes | 0.7692% | 0 / 19 |
| 2024-10-01 → 2024-11-01 | -3.3518% | -0.0411% | 3.2683% | -2.7759% | yes | 0.7465% | 0 / 22 |
| 2024-11-01 → 2024-12-01 | -3.0777% | -0.0517% | 3.1895% | 1.5145% | yes | 0.7242% | 1 / 19 |
| 2024-12-01 → 2025-01-01 | -2.9014% | 0.1188% | 3.2973% | -2.0222% | yes | 0.7187% | 1 / 20 |
| 2025-01-01 → 2025-02-01 | -2.8371% | 0.1021% | 3.2472% | 0.5056% | yes | 0.7195% | 0 / 19 |
| 2025-02-01 → 2025-03-01 | -2.7428% | -0.0167% | 2.9448% | 2.1406% | yes | 0.7117% | 0 / 18 |
| 2025-03-01 → 2025-04-01 | -2.7724% | 0.0947% | 3.1073% | -0.242% | yes | 0.6942% | 0 / 20 |
| 2025-04-01 → 2025-05-01 | -2.8403% | -0.0331% | 2.9147% | 0.0606% | yes | 0.693% | 2 / 20 |
| 2025-05-01 → 2025-06-01 | -2.7274% | 0.0814% | 3.031% | -0.3353% | yes | 0.6867% | 0 / 20 |
| 2025-06-01 → 2025-07-01 | -2.7336% | -0.0534% | 2.807% | 1.7227% | yes | 0.6821% | 0 / 19 |
| 2025-07-01 | no segment follows this rebalance, not scored | ||||||
Regime router, 2 lanes · regimes: offensive · 1 switches · switch cost 10.0 bps · cost drag 0.1%
| Regime | Pipeline A | Pipeline B |
|---|---|---|
| offensive | 1.0 | 0.0 |
Step 18 · 2025-07-01 → 2026-07-01
Portfolio book, rebalanced monthly · 13 constructions · 1 names held · selection: reselect · 0.0% in cash · turnover 1.0× · cost drag 0.1%
Projection accuracy, realized outcome fell inside the P5–P95 cone in 100.0% of 12 scored rebalances (a well-calibrated 90% band contains ~90.0%) · 95% VaR breached on 1.26% of 239 days (expected ~5.0%)
| Rebalance | P5 | Median | P95 | Realized | In band | VaR 95 (1d) | Breaches |
|---|---|---|---|---|---|---|---|
| 2025-07-01 → 2025-08-01 | -2.6786% | -0.0182% | 2.8839% | -0.1721% | yes | 0.6567% | 0 / 21 |
| 2025-08-01 → 2025-09-01 | -2.5965% | 0.0686% | 2.8631% | 0.3228% | yes | 0.6567% | 0 / 20 |
| 2025-09-01 → 2025-10-01 | -2.5123% | 0.1158% | 2.8704% | 1.3958% | yes | 0.6495% | 0 / 20 |
| 2025-10-01 → 2025-11-01 | -2.5% | 0.2216% | 2.9257% | 0.3594% | yes | 0.6194% | 0 / 22 |
| 2025-11-01 → 2025-12-01 | -2.1798% | 0.1885% | 2.7514% | 0.7293% | yes | 0.6026% | 0 / 18 |
| 2025-12-01 → 2026-01-01 | -2.1191% | 0.3391% | 3.0146% | -0.1799% | yes | 0.5931% | 0 / 21 |
| 2026-01-01 → 2026-02-01 | -2.109% | 0.2136% | 2.6829% | 0.2804% | yes | 0.5607% | 0 / 19 |
| 2026-02-01 → 2026-03-01 | -2.0003% | 0.1411% | 2.4529% | 1.7153% | yes | 0.5197% | 0 / 18 |
| 2026-03-01 → 2026-04-01 | -2.0694% | 0.1287% | 2.5146% | -1.4005% | yes | 0.5197% | 2 / 21 |
| 2026-04-01 → 2026-05-01 | -2.2215% | 0.0104% | 2.3402% | 0.101% | yes | 0.5579% | 0 / 20 |
| 2026-05-01 → 2026-06-01 | -2.0742% | 0.0636% | 2.3323% | 0.1618% | yes | 0.5189% | 1 / 19 |
| 2026-06-01 → 2026-07-01 | -2.0772% | 0.0918% | 2.3545% | 0.304% | yes | 0.5105% | 0 / 20 |
| 2026-07-01 | no segment follows this rebalance, not scored | ||||||
Regime router, 2 lanes · regimes: offensive · 1 switches · switch cost 10.0 bps · cost drag 0.1%
| Regime | Pipeline A | Pipeline B |
|---|---|---|
| offensive | 1.0 | 0.0 |