

Dalio's Holy Grail, Measured and Then Walked at Five Breadths: Three, Five, Seven, Ten and Fifteen Funds
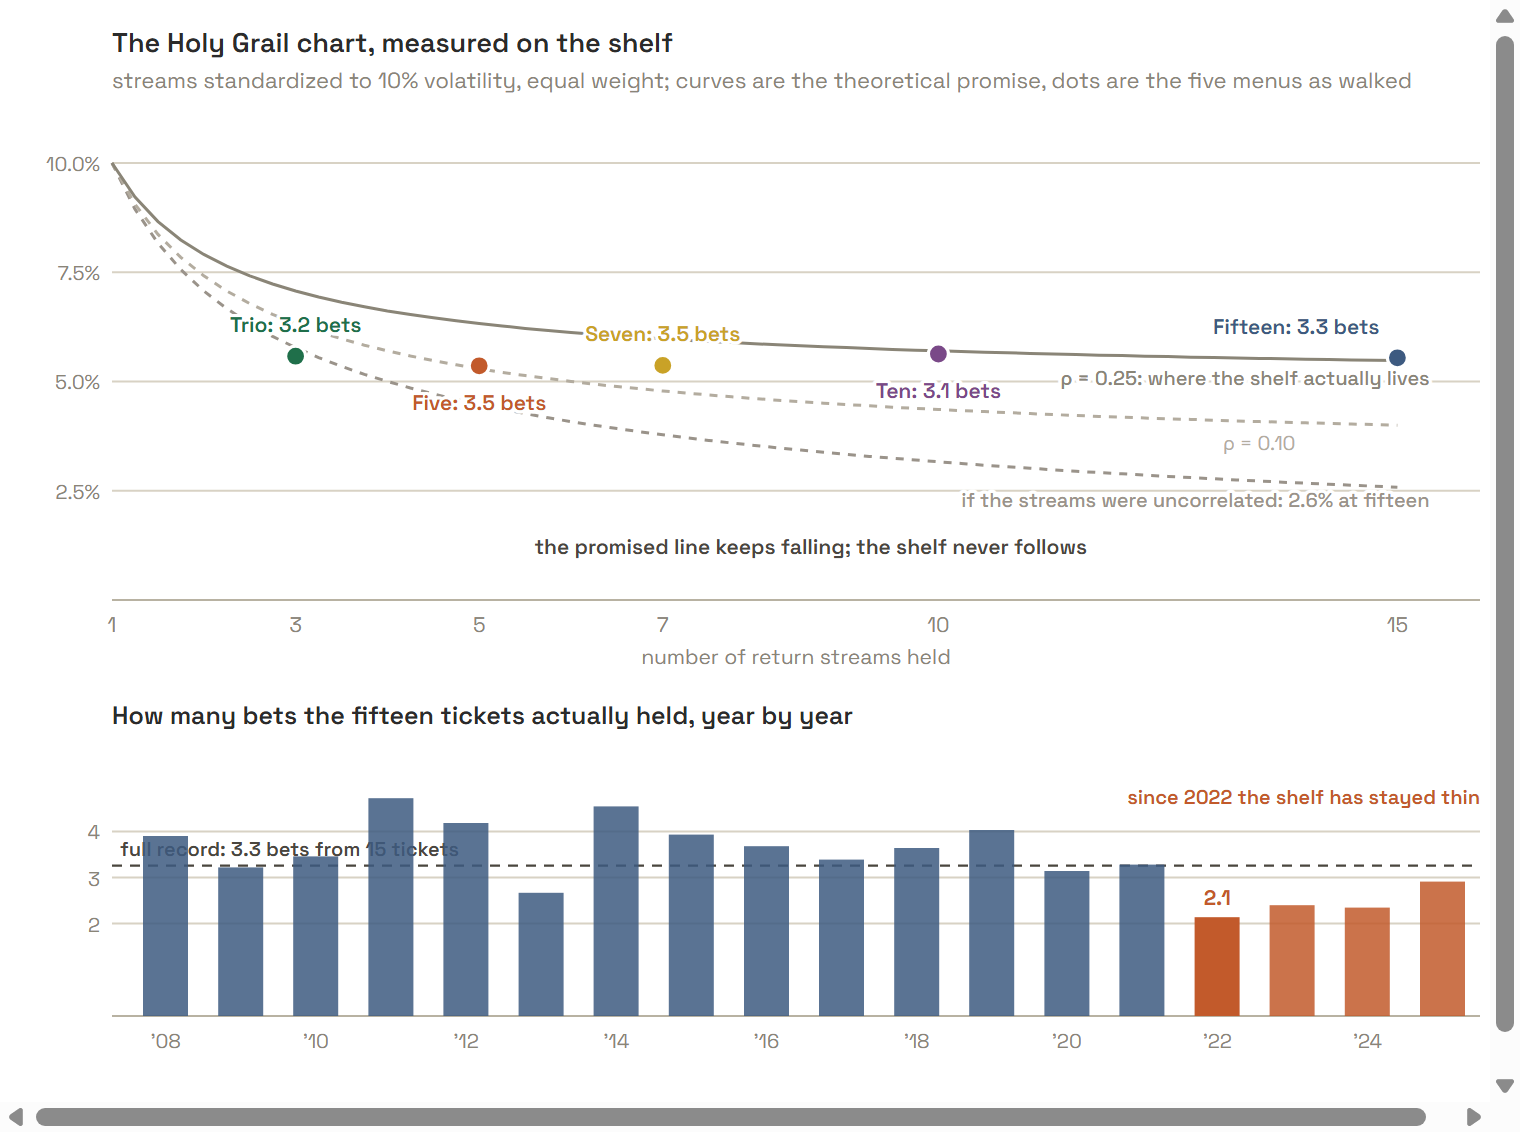
The most liquid fund shelf a person can buy holds 3.3 independent bets. Dalio's chart needs fifteen.
The Holy Grail of investing, in his words: find fifteen good, uncorrelated return streams and risk falls by roughly eighty percent while return stands still. At correlation zero, fifteen equal streams carry a quarter of one stream's volatility. Whether the shelf a person can actually buy supplies those streams is what this study measures, in his own units. Standardize every fund to ten percent volatility, weight them equally, and the composite's volatility inverts to the average pairwise correlation, which converts to a count of effective bets. Fifteen funds, 2008 through 2025: correlation 0.26, 3.3 bets. The ceiling across every breadth we cut is about 3.5; five funds reach it and nothing wider gets past it. In 2022 the count fell to 2.1 and it has not been above 3 since.
Then we walked it. Five rule-derived menus of the same shelf, three funds to fifteen, run under identical equal-risk-contribution machinery: quarterly, point-in-time, eighteen one-year windows from January 2008, total return net of costs, against a 60/40 SPY/AGG. The three-fund book returned 8.00 percent a year and the fifteen-fund book 3.78, half the rate for 28 percent less volatility. The trio led in sixteen of eighteen windows and 100.0 percent of paired bootstrap paths. Return floors at one fund per class: seven, ten and fifteen funds land within 0.13 points a year of each other. Breadth won two windows in eighteen years, the 2009 rebound and 2022, where the shelf lost 4.3 points less than the trio.
Every walk is a registered study on this platform; the circuits, per-window books and frozen records are linked below, and every line on Figure 1 can be switched on and off.
1 Methodology
The menus and their rules. Five fixed lists, frozen in the platform's code and selectable by name only, each breadth derived from a stated rule rather than picked by hand. TRIO: the three-asset book, SPY, TLT, GLD, equities, duration, metal. ALL SEASONS FIVE: the sleeves of Dalio's published retail recipe (SPY, TLT, IEF, GLD, DBC). CURATED SEVEN: exactly one fund per asset class the liquid shelf offers, equities SPY, duration TLT, inflation-linked TIP, metal GLD, commodity DBC, property VNQ, currency FXE. TEN: the seven plus the three broadest classes still missing, small-cap IWM, developed international EFA, investment-grade credit LQD. FIFTEEN: the full shelf, redundancies included, the ten plus Japan EWJ, emerging VWO, intermediate duration IEF, aggregate bonds AGG, silver SLV. The youngest fund, SLV, first trades in April 2006, and with a 252-day estimation window it dates the walk: eighteen one-year windows anchored each January 2008 through 2025.
The engine and the clock are shared. Every book runs identical machinery: equal risk contribution weights, re-estimated quarterly from the trailing year of data available that day, one-year windows, total return with dividends credited from the payment record, ten basis points per one-way traded dollar. The only sealed difference between the host's two arms is the menu name, and the only difference down the ladder is the menu name. Equal risk contribution solves for the weights at which every fund contributes the same share of the book's variance, so a fund that diversifies the others is given more money. It uses the full correlation matrix, which is why it is the harness for a claim about correlation. The sixth book re-runs the full shelf under inverse volatility, which sees each fund's own volatility and nothing else: a correlation-blind comparison, run to measure what the matrix is worth at fifteen funds. The eighteen seals of each walk sit close together on one August day because a supervisor registered each window's design and only then scored it, in order; the timestamps record that ordering.
The measurement, in the chart's own units. Dalio's exhibit plots portfolio volatility against the number of streams held, each stream at ten percent volatility, one curve per correlation level. We build that composite literally: each fund's daily return scaled to ten percent annualized volatility over the period being measured, equally weighted. The composite's volatility then inverts algebraically to the exact average pairwise correlation, and correlation converts to an effective number of bets, N over one plus N minus one times rho, the number of genuinely independent streams the menu behaves as. No estimation, no model; arithmetic on the same daily returns the walks traded.
The family and the rulers. Six book-and-weighting rules across five registered walks, declared as one search family of six before compilation; the deflated statistics in Table 1 use that count. The public ruler is a 60/40 SPY/AGG rebalanced monthly on the same total-return basis, the purple line. The platform's usual SPY reference is off on this page: every menu here holds SPY as one sleeve, the question is breadth against breadth, and a single equity index is not a ruler for that. The All Weather paper made the same call. The fifteen funds are among the most liquid in existence; every window priced every fund, and the census is empty. Sharpe, here and throughout, is each book's own daily series, the basis Table 1 prints.
2 Results
Findings
The bets ledger explains every result that follows. The trio's three assets are independent: average pairwise correlation minus 0.03, effective bets 3.2 from 3 tickets. Equities, duration and gold do not move together. Widen to the All Seasons five and the count rises to just 3.5, and that is the ceiling: seven funds hold 3.5, ten hold 3.1, all fifteen hold 3.3. Every fund added past the trio duplicates an exposure the book already holds. The year-by-year strip is sharper: the count fell to 2.1 in 2022 and has sat under 3 since. It is lowest in the years when diversification is needed most.
The walked returns follow that ledger, and Table 1 carries the full run. The return falls in two steps, three points of annual rate between three funds and five, another point between five and seven, and then nothing: seven, ten and fifteen funds all sit at roughly 3.8 to 3.9 a year with Sharpe between 0.57 and 0.60. Volatility does fall: 9.2 percent for the trio down to 6.6 for the shelf, a 28 percent reduction, which is what a correlation of 0.26 permits and nowhere near the promised three quarters. What the shelf delivered was half the compound rate for a quarter off the volatility, Sharpe 0.60 against the trio's 0.88.
The host comparative is one-sided. The trio led the fifteen-fund shelf in sixteen windows of eighteen, by 4.2 points of compound rate, in 100.0 percent of two thousand paired block-bootstrap paths. The two windows breadth won are the two the correlation ledger predicts. 2009: the junk rebound, plus 4.9 against minus 0.2, carried by emerging markets, credit and silver, none of which the trio holds. 2022: minus 12.3 against minus 16.6, four points of cushion in the year stocks and long bonds fell together and everything the trio held fell with them.
The 2022 cushion came from the inflation lines, not from breadth. The two smallest losses that year were the seven-fund book's 11.2 and the five-fund book's 11.6: both carry the commodity sleeve, the seven adds inflation-linked Treasuries, and the five's second, shorter Treasury line diluted the long-bond loss. Ten and fifteen funds lost 12.5 and 12.3, because small caps, international equity and credit fell with SPY and diluted the cushion. In the crash year the wider books lost more.
Which funds are added matters more than how many. The five-fund book beat the curated seven by 1.2 points a year. The seven swapped the second Treasury line for property and a currency pair, and paid for it twice: VNQ carries equity beta and dragged the seven's worst drawdown back to November 2008, and FXE is a driftless pair that consumed a seventh of the risk budget.
Reading the correlation matrix added nothing at fifteen funds. The inverse-volatility fifteen, blind to every off-diagonal, returned 4.06 a year at Sharpe 0.61, against equal risk contribution's 3.78 and 0.60 on the identical menu: inside noise, slight edge to the blind book. Our All Weather study found the same tie at five funds. On a long-only fund shelf the off-diagonals carry little information the diagonals do not, and scaling by own volatility does the work. I expected the matrix to matter at fifteen names, where there is more of it to read. It did not, and this is the second study that says so.
Every menu's worst drawdown lands in the same 18-to-23 band against the 60/40's 34.8, so the diversification claim holds at that level regardless of breadth; what breadth changes is which crisis sets the mark. The bond-heavy narrow menus bottomed in October 2022, the property-and-credit-carrying wide ones in 2008. The deepest of the family is the trio's 22.9, set in the year the shelf held 2.1 bets, which is the caveat that belongs beside the trio's 8.00 a year.
2.1 Headline
| Book | Total return | Per year | Volatility | Sharpe | Worst drawdown | Mean window |
|---|---|---|---|---|---|---|
| Trio (SPY, TLT, GLD), equal risk contribution | +299.5% | 8.00% | 9.2% | 0.88 | -22.9% | +8.60% |
| 60/40 SPY/AGG, rebalanced monthly (computed) (companion run) | +288.8% | 7.84% | 11.9% | 0.69 | -34.8% | +8.48% |
| All Seasons five (ERC) (companion run) | +144.2% | 5.08% | 7.1% | 0.73 | -18.4% | +5.34% |
| Fifteen funds, inverse volatility (companion run) | +104.7% | 4.06% | 6.9% | 0.61 | -20.0% | +4.31% |
| Ten funds (ERC) (companion run) | +99.4% | 3.91% | 7.1% | 0.57 | -19.8% | +4.14% |
| Curated seven, one per class (ERC) (companion run) | +97.1% | 3.84% | 6.9% | 0.58 | -18.9% | +4.07% |
| The full fifteen-fund shelf, equal risk contribution | +94.9% | 3.78% | 6.6% | 0.60 | -19.1% | +4.10% |
Volatility, Sharpe and worst drawdown are computed on each book's own stitched daily series over the identical trading days that Figure 2 draws, so the panel and the figure are the same arithmetic. Sharpe carries no cash hurdle. Mean window is the arithmetic average of the one-year window returns, each from its first close after the opening trade, and does not compound to the total beside it: the difference is volatility drag, plus that opening charge where the walk pays one.
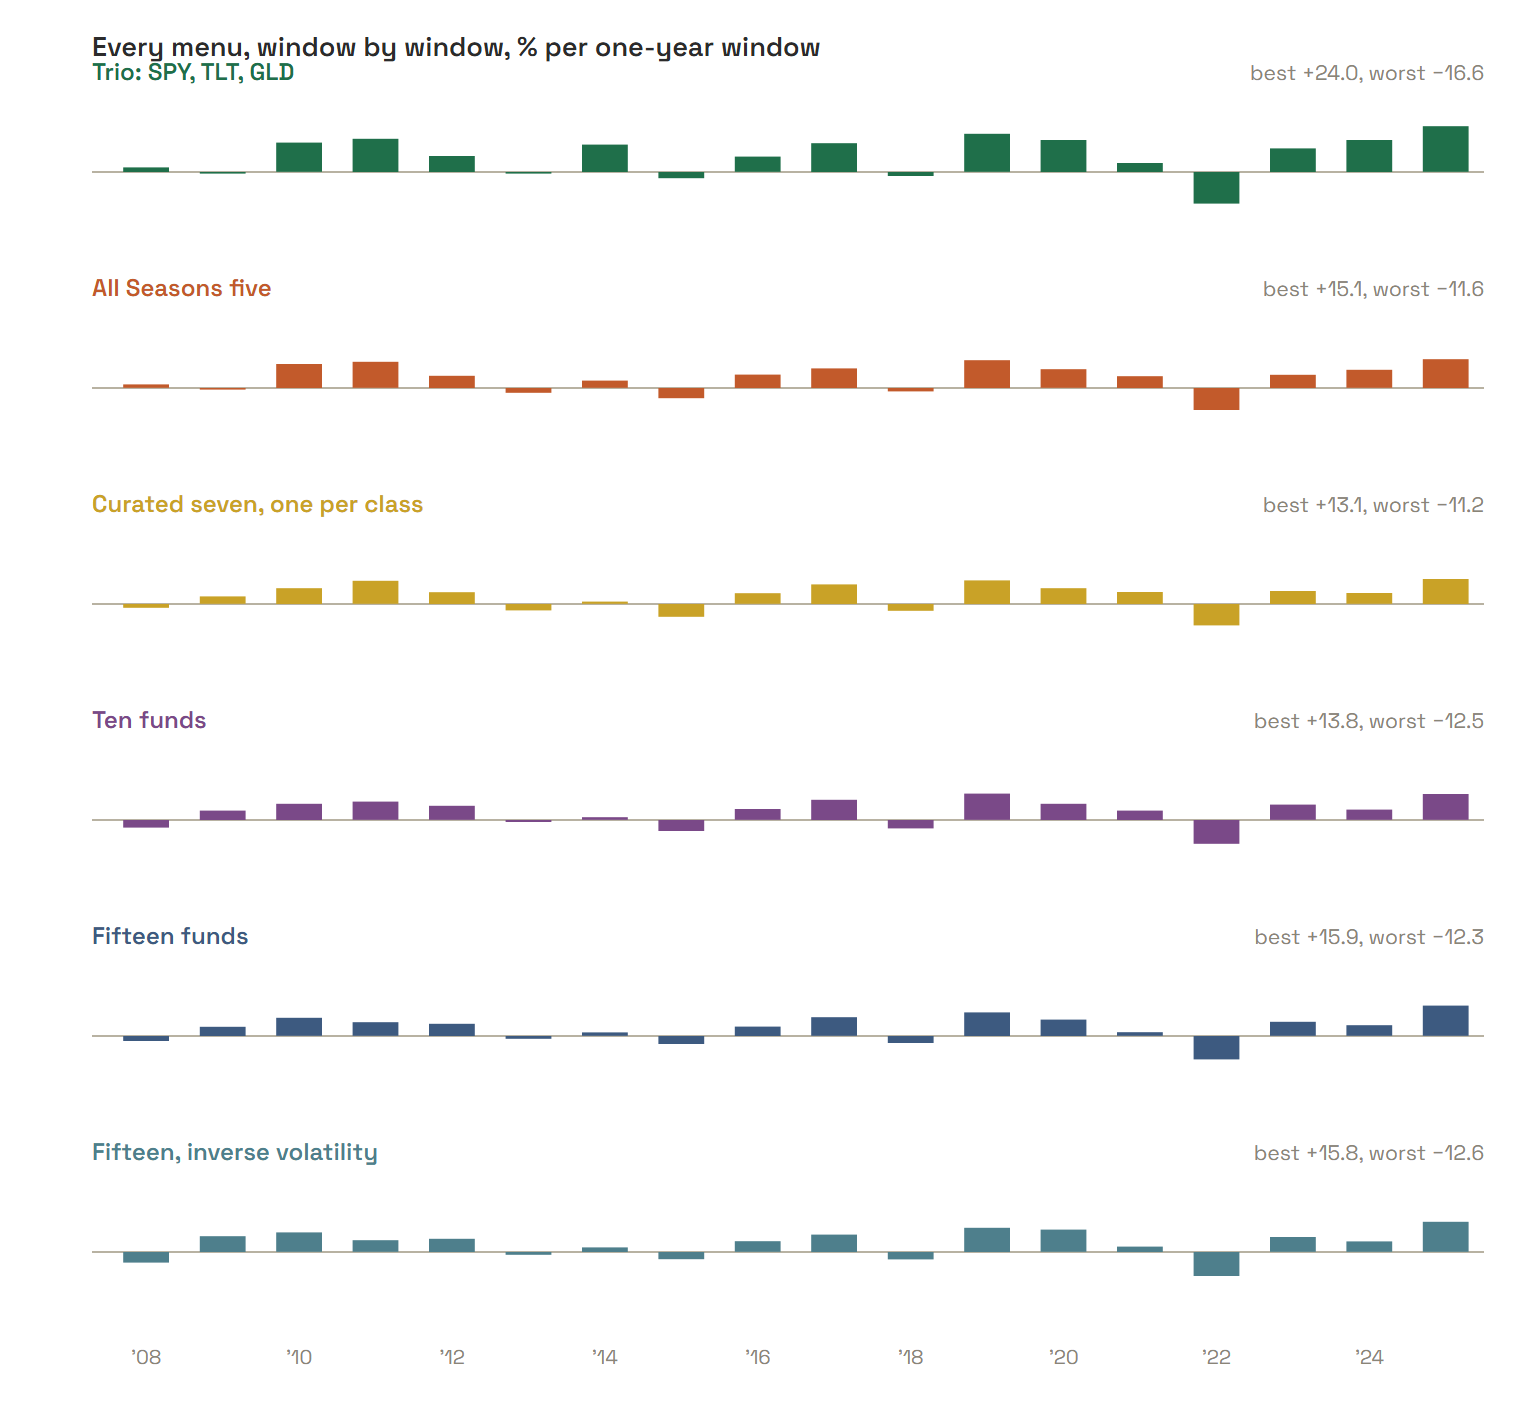
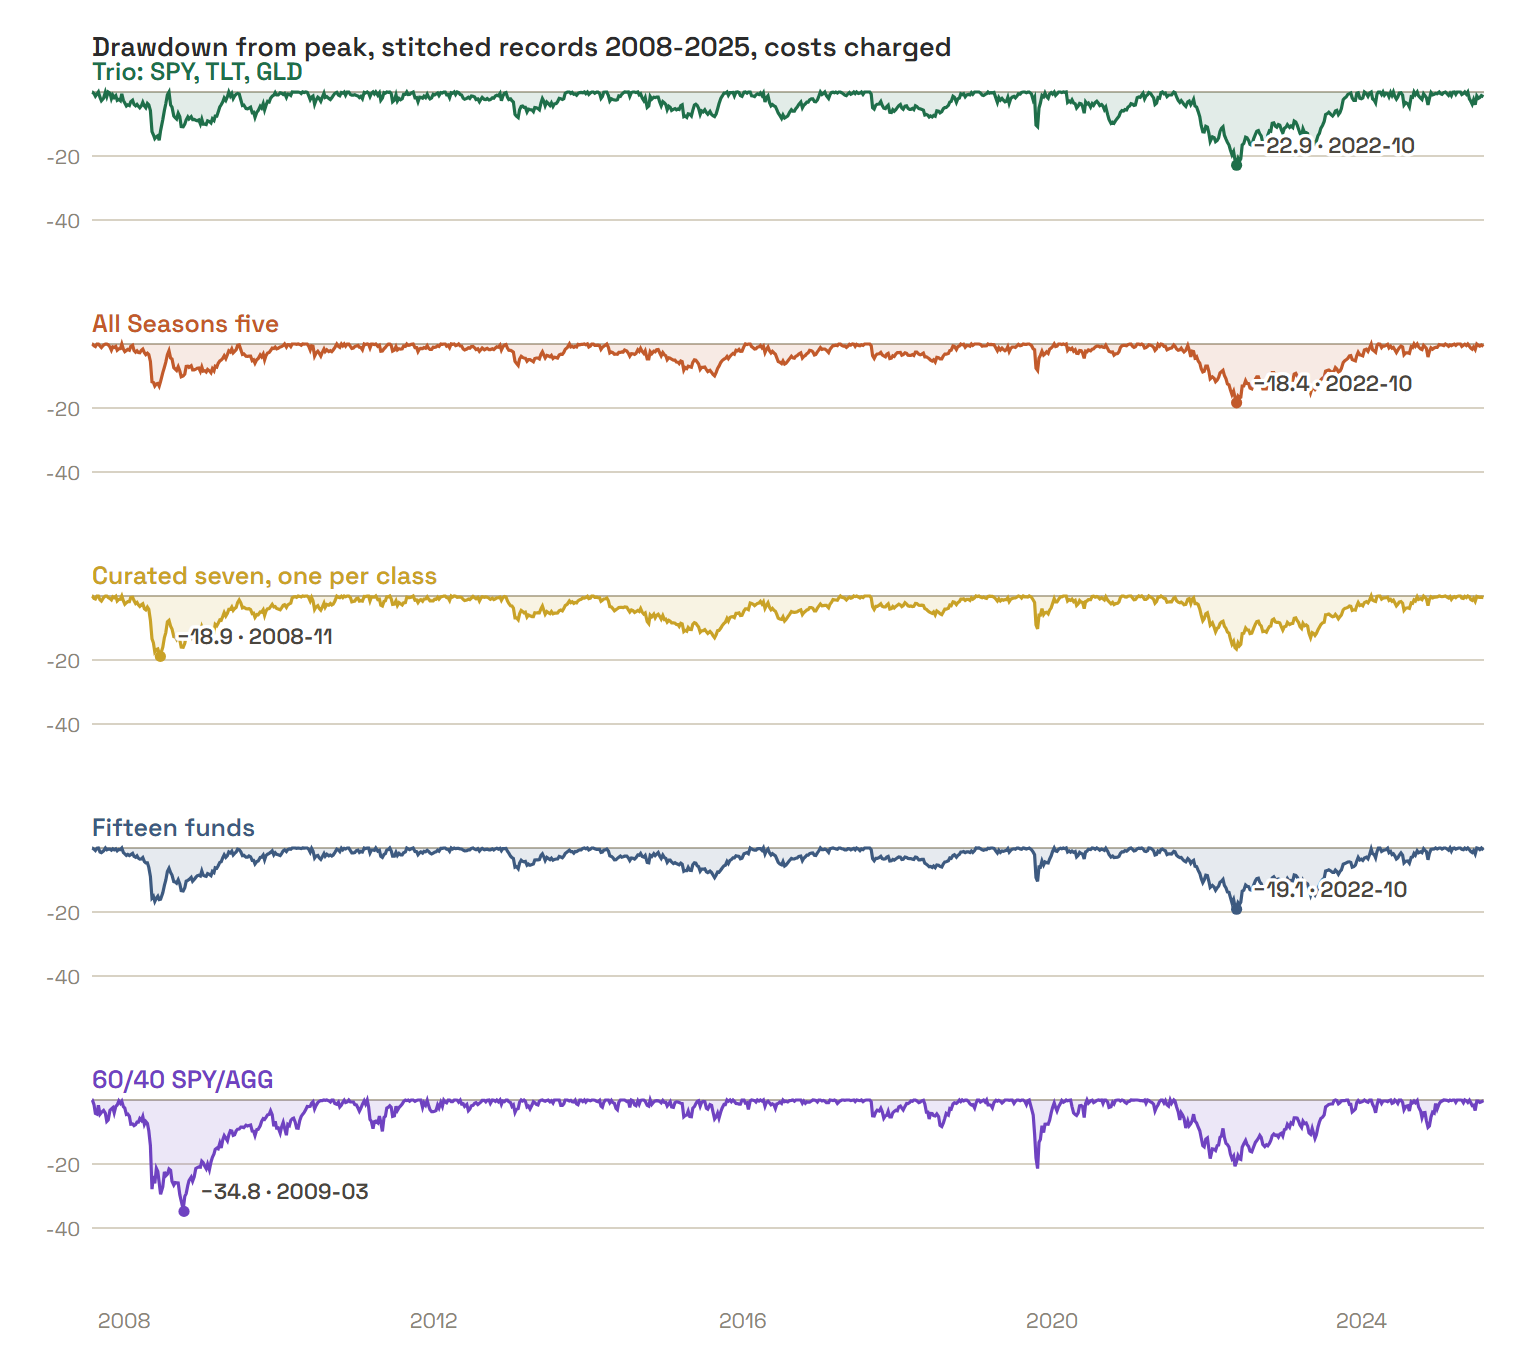
Table 2. Eighteen one-year windows, January 2008-2025, total return net of costs, chained on the charged basis Table 1 uses. DSR prob. is the probability the book survives deflation by the declared six-rule family.
| Book | Total | CAGR % a year | Worst DD | DSR prob. |
|---|---|---|---|---|
| Trio: SPY, TLT, GLD (ERC) | +299.5% | 8.00 | -22.9 (2022-10) | 0.99 |
| All Seasons five (ERC) | +144.2% | 5.08 | -18.4 (2022-10) | 0.97 |
| Curated seven, one per class (ERC) | +97.1% | 3.84 | -18.9 (2008-11) | 0.89 |
| Ten funds (ERC) | +99.4% | 3.91 | -19.8 (2008-10) | 0.88 |
| Fifteen funds (ERC) | +94.9% | 3.78 | -19.1 (2022-10) | 0.90 |
| Fifteen funds, inverse volatility | +104.7% | 4.06 | -20.0 (2008-10) | 0.91 |
| 60/40 SPY/AGG | +288.8% | 7.84 | -34.8 (2009-03) | ruler |
Table 3. Each menu passed through Dalio’s own construction: every fund standardized to ten percent volatility, equally weighted; the composite’s volatility inverts to the exact mean pairwise correlation, and effective bets are N over one plus N minus one times rho. Correlations print to three decimals so the count recomputes from the row. Full record, 2008-2025.
| Menu | Tickets | Mean pairwise corr | Effective bets | Realized book vol % | CAGR % a year |
|---|---|---|---|---|---|
| Trio | 3 | -0.032 | 3.2 | 9.2 | 8.00 |
| All Seasons five | 5 | 0.108 | 3.5 | 7.2 | 5.08 |
| Curated seven | 7 | 0.169 | 3.5 | 6.9 | 3.84 |
| Ten | 10 | 0.242 | 3.1 | 7.1 | 3.91 |
| Fifteen | 15 | 0.257 | 3.3 | 6.6 | 3.78 |
| The chart’s promise | 15 | 0.000 | 15.0 | never happens |
2.2 Per-step results
| # | Out-of-sample window | Trio (SPY, TLT, GLD), equal risk contribution SR | The full fifteen-fund shelf, equal risk contribution SR | All Seasons five (ERC) SR | Curated seven, one per class (ERC) SR | Ten funds (ERC) SR | Fifteen funds, inverse volatility SR |
|---|---|---|---|---|---|---|---|
| 1 | 2008-01-02 → 2008-12-31 | 0.26 | -0.20 | 0.24 | -0.13 | -0.30 | -0.43 |
| 2 | 2009-01-02 → 2009-12-31 | 0.04 | 0.62 | 0.03 | 0.45 | 0.56 | 0.95 |
| 3 | 2010-01-04 → 2010-12-31 | 1.81 | 1.69 | 1.85 | 1.29 | 1.34 | 1.65 |
| 4 | 2011-01-03 → 2011-12-30 | 1.90 | 1.21 | 1.99 | 1.72 | 1.40 | 0.93 |
| 5 | 2012-01-03 → 2012-12-31 | 1.38 | 1.77 | 1.39 | 1.39 | 1.71 | 1.77 |
| 6 | 2013-01-02 → 2013-12-31 | -0.04 | -0.21 | -0.37 | -0.49 | -0.11 | -0.21 |
| 7 | 2014-01-02 → 2014-12-31 | 2.49 | 0.51 | 0.87 | 0.34 | 0.38 | 0.69 |
| 8 | 2015-01-02 → 2015-12-31 | -0.38 | -0.74 | -0.84 | -1.07 | -0.96 | -0.68 |
| 9 | 2016-01-04 → 2016-12-30 | 1.12 | 1.01 | 1.25 | 1.02 | 1.06 | 1.15 |
| 10 | 2017-01-03 → 2017-12-29 | 3.11 | 2.65 | 2.49 | 2.55 | 2.73 | 2.53 |
| 11 | 2018-01-02 → 2018-12-31 | -0.24 | -0.76 | -0.28 | -0.66 | -0.84 | -0.85 |
| 12 | 2019-01-02 → 2019-12-31 | 2.73 | 3.06 | 2.77 | 2.74 | 3.13 | 3.11 |
| 13 | 2020-01-02 → 2020-12-31 | 1.25 | 0.93 | 1.10 | 0.93 | 0.84 | 1.14 |
| 14 | 2021-01-04 → 2021-12-31 | 0.60 | 0.44 | 1.06 | 1.20 | 0.93 | 0.61 |
| 15 | 2022-01-03 → 2022-12-30 | -1.27 | -1.20 | -1.01 | -1.11 | -1.17 | -1.22 |
| 16 | 2023-01-03 → 2023-12-29 | 1.22 | 0.97 | 0.84 | 0.92 | 1.04 | 1.02 |
| 17 | 2024-01-02 → 2024-12-31 | 1.71 | 0.83 | 1.31 | 0.94 | 0.83 | 0.83 |
| 18 | 2025-01-02 → 2025-12-31 | 2.13 | 2.33 | 2.01 | 2.07 | 1.97 | 2.35 |
2.2b The family, walk by walk
This paper answers for a declared family of 6 registered studies. 5 member walks are drawn as 6 lines (a comparative walk contributes one line per arm), each chained across its own out-of-sample windows, on one calendar axis, all rebased to 1× on the first session they share. Click a name to hide or show its line. The paper’s own walk is the heavy line; the dashed grey line is the study’s own benchmark.
 Open in the lab starts from the heavy lines marked with it, this study’s strategy.
| Walk | Windows | Span | Growth | CAGR | Worst drawdown | Pooled Sharpe |
|---|---|---|---|---|---|---|
| The ancient trio against the full shelf: three funds versus fifteen · Trio (SPY, TLT, GLD), equal risk contribution (this paper, the one the lab opens) | 18 | 2008-01-02 → 2025-12-31 | +299.5% | +8.0% | -22.9% | 0.90 |
| The ancient trio against the full shelf: three funds versus fifteen · The full fifteen-fund shelf, equal risk contribution (this paper, the one the lab opens) | 18 | 2008-01-02 → 2025-12-31 | +94.9% | +3.8% | -19.1% | 0.61 |
| Holy Grail ladder: the All Seasons five, equal risk contribution | 18 | 2008-01-02 → 2025-12-31 | +144.2% | +5.1% | -18.4% | 0.75 |
| Holy Grail ladder: one fund per asset class, equal risk contribution | 18 | 2008-01-02 → 2025-12-31 | +97.1% | +3.8% | -18.9% | 0.60 |
| Holy Grail ladder: ten funds, equal risk contribution | 18 | 2008-01-02 → 2025-12-31 | +99.4% | +3.9% | -19.8% | 0.59 |
| Holy Grail ladder: fifteen funds, inverse volatility | 18 | 2008-01-02 → 2025-12-31 | +104.7% | +4.1% | -20.0% | 0.63 |
| 60/40 SPY/AGG, rebalanced monthly (computed) (benchmark) | 2008-01-02 → 2025-12-31 | +288.8% | +7.8% | -34.8% |
2.3 Search accounting
This paper's search is a declared family: the Holy Grail family: six book-and-weighting rules on one fixed ETF shelf across five registered walks - the three-fund trio and the full fifteen-fund shelf under equal risk contribution as the two-arm comparative, the five-fund All Seasons sleeves, the curated seven (one fund per asset class) and the ten-fund book under equal risk contribution as single-arm walks, and the fifteen-fund shelf under inverse volatility as the correlation-blind twin - with a 60/40 SPY/AGG carried as the study benchmark, outside the family, counted at N = 6 evaluated books. Every member is either a registered walk with its own hypothesis and frozen record, or a derived average computed from those frozen records; every member is reported, in the family figure and table, and none was selected away. The count is declared by the author rather than derived from one project's ledger, because the members are sibling registered studies; the declaration names them and is frozen in this artifact. What the source strategy's author searched before publishing is not knowable from here and is not counted. The registered per-step record below still guarantees each window's hypothesis was hashed and registered before that window was scored.
2.4 The comparison
Both arms trade the same registered windows, so their returns can be PAIRED: inside each window the two return series are inner-joined date by date and the difference rTrio (SPY, TLT, GLD), equal risk contribution − rThe full fifteen-fund shelf, equal risk contribution is the object under test. Because this is ONE pre-declared contrast, frozen at registration before any window was scored, the paired statistic needs no multiple-testing deflation; the arm-level records carry the declared family count of §2.3 as their search accounting, and this contrast, registered per window before scoring, is not multiplied by it.
In the table: Arm A = Trio (SPY, TLT, GLD), equal risk contribution · Arm B = The full fifteen-fund shelf, equal risk contribution.
| # | Window | Paired bars | Arm A | Arm B | Δ | Leader | All Seasons five (ERC) | Curated seven, one per class (ERC) | Ten funds (ERC) | Fifteen funds, inverse volatility |
|---|---|---|---|---|---|---|---|---|---|---|
| 1 | 2008-01-03 → 2008-12-31 | 252 | +2.5% | -2.5% | +5.0 pp | Arm A | +1.8% | -2.0% | -4.0% | -5.6% |
| 2 | 2009-01-05 → 2009-12-31 | 251 | -0.2% | +4.9% | -5.1 pp | Arm B | -0.2% | +3.9% | +4.9% | +8.3% |
| 3 | 2010-01-05 → 2010-12-31 | 251 | +15.5% | +9.6% | +6.0 pp | Arm A | +12.6% | +8.3% | +8.5% | +10.2% |
| 4 | 2011-01-04 → 2011-12-30 | 251 | +17.6% | +7.3% | +10.2 pp | Arm A | +13.7% | +12.1% | +9.6% | +6.1% |
| 5 | 2012-01-04 → 2012-12-31 | 249 | +8.5% | +6.5% | +2.0 pp | Arm A | +6.4% | +6.2% | +7.4% | +6.9% |
| 6 | 2013-01-03 → 2013-12-31 | 251 | -0.6% | -1.4% | +0.7 pp | Arm A | -2.5% | -3.4% | -1.0% | -1.5% |
| 7 | 2014-01-03 → 2014-12-31 | 251 | +14.6% | +1.9% | +12.7 pp | Arm A | +3.8% | +1.2% | +1.4% | +2.4% |
| 8 | 2015-01-05 → 2015-12-31 | 251 | -3.2% | -4.1% | +0.9 pp | Arm A | -5.4% | -6.7% | -5.8% | -3.8% |
| 9 | 2016-01-05 → 2016-12-30 | 251 | +8.1% | +5.0% | +3.2 pp | Arm A | +7.0% | +5.6% | +5.7% | +5.6% |
| 10 | 2017-01-04 → 2017-12-29 | 250 | +15.2% | +9.9% | +5.4 pp | Arm A | +10.3% | +10.3% | +10.6% | +9.1% |
| 11 | 2018-01-03 → 2018-12-31 | 250 | -2.0% | -3.6% | +1.6 pp | Arm A | -1.8% | -3.6% | -4.4% | -3.9% |
| 12 | 2019-01-03 → 2019-12-31 | 251 | +20.1% | +12.5% | +7.6 pp | Arm A | +14.6% | +12.4% | +13.8% | +12.7% |
| 13 | 2020-01-03 → 2020-12-31 | 252 | +16.9% | +8.7% | +8.2 pp | Arm A | +9.8% | +8.3% | +8.5% | +11.7% |
| 14 | 2021-01-05 → 2021-12-31 | 251 | +4.8% | +2.0% | +2.7 pp | Arm A | +6.2% | +6.3% | +4.9% | +2.8% |
| 15 | 2022-01-04 → 2022-12-30 | 250 | -16.5% | -12.2% | -4.3 pp | Arm B | -11.6% | -11.2% | -12.5% | -12.6% |
| 16 | 2023-01-04 → 2023-12-29 | 249 | +12.5% | +7.5% | +5.0 pp | Arm A | +6.9% | +6.8% | +8.0% | +7.8% |
| 17 | 2024-01-03 → 2024-12-31 | 251 | +16.9% | +5.7% | +11.2 pp | Arm A | +9.5% | +5.7% | +5.4% | +5.5% |
| 18 | 2025-01-03 → 2025-12-31 | 249 | +24.2% | +16.0% | +8.2 pp | Arm A | +15.1% | +13.1% | +13.6% | +15.8% |
Paired Sharpe of the difference track: 0.97 · block bootstrap (2000 paths, block 10, seed 1234): P(Trio (SPY, TLT, GLD), equal risk contribution beats The full fifteen-fund shelf, equal risk contribution) = 100.0%.
Window win-rate. Trio (SPY, TLT, GLD), equal risk contribution led 16 of 18 windows (88.9%), The full fifteen-fund shelf, equal risk contribution led 2, and the mean window gap of +4.50 pp points the same way. Widest single window: 2014 at +12.7 pp.
| Period | Windows | Trio (SPY, TLT, GLD), equal risk contribution | The full fifteen-fund shelf, equal risk contribution | 60/40 SPY/AGG | Mean gap | Trio (SPY, TLT, GLD), equal risk contribution led |
|---|---|---|---|---|---|---|
| All windows | 18 | +8.60% | +4.10% | +8.46% | +4.50 pp | 16/18 |
| Before 2010 | 2 | +1.14% | +1.21% | -2.80% | -0.07 pp | 1/2 |
| 2010 onward | 16 | +9.53% | +4.46% | +9.87% | +5.07 pp | 15/16 |
The two eras disagree by 5.14 pp. The pooled figure is therefore not a standing property of either method, it is dominated by the later period. Read the two rows, not the average.
3 The circuit
The strategy is a circuit of platform primitives, frozen when the study is registered. Below is the circuit as wired on the canvas, the objective it encodes and how the search runs through it, followed by the mathematics each primitive actually computes, the same formulas the execution engine runs. The complete parameterisation is preserved in the study ledger (Appendix A).
The sentence below is the registration record, generated when the circuit was registered and printed verbatim; the authored description of the design is Section 1.
A COMPARATIVE study: The trio (SPY, TLT, GLD), equal risk contribution vs The full fifteen-fund shelf, equal risk contribution, walked on the same registered out-of-sample windows. The trio (SPY, TLT, GLD), equal risk contribution: A configured universe, rebalanced quarterly across the selected basket, and run out-of-sample from the anchor: anything the design estimates from history, where it estimates at all, is re-estimated at each anchor from pre-anchor data only, and the walk advances through registered out-of-sample windows; its disposition is the realized forward path versus the benchmark. The full fifteen-fund shelf, equal risk contribution: A configured universe, rebalanced quarterly across the selected basket, and run out-of-sample from the anchor: anything the design estimates from history, where it estimates at all, is re-estimated at each anchor from pre-anchor data only, and the walk advances through registered out-of-sample windows; its disposition is the realized forward path versus the benchmark. The arms differ in: Universe, hg_book: trio → fifteen. The contrast under test: whether The trio (SPY, TLT, GLD), equal risk contribution generates better risk-adjusted returns than The full fifteen-fund shelf, equal risk contribution over the identical out-of-sample windows.
Envelopes show counts, ratios, dates, and the parameters the author chose. Full price and per-name data series are not republished: the underlying market data is licensed to QuanterLab. Point figures quoted in the prose, a named holding's return over a stated span, are summary facts derived from public market prices, not redistributed series.
The objective and the search
The trio (SPY, TLT, GLD), equal risk contribution
| Universe | holy_grail, named fixed instrument lists, no membership reconstruction applies: trio {SPY, TLT, GLD}. |
|---|---|
| Validation & out-of-sample | portfolio forward test (buy-and-hold book) (1y horizon from the anchor, quarterly rebalance); overlays: Transaction Cost. |
| Other components | Combine: Portfolio Optimizer. |
The full fifteen-fund shelf, equal risk contribution
| Universe | holy_grail, named fixed instrument lists, no membership reconstruction applies: fifteen {SPY, IWM, EFA, EWJ, VWO, TLT, IEF, TIP, LQD, AGG, GLD, SLV, DBC, VNQ, FXE}. |
|---|
Every other specification row is identical to The trio (SPY, TLT, GLD), equal risk contribution's table above.
What differs between the arms, one difference; the comparison is clean:
- paramUniverse, hg_book: trio → fifteen
Companion book. All Seasons five (ERC) comes from a companion run of the identical configuration on its own registered anchor schedule. Its results run through this paper's tables under its own name.
Companion book. Curated seven, one per class (ERC) comes from a companion run of the identical configuration on its own registered anchor schedule. Its results run through this paper's tables under its own name.
Companion book. Ten funds (ERC) comes from a companion run of the identical configuration on its own registered anchor schedule. Its results run through this paper's tables under its own name.
Companion book. Fifteen funds, inverse volatility comes from a companion run of the identical configuration on its own registered anchor schedule. Its results run through this paper's tables under its own name.
Everything else is held identical, so an out-of-sample gap between the arms is attributable to this one change.
Cost elements are wired into the circuit, the realised drag is reported per step in Appendix B.
Show the mathematics, 4 primitives, formulas and parity notes
3.1 Price Loader
Bulk OHLCV fetch for the whole universe, point-in-time, no future bars.
Momentum, volatility, trend, every price-based metric needs history. This loads open/high/low/close/volume for all names in parallel, clipped so nothing after the anchor can leak in. The lookback window is derived automatically from the deepest metric you wired.
It loads exactly enough history for the hungriest downstream metric plus a warm-up buffer:
W = \max_k(\text{lookback}_k) + \text{buffer}, \qquad \text{bars} \le \text{anchor } t3.2 Portfolio Optimizer
MVO · HRP · IVOL, three rigorous ways to weight a pool.
Beyond simple rules, three portfolio-theory optimizers. MVO maximizes return per unit of risk on the efficient frontier; HRP spreads risk across correlation clusters with no return forecast; IVOL is the simplest risk-balanced rule. All re-solve point-in-time at every rebalance.
\max_{\mathbf w}\ \frac{\mathbf w^{\top}\boldsymbol\mu - r_f}{\sqrt{\mathbf w^{\top}\boldsymbol\Sigma\,\mathbf w}} \quad \text{s.t.}\ \ \mathbf 1^{\top}\mathbf w = 1,\ \ 0 \le w_i \le w_{\max}d_{ij} = \sqrt{\tfrac12\,(1-\rho_{ij})} \ \to\ \text{hierarchical clusters}\ \to\ \text{recursive inverse-variance bisection}w_i = \frac{1/\sigma_i}{\sum_j 1/\sigma_j}3.3 Portfolio Backtest
Replay the portfolio forward, rebalanced, point-in-time, with costs.
Holds the basket and rebalances on schedule, re-selecting and re-optimizing point-in-time at each rebalance (so it only ever uses information available then), and reports the equity curve, Sharpe, drawdown and trade stats, optionally net of cost and risk overlays.
E_t = E_{t-1}\big(1 + \mathbf w_{t}^{\top}\mathbf r_t - \text{costs}_t\big)\text{DD}_t = \frac{E_t}{\max_{\tau\le t}E_\tau} - 1, \qquad \text{MaxDD} = \min_t \text{DD}_t\text{charge}_t \;=\; \text{loan}_t \cdot \frac{\text{spread}}{252}, \qquad \text{loan}_t = \begin{cases}\max(0,\,-\text{cash}_t) & \text{institutional (netted)}\\ \max(0,\,\text{long MV}_t - E_t) & \text{retail (no netting)}\end{cases}\mathbf w_k = \{\, w_{k,i} : i \in \text{held} \,\}, \qquad \text{cash}_k = 1 - \textstyle\sum_{i \in \text{held}} w_{k,i}3.4 Transaction Cost
Charge for trading, slippage + commission on every turn.
Real trading isn't free. This deducts a cost proportional to how much you trade (turnover), in basis points, so the backtest reflects net, not gross, performance.
\text{cost}_t = \frac{\text{bps}}{10{,}000}\;\times\;\text{turnover}_t, \qquad \text{turnover}_t = \tfrac12\sum_i \lvert w_{i,t}-w_{i,t^-}\rvert4 Projection calibration, pooled across the walk
Every rebalance carried a Monte Carlo cone and a 95% VaR estimated before the segment it is scored against. Two questions, pooled over the whole study: did realized outcomes land inside the band as often as the band claims, and were VaR breaches as frequent as 5%?
This section is produced by the forward tester itself: every portfolio backtest fits the cone and the VaR estimate at each rebalance and scores them against the segment that followed. It does not require, and this circuit does not contain, a Monte Carlo primitive; that primitive is a separate, standalone analysis.
| Arm | Steps | Rebalances | In band | Coverage | Expected | VaR days | Breach rate | Expected |
|---|---|---|---|---|---|---|---|---|
| Trio (SPY, TLT, GLD), equal risk contribution | 18 | 85 | 62 / 72 | 86.1% ±4.08 | 90.0% | 4457 | 5.79% ±0.35 | 5.0% |
| The full fifteen-fund shelf, equal risk contribution | 18 | 85 | 61 / 72 | 84.7% ±4.24 | 90.0% | 4457 | 5.65% ±0.346 | 5.0% |
Note. The platform grades its own risk model in the appendix: across the six books the 90 percent Monte Carlo cones contained 84.7 to 86.1 percent of realized rebalance segments, and the one-day 95 percent VaR was breached on 5.30 to 5.81 percent of days against the 5 expected. The same appendix explains the occasional window that pairs a negative return with a positive annualised Sharpe: volatility drag, stated once.
± values are binomial standard errors on the estimate. A coverage figure below the expected band means the projection was over-confident; a breach rate above 5% means the same of the risk model. Both forecasts used only data prior to the segment scored.
5 Discussion
5.1 Interpretation
The chart is true. Nothing in this record contradicts the arithmetic: at correlation zero the risk of fifteen equal streams is a quarter of one stream's, and if the correlation on offer were zero, the fifteen-fund composite would have printed 2.6 percent volatility instead of 5.5. The 5.5 is the standardized composite of Dalio's construction; the walked book, un-standardized, ran 6.6. The chart assumes a correlation the shelf does not supply. Measured, it is 0.26. Bridgewater's own version of the grail is built from institutional return streams, alphas across asset classes, geographies and horizons, engineered to be near-independent. The ETF shelf sells repackagings of three exposures: equity beta, duration, and the dollar. Pass the fifteen most liquid funds through Dalio's own construction and the count comes back 3.3.
The bets count prices the rest of the record. A shelf that sells 3.5 independent bets makes every menu wider than five a dilution: the floor at 3.8 to 3.9 a year for seven, ten and fifteen funds follows from holding the same three exposures at the lower carry of the funds added. The ledger was computed before a single window was walked, and the walked ladder came out in its order.
The trio's 8.00 a year carries a caveat. Three-fund concentration won this era because this era paid duration and gold, the same regime that carried the All Seasons recipe past its optimized cousins in our All Weather study. The one year the era argument inverted, 2022, the trio printed the family's deepest loss while the widest books cushioned it. A reader who takes the trio from this paper and expects 8 percent forever is ignoring the strip under the exhibit: the count has printed between 2.1 and 2.9 since 2022, and at that level the trio's 3.2 is most of what is available.
The correlation-blind book is the third result. Equal risk contribution uses the full matrix and inverse volatility uses only the diagonal, and on the same fifteen funds they finish inside noise of each other, as they did at five funds in our previous study. On shelves where every fund is one of three exposures, the off-diagonals carry almost no information the diagonals did not already have. What would change the result is a genuinely new stream, and the liquid shelf does not offer one.
The strip under the exhibit is the part a reader can use today. The count swung between 2.7 and 4.5 through 2021, printed 2.1 in 2022, then 2.4, 2.4 and 2.9. Stock-bond correlation turned positive in 2022 and the count has stayed under 3 in the three years since: the shelf's diversification budget sits at the low of the record, and a book built from this shelf today starts from 2 to 3 independent bets, not fifteen. The appendix grades the platform's own risk model on this record and the grade is mixed, cones a touch too narrow and the daily loss floor broken slightly more often than designed; the numbers are printed there, not smoothed here.
Run your own fifteen. The construction is arithmetic on daily returns, the menus are named lists, and the circuit on this page runs unchanged on any list of tickers: swap the menu, walk the same eighteen windows, read your own ledger.
This study is one member of a declared search family: the same design walked at several settings across sibling registered projects, every member either a registered walk with its own frozen record or a derived average of those records, and every member reported. The family size is declared by the author and named in the lineage; it is the search-accounting count for this paper. What was searched before the source strategy was published is not knowable from here and is not counted.
5.2 Limitations
The record covers one era, and the era favoured the trio's assets. Fourteen of eighteen windows sit in the long bond bull; the trio's margin is concentrated there, and 2022 is the one window of the opposite regime. Two windows sit before 2010 and they split one each; everything in the pooled gap comes from the sixteen windows after. The return ladder's ordering is era-shaped and presented as description. The bets ledger is the more durable result, the shelf's correlation structure held between 2.7 and 4.5 effective bets through every regime in the record, but the 8.00-versus-3.78 gap is one era's record.
The menus follow stated rules, and the author chose the rules. Five ways of slicing one shelf, plus one weighting variation, declared as a family of six before compilation; the deflated probabilities in Table 1 carry that count, and every book survives it at 0.88 or better. No other breadths, weightings or fund substitutions were run. The fifteen-fund shelf itself is one opinion of what the liquid shelf is; a different fifteen would move the constants.
The correlation is measured daily, standardized within the period being measured, and the effective-bet count is the average-correlation formula, not an eigenvalue decomposition. Daily correlation understates crisis co-movement at longer horizons; measured monthly, the 2022 reading would come in below 2.1.
Costs are ten basis points per one-way traded dollar across the board, which treats FXE and SLV spreads the same as SPY's and flatters the wide menus slightly; the direction runs against the paper's conclusion. Taxes and financing are absent, and nothing here is levered.
References
- Dalio, R. (2017). Principles: Life and Work. Simon and Schuster. (The Holy Grail of investing: fifteen good, uncorrelated return streams; the risk-versus-streams exhibit.)
- Bridgewater Associates. The All Weather Story. Bridgewater research notes. (Return streams engineered for independence as the institutional form of the same claim.)
- Meucci, A. (2009). Managing Diversification. Risk 22(5), 74-79. (The effective number of bets as a diversification measure; this paper uses the average-correlation form, not Meucci’s eigenvalue form.)
- Maillard, S., Roncalli, T., Teiletche, J. (2010). The Properties of Equally Weighted Risk Contribution Portfolios. Journal of Portfolio Management 36(4), 60-70.
- QuanterLab Research (2026). Dalio's All Weather, constructed and then tested against alternatives. quanterlab.com/research/dalio-s-all-weather-constructed-and-then-tested-against-inverse-volatility-equal (Part one of this pair: the published recipe held up against its optimized cousins, and equal risk contribution tied inverse volatility at five funds.)
Appendix A Reproducibility in QuanterLab
Each step is backed by a frozen run report. The study is re-derivable from the ledger below.
| # | Commit | Report | Anchor | OOS window |
|---|---|---|---|---|
| 1 | 6579bb1f9c29 | 2086 | 2008-01-01 | 2008-01-02 → 2008-12-31 |
| 2 | 12df1f47e3c6 | 2087 | 2009-01-01 | 2009-01-02 → 2009-12-31 |
| 3 | 07a5b0f4f6e5 | 2088 | 2010-01-01 | 2010-01-04 → 2010-12-31 |
| 4 | 715f905d74e9 | 2089 | 2011-01-01 | 2011-01-03 → 2011-12-30 |
| 5 | b7448bd6cd37 | 2090 | 2012-01-01 | 2012-01-03 → 2012-12-31 |
| 6 | 9d7e1cd603a4 | 2091 | 2013-01-01 | 2013-01-02 → 2013-12-31 |
| 7 | 29d8a115e054 | 2092 | 2014-01-01 | 2014-01-02 → 2014-12-31 |
| 8 | 1041906f8d63 | 2093 | 2015-01-01 | 2015-01-02 → 2015-12-31 |
| 9 | f2bf4d3b0957 | 2094 | 2016-01-01 | 2016-01-04 → 2016-12-30 |
| 10 | ef2e11702d2d | 2095 | 2017-01-01 | 2017-01-03 → 2017-12-29 |
| 11 | 12f4461f4339 | 2096 | 2018-01-01 | 2018-01-02 → 2018-12-31 |
| 12 | 6a8a86aba926 | 2097 | 2019-01-01 | 2019-01-02 → 2019-12-31 |
| 13 | 9932c07302b8 | 2098 | 2020-01-01 | 2020-01-02 → 2020-12-31 |
| 14 | bebf0c9d8acd | 2099 | 2021-01-01 | 2021-01-04 → 2021-12-31 |
| 15 | d1a98f4b3aa2 | 2100 | 2022-01-01 | 2022-01-03 → 2022-12-30 |
| 16 | a23bac1781cc | 2101 | 2023-01-01 | 2023-01-03 → 2023-12-29 |
| 17 | 142f113a8b4b | 2102 | 2024-01-01 | 2024-01-02 → 2024-12-31 |
| 18 | b0715cb820e2 | 2103 | 2025-01-01 | 2025-01-02 → 2025-12-31 |
The methods the platform implements, for every study made on it, rest on these works.
- Gelman, A., & Loken, E. (2013). The garden of forking paths: Why multiple comparisons can be a problem, even when there is no “fishing expedition.” Working paper, Columbia University.
- Harvey, C. R., Liu, Y., & Zhu, H. (2016). … and the Cross-Section of Expected Returns. Review of Financial Studies, 29(1), 5–68. doi:10.1093/rfs/hhv059
- Lo, A. W. (2002). The Statistics of Sharpe Ratios. Financial Analysts Journal, 58(4), 36–52. doi:10.2469/faj.v58.n4.2453
Appendix A2 Registration record
What this record does and does not establish. Every window in this study is historical: the data existed before the study began, so this is sequential registration on past windows, not pre-registration in the clinical-trial sense, and no procedure could make it so. What the platform does enforce is order, each step's specification was frozen and hashed before that step was scored, and the walk cannot advance past a step that was never run or close one with a result registered for a different window. The two timestamp columns below are the evidence: read them together and each registration precedes its own run, and each run precedes the next registration. A study whose registrations all post-date its runs would show it here. Wall-clock spacing between registrations varies with the author's schedule and queue latency; the ordering, not the tempo, is the claim.
“A COMPARATIVE study: The trio (SPY, TLT, GLD), equal risk contribution vs The full fifteen-fund shelf, equal risk contribution, walked on the same registered out-of-sample windows. The trio (SPY, TLT, GLD), equal risk contribution: A configured universe, rebalanced quarterly across the selected basket, and run out-of-sample from the anchor: anything the design estimates from history, where it estimates at all, is re-estimated at each anchor from pre-anchor data only, and the walk advances through registered out-of-sample windows; its disposition is the realized forward path versus the benchmark. The full fifteen-fund shelf, equal risk contribution: A configured universe, rebalanced quarterly across the selected basket, and run out-of-sample from the anchor: anything the design estimates from history, where it estimates at all, is re-estimated at each anchor from pre-anchor data only, and the walk advances through registered out-of-sample windows; its disposition is the realized forward path versus the benchmark. The arms differ in: Universe, hg_book: trio → fifteen. The contrast under test: whether The trio (SPY, TLT, GLD), equal risk contribution generates better risk-adjusted returns than The full fifteen-fund shelf, equal risk contribution over the identical out-of-sample windows.”
The same hypothesis was registered independently at every step, hashed before each step's out-of-sample window was scored:
| # | Anchor | Registered at (UTC) | Run completed (UTC) |
|---|---|---|---|
| 1 | 2008-01-01 | 2026-08-30 16:13:54 | 2026-08-30 16:14:12 |
| 2 | 2009-01-01 | 2026-08-30 16:14:15 | 2026-08-30 16:14:30 |
| 3 | 2010-01-01 | 2026-08-30 16:14:33 | 2026-08-30 16:14:48 |
| 4 | 2011-01-01 | 2026-08-30 16:14:51 | 2026-08-30 16:15:06 |
| 5 | 2012-01-01 | 2026-08-30 16:15:09 | 2026-08-30 16:15:24 |
| 6 | 2013-01-01 | 2026-08-30 16:15:28 | 2026-08-30 16:15:43 |
| 7 | 2014-01-01 | 2026-08-30 16:15:46 | 2026-08-30 16:16:01 |
| 8 | 2015-01-01 | 2026-08-30 16:16:04 | 2026-08-30 16:16:19 |
| 9 | 2016-01-01 | 2026-08-30 16:16:22 | 2026-08-30 16:16:37 |
| 10 | 2017-01-01 | 2026-08-30 16:16:40 | 2026-08-30 16:16:55 |
| 11 | 2018-01-01 | 2026-08-30 16:16:58 | 2026-08-30 16:17:13 |
| 12 | 2019-01-01 | 2026-08-30 16:17:17 | 2026-08-30 16:17:32 |
| 13 | 2020-01-01 | 2026-08-30 16:17:35 | 2026-08-30 16:17:50 |
| 14 | 2021-01-01 | 2026-08-30 16:17:53 | 2026-08-30 16:18:08 |
| 15 | 2022-01-01 | 2026-08-30 16:18:11 | 2026-08-30 16:18:26 |
| 16 | 2023-01-01 | 2026-08-30 16:18:29 | 2026-08-30 16:18:44 |
| 17 | 2024-01-01 | 2026-08-30 16:18:47 | 2026-08-30 16:19:02 |
| 18 | 2025-01-01 | 2026-08-30 16:19:06 | 2026-08-30 16:19:21 |
The companion comparisons
This paper reads 4 more registered studies beside its own. Each one’s registration is printed here from their own record, in the same form as the table above: the hypothesis as it was registered, the day it was first locked, the time each window was registered and run, and what each window returned.
All Seasons five (ERC)
Its hypothesis was first locked on 30 August 2026, before its first window was run that day.
The same hypothesis was registered again, unchanged, at each of its 18 windows:
“A configured universe, rebalanced quarterly across the selected basket, and run out-of-sample from the anchor: anything the design estimates from history, where it estimates at all, is re-estimated at each anchor from pre-anchor data only, and the walk advances through registered out-of-sample windows; its disposition is the realized forward path versus the benchmark, is expected to generate positive risk-adjusted returns over the forward test window.”
| # | Anchor | Registered at (UTC) | Run completed (UTC) |
|---|---|---|---|
| 1 | 2008-01-01 | 2026-08-30 16:19:32 | 2026-08-30 16:19:50 |
| 2 | 2009-01-01 | 2026-08-30 16:19:53 | 2026-08-30 16:20:08 |
| 3 | 2010-01-01 | 2026-08-30 16:20:11 | 2026-08-30 16:20:26 |
| 4 | 2011-01-01 | 2026-08-30 16:20:29 | 2026-08-30 16:20:44 |
| 5 | 2012-01-01 | 2026-08-30 16:20:47 | 2026-08-30 16:21:02 |
| 6 | 2013-01-01 | 2026-08-30 16:21:05 | 2026-08-30 16:21:20 |
| 7 | 2014-01-01 | 2026-08-30 16:21:23 | 2026-08-30 16:21:38 |
| 8 | 2015-01-01 | 2026-08-30 16:21:41 | 2026-08-30 16:21:56 |
| 9 | 2016-01-01 | 2026-08-30 16:21:59 | 2026-08-30 16:22:14 |
| 10 | 2017-01-01 | 2026-08-30 16:22:17 | 2026-08-30 16:22:33 |
| 11 | 2018-01-01 | 2026-08-30 16:22:36 | 2026-08-30 16:22:51 |
| 12 | 2019-01-01 | 2026-08-30 16:22:54 | 2026-08-30 16:23:09 |
| 13 | 2020-01-01 | 2026-08-30 16:23:12 | 2026-08-30 16:23:27 |
| 14 | 2021-01-01 | 2026-08-30 16:23:30 | 2026-08-30 16:23:45 |
| 15 | 2022-01-01 | 2026-08-30 16:23:48 | 2026-08-30 16:24:03 |
| 16 | 2023-01-01 | 2026-08-30 16:24:06 | 2026-08-30 16:24:21 |
| 17 | 2024-01-01 | 2026-08-30 16:24:24 | 2026-08-30 16:24:39 |
| 18 | 2025-01-01 | 2026-08-30 16:24:42 | 2026-08-30 16:24:57 |
| # | Anchor | Returned |
|---|---|---|
| 1 | 2008-01-01 | +1.8% |
| 2 | 2009-01-01 | -0.2% |
| 3 | 2010-01-01 | +12.6% |
| 4 | 2011-01-01 | +13.7% |
| 5 | 2012-01-01 | +6.4% |
| 6 | 2013-01-01 | -2.5% |
| 7 | 2014-01-01 | +3.8% |
| 8 | 2015-01-01 | -5.4% |
| 9 | 2016-01-01 | +7.0% |
| 10 | 2017-01-01 | +10.3% |
| 11 | 2018-01-01 | -1.8% |
| 12 | 2019-01-01 | +14.6% |
| 13 | 2020-01-01 | +9.8% |
| 14 | 2021-01-01 | +6.2% |
| 15 | 2022-01-01 | -11.6% |
| 16 | 2023-01-01 | +6.9% |
| 17 | 2024-01-01 | +9.5% |
| 18 | 2025-01-01 | +15.1% |
Curated seven, one per class (ERC)
Its hypothesis was first locked on 30 August 2026, before its first window was run that day.
The same hypothesis was registered again, unchanged, at each of its 18 windows:
“A configured universe, rebalanced quarterly across the selected basket, and run out-of-sample from the anchor: anything the design estimates from history, where it estimates at all, is re-estimated at each anchor from pre-anchor data only, and the walk advances through registered out-of-sample windows; its disposition is the realized forward path versus the benchmark, is expected to generate positive risk-adjusted returns over the forward test window.”
| # | Anchor | Registered at (UTC) | Run completed (UTC) |
|---|---|---|---|
| 1 | 2008-01-01 | 2026-08-30 16:25:09 | 2026-08-30 16:25:27 |
| 2 | 2009-01-01 | 2026-08-30 16:25:30 | 2026-08-30 16:25:45 |
| 3 | 2010-01-01 | 2026-08-30 16:25:48 | 2026-08-30 16:26:03 |
| 4 | 2011-01-01 | 2026-08-30 16:26:06 | 2026-08-30 16:26:21 |
| 5 | 2012-01-01 | 2026-08-30 16:26:24 | 2026-08-30 16:26:39 |
| 6 | 2013-01-01 | 2026-08-30 16:26:42 | 2026-08-30 16:26:58 |
| 7 | 2014-01-01 | 2026-08-30 16:27:01 | 2026-08-30 16:27:16 |
| 8 | 2015-01-01 | 2026-08-30 16:27:19 | 2026-08-30 16:27:34 |
| 9 | 2016-01-01 | 2026-08-30 16:27:37 | 2026-08-30 16:27:52 |
| 10 | 2017-01-01 | 2026-08-30 16:27:55 | 2026-08-30 16:28:10 |
| 11 | 2018-01-01 | 2026-08-30 16:28:13 | 2026-08-30 16:28:28 |
| 12 | 2019-01-01 | 2026-08-30 16:28:31 | 2026-08-30 16:28:46 |
| 13 | 2020-01-01 | 2026-08-30 16:28:49 | 2026-08-30 16:29:04 |
| 14 | 2021-01-01 | 2026-08-30 16:29:07 | 2026-08-30 16:29:22 |
| 15 | 2022-01-01 | 2026-08-30 16:29:26 | 2026-08-30 16:29:41 |
| 16 | 2023-01-01 | 2026-08-30 16:29:44 | 2026-08-30 16:29:59 |
| 17 | 2024-01-01 | 2026-08-30 16:30:02 | 2026-08-30 16:30:17 |
| 18 | 2025-01-01 | 2026-08-30 16:30:20 | 2026-08-30 16:30:35 |
| # | Anchor | Returned |
|---|---|---|
| 1 | 2008-01-01 | -2.0% |
| 2 | 2009-01-01 | +3.9% |
| 3 | 2010-01-01 | +8.3% |
| 4 | 2011-01-01 | +12.1% |
| 5 | 2012-01-01 | +6.2% |
| 6 | 2013-01-01 | -3.4% |
| 7 | 2014-01-01 | +1.2% |
| 8 | 2015-01-01 | -6.7% |
| 9 | 2016-01-01 | +5.6% |
| 10 | 2017-01-01 | +10.3% |
| 11 | 2018-01-01 | -3.6% |
| 12 | 2019-01-01 | +12.4% |
| 13 | 2020-01-01 | +8.3% |
| 14 | 2021-01-01 | +6.3% |
| 15 | 2022-01-01 | -11.2% |
| 16 | 2023-01-01 | +6.8% |
| 17 | 2024-01-01 | +5.7% |
| 18 | 2025-01-01 | +13.1% |
Ten funds (ERC)
Its hypothesis was first locked on 30 August 2026, before its first window was run that day.
The same hypothesis was registered again, unchanged, at each of its 18 windows:
“A configured universe, rebalanced quarterly across the selected basket, and run out-of-sample from the anchor: anything the design estimates from history, where it estimates at all, is re-estimated at each anchor from pre-anchor data only, and the walk advances through registered out-of-sample windows; its disposition is the realized forward path versus the benchmark, is expected to generate positive risk-adjusted returns over the forward test window.”
| # | Anchor | Registered at (UTC) | Run completed (UTC) |
|---|---|---|---|
| 1 | 2008-01-01 | 2026-08-30 16:30:47 | 2026-08-30 16:31:05 |
| 2 | 2009-01-01 | 2026-08-30 16:31:08 | 2026-08-30 16:31:23 |
| 3 | 2010-01-01 | 2026-08-30 16:31:26 | 2026-08-30 16:31:41 |
| 4 | 2011-01-01 | 2026-08-30 16:31:44 | 2026-08-30 16:31:59 |
| 5 | 2012-01-01 | 2026-08-30 16:32:02 | 2026-08-30 16:32:17 |
| 6 | 2013-01-01 | 2026-08-30 16:32:20 | 2026-08-30 16:32:35 |
| 7 | 2014-01-01 | 2026-08-30 16:32:38 | 2026-08-30 16:32:53 |
| 8 | 2015-01-01 | 2026-08-30 16:32:56 | 2026-08-30 16:33:12 |
| 9 | 2016-01-01 | 2026-08-30 16:33:15 | 2026-08-30 16:33:30 |
| 10 | 2017-01-01 | 2026-08-30 16:33:33 | 2026-08-30 16:33:48 |
| 11 | 2018-01-01 | 2026-08-30 16:33:51 | 2026-08-30 16:34:06 |
| 12 | 2019-01-01 | 2026-08-30 16:34:09 | 2026-08-30 16:34:24 |
| 13 | 2020-01-01 | 2026-08-30 16:34:27 | 2026-08-30 16:34:42 |
| 14 | 2021-01-01 | 2026-08-30 16:34:45 | 2026-08-30 16:35:00 |
| 15 | 2022-01-01 | 2026-08-30 16:35:03 | 2026-08-30 16:35:18 |
| 16 | 2023-01-01 | 2026-08-30 16:35:22 | 2026-08-30 16:35:37 |
| 17 | 2024-01-01 | 2026-08-30 16:35:40 | 2026-08-30 16:35:55 |
| 18 | 2025-01-01 | 2026-08-30 16:35:58 | 2026-08-30 16:36:13 |
| # | Anchor | Returned |
|---|---|---|
| 1 | 2008-01-01 | -4.0% |
| 2 | 2009-01-01 | +4.9% |
| 3 | 2010-01-01 | +8.5% |
| 4 | 2011-01-01 | +9.6% |
| 5 | 2012-01-01 | +7.4% |
| 6 | 2013-01-01 | -1.0% |
| 7 | 2014-01-01 | +1.4% |
| 8 | 2015-01-01 | -5.8% |
| 9 | 2016-01-01 | +5.7% |
| 10 | 2017-01-01 | +10.6% |
| 11 | 2018-01-01 | -4.4% |
| 12 | 2019-01-01 | +13.8% |
| 13 | 2020-01-01 | +8.5% |
| 14 | 2021-01-01 | +4.9% |
| 15 | 2022-01-01 | -12.5% |
| 16 | 2023-01-01 | +8.0% |
| 17 | 2024-01-01 | +5.4% |
| 18 | 2025-01-01 | +13.6% |
Fifteen funds, inverse volatility
Its hypothesis was first locked on 30 August 2026, before its first window was run that day.
The same hypothesis was registered again, unchanged, at each of its 18 windows:
“A configured universe, rebalanced quarterly across the selected basket, and run out-of-sample from the anchor: anything the design estimates from history, where it estimates at all, is re-estimated at each anchor from pre-anchor data only, and the walk advances through registered out-of-sample windows; its disposition is the realized forward path versus the benchmark, is expected to generate positive risk-adjusted returns over the forward test window.”
| # | Anchor | Registered at (UTC) | Run completed (UTC) |
|---|---|---|---|
| 1 | 2008-01-01 | 2026-08-30 16:36:25 | 2026-08-30 16:36:42 |
| 2 | 2009-01-01 | 2026-08-30 16:36:45 | 2026-08-30 16:37:00 |
| 3 | 2010-01-01 | 2026-08-30 16:37:03 | 2026-08-30 16:37:18 |
| 4 | 2011-01-01 | 2026-08-30 16:37:21 | 2026-08-30 16:37:36 |
| 5 | 2012-01-01 | 2026-08-30 16:37:39 | 2026-08-30 16:37:55 |
| 6 | 2013-01-01 | 2026-08-30 16:37:58 | 2026-08-30 16:38:13 |
| 7 | 2014-01-01 | 2026-08-30 16:38:16 | 2026-08-30 16:38:31 |
| 8 | 2015-01-01 | 2026-08-30 16:38:34 | 2026-08-30 16:38:49 |
| 9 | 2016-01-01 | 2026-08-30 16:38:52 | 2026-08-30 16:39:07 |
| 10 | 2017-01-01 | 2026-08-30 16:39:10 | 2026-08-30 16:39:25 |
| 11 | 2018-01-01 | 2026-08-30 16:39:28 | 2026-08-30 16:39:43 |
| 12 | 2019-01-01 | 2026-08-30 16:39:46 | 2026-08-30 16:40:02 |
| 13 | 2020-01-01 | 2026-08-30 16:40:05 | 2026-08-30 16:40:20 |
| 14 | 2021-01-01 | 2026-08-30 16:40:23 | 2026-08-30 16:40:38 |
| 15 | 2022-01-01 | 2026-08-30 16:40:41 | 2026-08-30 16:40:56 |
| 16 | 2023-01-01 | 2026-08-30 16:40:59 | 2026-08-30 16:41:14 |
| 17 | 2024-01-01 | 2026-08-30 16:41:17 | 2026-08-30 16:41:32 |
| 18 | 2025-01-01 | 2026-08-30 16:41:35 | 2026-08-30 16:41:50 |
| # | Anchor | Returned |
|---|---|---|
| 1 | 2008-01-01 | -5.6% |
| 2 | 2009-01-01 | +8.3% |
| 3 | 2010-01-01 | +10.2% |
| 4 | 2011-01-01 | +6.1% |
| 5 | 2012-01-01 | +6.9% |
| 6 | 2013-01-01 | -1.5% |
| 7 | 2014-01-01 | +2.4% |
| 8 | 2015-01-01 | -3.8% |
| 9 | 2016-01-01 | +5.6% |
| 10 | 2017-01-01 | +9.1% |
| 11 | 2018-01-01 | -3.9% |
| 12 | 2019-01-01 | +12.7% |
| 13 | 2020-01-01 | +11.7% |
| 14 | 2021-01-01 | +2.8% |
| 15 | 2022-01-01 | -12.6% |
| 16 | 2023-01-01 | +7.8% |
| 17 | 2024-01-01 | +5.5% |
| 18 | 2025-01-01 | +15.8% |
Appendix B Per-step diagnostics
Realized in the projection tables below is the risk engine scoring its own forecast: the buy-and-hold return of the segment that followed each rebalance, on the same gross basis the cone was projected on. It is deliberately not the charged, calendar-window total return the study’s tables print, so the two will not reconcile line by line; the cone and its outcome share one basis, which is what a calibration test requires. Each row names its segment’s span so a boundary session is visible.
Names held is the union across the window: the count of distinct instruments the book touched between the window’s first and last session, not the number it held at one time. A book that rotates monthly touches more names than it holds.
What each step's run actually did beyond its return: the portfolio book's rebalancing and cost drag. Harvested from the frozen run reports, present where the circuit produced them. Cost drag is the gap between the step's return before and after its trading costs, in percentage points of the step's starting capital, so on a book that trades every session and compounds it can exceed the step's own net return.
Open the full per-step grid (18 steps: every rebalance, per window)
Step 1 · 2008-01-02 → 2008-12-31
Trio (SPY, TLT, GLD), equal risk contribution
Portfolio book, rebalanced quarterly · 4 constructions · 3 names held · selection: reselect · 0.0% in cash · turnover 1.2× · cost drag 0.12%
Projection accuracy, realized outcome fell inside the P5–P95 cone in 100.0% of 4 scored rebalances (a well-calibrated 90% band contains ~90.0%) · 95% VaR breached on 14.06% of 249 days (expected ~5.0%)
| Rebalance | P5 | Median | P95 | Realized | In band | VaR 95 (1d) | Breaches |
|---|---|---|---|---|---|---|---|
| 2008-01-01 → 2008-04-01 | -3.8179% | 2.2123% | 8.0181% | -0.1098% | yes | 0.6463% | 7 / 60 |
| 2008-04-01 → 2008-07-01 | -4.689% | 1.8037% | 8.1107% | -1.413% | yes | 0.7651% | 4 / 63 |
| 2008-07-01 → 2008-10-01 | -4.7416% | 1.5279% | 7.6054% | -2.3743% | yes | 0.7188% | 5 / 63 |
| 2008-10-01 → window end | -4.7961% | 1.2% | 6.9978% | 4.8647% | yes | 0.7072% | 19 / 63 |
The full fifteen-fund shelf, equal risk contribution
Portfolio book, rebalanced quarterly · 4 constructions · 15 names held · selection: reselect · 0.0% in cash · turnover 1.4× · cost drag 0.14%
Projection accuracy, realized outcome fell inside the P5–P95 cone in 75.0% of 4 scored rebalances (a well-calibrated 90% band contains ~90.0%) · 95% VaR breached on 14.86% of 249 days (expected ~5.0%)
| Rebalance | P5 | Median | P95 | Realized | In band | VaR 95 (1d) | Breaches |
|---|---|---|---|---|---|---|---|
| 2008-01-01 → 2008-04-01 | -2.9987% | 0.9908% | 4.7575% | 1.8393% | yes | 0.4559% | 5 / 60 |
| 2008-04-01 → 2008-07-01 | -3.1159% | 1.4006% | 5.7035% | -0.6519% | yes | 0.5322% | 5 / 63 |
| 2008-07-01 → 2008-10-01 | -3.406% | 1.1388% | 5.4703% | -6.0267% | no | 0.533% | 8 / 63 |
| 2008-10-01 → window end | -3.8635% | 0.6606% | 4.9725% | 0.6148% | yes | 0.5333% | 19 / 63 |
Step 2 · 2009-01-02 → 2009-12-31
Trio (SPY, TLT, GLD), equal risk contribution
Portfolio book, rebalanced quarterly · 5 constructions · 3 names held · selection: reselect · 0.0% in cash · turnover 1.2× · cost drag 0.12%
Projection accuracy, realized outcome fell inside the P5–P95 cone in 75.0% of 4 scored rebalances (a well-calibrated 90% band contains ~90.0%) · 95% VaR breached on 7.66% of 248 days (expected ~5.0%)
| Rebalance | P5 | Median | P95 | Realized | In band | VaR 95 (1d) | Breaches |
|---|---|---|---|---|---|---|---|
| 2009-01-01 → 2009-04-01 | -6.1784% | 1.9239% | 9.8901% | -7.0387% | no | 0.9894% | 10 / 60 |
| 2009-04-01 → 2009-07-01 | -7.79% | 0.8958% | 10.4576% | -2.852% | yes | 1.1159% | 6 / 62 |
| 2009-07-01 → 2009-10-01 | -9.1758% | 0.6322% | 10.4989% | 7.8694% | yes | 1.1996% | 0 / 63 |
| 2009-10-01 → 2010-01-01 | -8.4156% | 1.8259% | 12.1627% | -0.4622% | yes | 1.1838% | 3 / 63 |
| 2010-01-01 | no segment follows this rebalance, not scored | ||||||
The full fifteen-fund shelf, equal risk contribution
Portfolio book, rebalanced quarterly · 5 constructions · 15 names held · selection: reselect · 0.0% in cash · turnover 1.2× · cost drag 0.12%
Projection accuracy, realized outcome fell inside the P5–P95 cone in 100.0% of 4 scored rebalances (a well-calibrated 90% band contains ~90.0%) · 95% VaR breached on 8.06% of 248 days (expected ~5.0%)
| Rebalance | P5 | Median | P95 | Realized | In band | VaR 95 (1d) | Breaches |
|---|---|---|---|---|---|---|---|
| 2009-01-01 → 2009-04-01 | -5.5089% | 0.7894% | 6.8748% | -3.9656% | yes | 0.6558% | 12 / 60 |
| 2009-04-01 → 2009-07-01 | -6.4925% | 0.1362% | 7.2776% | 1.272% | yes | 0.7528% | 6 / 62 |
| 2009-07-01 → 2009-10-01 | -7.1168% | 0.3% | 7.5801% | 5.585% | yes | 0.8255% | 0 / 63 |
| 2009-10-01 → 2010-01-01 | -6.664% | 1.012% | 8.5625% | -0.3398% | yes | 0.7628% | 2 / 63 |
| 2010-01-01 | no segment follows this rebalance, not scored | ||||||
Step 3 · 2010-01-04 → 2010-12-31
Trio (SPY, TLT, GLD), equal risk contribution
Portfolio book, rebalanced quarterly · 5 constructions · 3 names held · selection: reselect · 0.0% in cash · turnover 1.2× · cost drag 0.12%
Projection accuracy, realized outcome fell inside the P5–P95 cone in 100.0% of 4 scored rebalances (a well-calibrated 90% band contains ~90.0%) · 95% VaR breached on 2.02% of 248 days (expected ~5.0%)
| Rebalance | P5 | Median | P95 | Realized | In band | VaR 95 (1d) | Breaches |
|---|---|---|---|---|---|---|---|
| 2010-01-01 → 2010-04-01 | -10.1643% | 0.4719% | 11.223% | 0.7462% | yes | 1.2461% | 2 / 60 |
| 2010-04-01 → 2010-07-01 | -9.8438% | 0.1421% | 11.302% | 4.7319% | yes | 1.2487% | 0 / 62 |
| 2010-07-01 → 2010-10-01 | -9.5857% | 0.9684% | 11.6656% | 7.697% | yes | 1.2198% | 0 / 63 |
| 2010-10-01 → 2011-01-01 | -8.6477% | 2.116% | 13.0359% | 0.2287% | yes | 1.2204% | 3 / 63 |
| 2011-01-01 | no segment follows this rebalance, not scored | ||||||
The full fifteen-fund shelf, equal risk contribution
Portfolio book, rebalanced quarterly · 5 constructions · 15 names held · selection: reselect · 0.0% in cash · turnover 1.2× · cost drag 0.12%
Projection accuracy, realized outcome fell inside the P5–P95 cone in 100.0% of 4 scored rebalances (a well-calibrated 90% band contains ~90.0%) · 95% VaR breached on 2.42% of 248 days (expected ~5.0%)
| Rebalance | P5 | Median | P95 | Realized | In band | VaR 95 (1d) | Breaches |
|---|---|---|---|---|---|---|---|
| 2010-01-01 → 2010-04-01 | -7.9033% | 0.1244% | 8.0229% | 0.1397% | yes | 0.8118% | 2 / 60 |
| 2010-04-01 → 2010-07-01 | -7.8678% | -0.1597% | 8.2437% | 0.833% | yes | 0.8555% | 0 / 62 |
| 2010-07-01 → 2010-10-01 | -7.712% | 0.1752% | 7.9556% | 5.9573% | yes | 0.8407% | 0 / 63 |
| 2010-10-01 → 2011-01-01 | -6.7509% | 1.1747% | 8.9896% | -0.1474% | yes | 0.8323% | 4 / 63 |
| 2011-01-01 | no segment follows this rebalance, not scored | ||||||
Step 4 · 2011-01-03 → 2011-12-30
Trio (SPY, TLT, GLD), equal risk contribution
Portfolio book, rebalanced quarterly · 5 constructions · 3 names held · selection: reselect · 0.0% in cash · turnover 1.3× · cost drag 0.13%
Projection accuracy, realized outcome fell inside the P5–P95 cone in 100.0% of 4 scored rebalances (a well-calibrated 90% band contains ~90.0%) · 95% VaR breached on 3.63% of 248 days (expected ~5.0%)
| Rebalance | P5 | Median | P95 | Realized | In band | VaR 95 (1d) | Breaches |
|---|---|---|---|---|---|---|---|
| 2011-01-01 → 2011-04-01 | -5.841% | 3.1371% | 13.9167% | 1.4805% | yes | 1.1445% | 0 / 61 |
| 2011-04-01 → 2011-07-01 | -4.9464% | 2.9172% | 11.4828% | 1.8192% | yes | 1.031% | 0 / 62 |
| 2011-07-01 → 2011-10-01 | -4.002% | 3.3815% | 10.6103% | 6.0909% | yes | 0.846% | 5 / 63 |
| 2011-10-01 → 2012-01-01 | -3.5853% | 3.2827% | 10.6842% | 3.7518% | yes | 0.8288% | 4 / 62 |
| 2012-01-01 | no segment follows this rebalance, not scored | ||||||
The full fifteen-fund shelf, equal risk contribution
Portfolio book, rebalanced quarterly · 5 constructions · 15 names held · selection: reselect · 0.0% in cash · turnover 1.2× · cost drag 0.12%
Projection accuracy, realized outcome fell inside the P5–P95 cone in 100.0% of 4 scored rebalances (a well-calibrated 90% band contains ~90.0%) · 95% VaR breached on 6.85% of 248 days (expected ~5.0%)
| Rebalance | P5 | Median | P95 | Realized | In band | VaR 95 (1d) | Breaches |
|---|---|---|---|---|---|---|---|
| 2011-01-01 → 2011-04-01 | -4.1412% | 2.4253% | 10.1072% | 1.4665% | yes | 0.7674% | 1 / 61 |
| 2011-04-01 → 2011-07-01 | -3.5826% | 2.2608% | 8.4954% | 1.3751% | yes | 0.7199% | 1 / 62 |
| 2011-07-01 → 2011-10-01 | -3.0783% | 2.4122% | 7.6909% | -0.4292% | yes | 0.629% | 10 / 63 |
| 2011-10-01 → 2012-01-01 | -3.2703% | 1.6173% | 6.7825% | 2.1437% | yes | 0.5963% | 5 / 62 |
| 2012-01-01 | no segment follows this rebalance, not scored | ||||||
Step 5 · 2012-01-03 → 2012-12-31
Trio (SPY, TLT, GLD), equal risk contribution
Portfolio book, rebalanced quarterly · 4 constructions · 3 names held · selection: reselect · 0.0% in cash · turnover 1.2× · cost drag 0.12%
Projection accuracy, realized outcome fell inside the P5–P95 cone in 100.0% of 4 scored rebalances (a well-calibrated 90% band contains ~90.0%) · 95% VaR breached on 2.44% of 246 days (expected ~5.0%)
| Rebalance | P5 | Median | P95 | Realized | In band | VaR 95 (1d) | Breaches |
|---|---|---|---|---|---|---|---|
| 2012-01-01 → 2012-04-01 | -3.2508% | 3.0601% | 10.4193% | 2.1564% | yes | 0.8138% | 2 / 61 |
| 2012-04-01 → 2012-07-01 | -3.2617% | 3.326% | 10.4046% | 2.1133% | yes | 0.8025% | 2 / 62 |
| 2012-07-01 → 2012-10-01 | -3.5203% | 2.9739% | 9.9468% | 3.6647% | yes | 0.7933% | 1 / 62 |
| 2012-10-01 → window end | -2.7226% | 3.2243% | 10.1312% | -2.6177% | yes | 0.7392% | 1 / 61 |
The full fifteen-fund shelf, equal risk contribution
Portfolio book, rebalanced quarterly · 4 constructions · 15 names held · selection: reselect · 0.0% in cash · turnover 1.2× · cost drag 0.12%
Projection accuracy, realized outcome fell inside the P5–P95 cone in 100.0% of 4 scored rebalances (a well-calibrated 90% band contains ~90.0%) · 95% VaR breached on 1.63% of 246 days (expected ~5.0%)
| Rebalance | P5 | Median | P95 | Realized | In band | VaR 95 (1d) | Breaches |
|---|---|---|---|---|---|---|---|
| 2012-01-01 → 2012-04-01 | -2.7706% | 1.4027% | 6.1627% | 1.5889% | yes | 0.5551% | 2 / 61 |
| 2012-04-01 → 2012-07-01 | -2.6699% | 1.6337% | 6.1542% | 0.3199% | yes | 0.5361% | 2 / 62 |
| 2012-07-01 → 2012-10-01 | -2.8103% | 1.4267% | 5.8747% | 2.3009% | yes | 0.542% | 0 / 62 |
| 2012-10-01 → window end | -2.4324% | 1.4174% | 5.7932% | -0.5246% | yes | 0.5142% | 0 / 61 |
Step 6 · 2013-01-02 → 2013-12-31
Trio (SPY, TLT, GLD), equal risk contribution
Portfolio book, rebalanced quarterly · 5 constructions · 3 names held · selection: reselect · 0.0% in cash · turnover 1.2× · cost drag 0.12%
Projection accuracy, realized outcome fell inside the P5–P95 cone in 75.0% of 4 scored rebalances (a well-calibrated 90% band contains ~90.0%) · 95% VaR breached on 7.66% of 248 days (expected ~5.0%)
| Rebalance | P5 | Median | P95 | Realized | In band | VaR 95 (1d) | Breaches |
|---|---|---|---|---|---|---|---|
| 2013-01-01 → 2013-04-01 | -3.7106% | 2.589% | 8.3193% | 1.3346% | yes | 0.7336% | 2 / 59 |
| 2013-04-01 → 2013-07-01 | -3.2603% | 2.9015% | 8.8632% | -6.6047% | no | 0.6846% | 9 / 63 |
| 2013-07-01 → 2013-10-01 | -4.9631% | 1.5631% | 7.9057% | 1.2692% | yes | 0.7463% | 5 / 63 |
| 2013-10-01 → 2014-01-01 | -5.282% | 1.5389% | 8.1877% | 1.1234% | yes | 0.7847% | 3 / 63 |
| 2014-01-01 | no segment follows this rebalance, not scored | ||||||
The full fifteen-fund shelf, equal risk contribution
Portfolio book, rebalanced quarterly · 5 constructions · 15 names held · selection: reselect · 0.0% in cash · turnover 1.3× · cost drag 0.13%
Projection accuracy, realized outcome fell inside the P5–P95 cone in 75.0% of 4 scored rebalances (a well-calibrated 90% band contains ~90.0%) · 95% VaR breached on 5.24% of 248 days (expected ~5.0%)
| Rebalance | P5 | Median | P95 | Realized | In band | VaR 95 (1d) | Breaches |
|---|---|---|---|---|---|---|---|
| 2013-01-01 → 2013-04-01 | -3.2204% | 1.1174% | 4.9925% | 0.2668% | yes | 0.5603% | 1 / 59 |
| 2013-04-01 → 2013-07-01 | -2.8096% | 1.3164% | 5.2324% | -4.5845% | no | 0.4567% | 7 / 63 |
| 2013-07-01 → 2013-10-01 | -4.375% | 0.2853% | 4.7338% | 1.4503% | yes | 0.6238% | 4 / 63 |
| 2013-10-01 → 2014-01-01 | -5.1055% | 0.3646% | 5.6285% | -0.0026% | yes | 0.6723% | 1 / 63 |
| 2014-01-01 | no segment follows this rebalance, not scored | ||||||
Step 7 · 2014-01-02 → 2014-12-31
Trio (SPY, TLT, GLD), equal risk contribution
Portfolio book, rebalanced quarterly · 5 constructions · 3 names held · selection: reselect · 0.0% in cash · turnover 1.1× · cost drag 0.11%
Projection accuracy, realized outcome fell inside the P5–P95 cone in 100.0% of 4 scored rebalances (a well-calibrated 90% band contains ~90.0%) · 95% VaR breached on 3.23% of 248 days (expected ~5.0%)
| Rebalance | P5 | Median | P95 | Realized | In band | VaR 95 (1d) | Breaches |
|---|---|---|---|---|---|---|---|
| 2014-01-01 → 2014-04-01 | -5.5972% | 0.7074% | 6.7997% | 4.4798% | yes | 0.7311% | 1 / 60 |
| 2014-04-01 → 2014-07-01 | -4.9579% | 0.7736% | 6.887% | 4.5012% | yes | 0.6858% | 0 / 62 |
| 2014-07-01 → 2014-10-01 | -4.7892% | 1.297% | 7.1869% | -0.6806% | yes | 0.6487% | 3 / 63 |
| 2014-10-01 → 2015-01-01 | -5.2309% | 0.8618% | 6.7599% | 4.2409% | yes | 0.6704% | 4 / 63 |
| 2015-01-01 | no segment follows this rebalance, not scored | ||||||
The full fifteen-fund shelf, equal risk contribution
Portfolio book, rebalanced quarterly · 5 constructions · 15 names held · selection: reselect · 0.0% in cash · turnover 1.2× · cost drag 0.12%
Projection accuracy, realized outcome fell inside the P5–P95 cone in 100.0% of 4 scored rebalances (a well-calibrated 90% band contains ~90.0%) · 95% VaR breached on 3.23% of 248 days (expected ~5.0%)
| Rebalance | P5 | Median | P95 | Realized | In band | VaR 95 (1d) | Breaches |
|---|---|---|---|---|---|---|---|
| 2014-01-01 → 2014-04-01 | -4.7216% | 0.2081% | 4.9077% | 2.2439% | yes | 0.5581% | 1 / 60 |
| 2014-04-01 → 2014-07-01 | -4.1663% | 0.2077% | 4.8086% | 2.766% | yes | 0.5074% | 0 / 62 |
| 2014-07-01 → 2014-10-01 | -4.0331% | 0.6687% | 5.1578% | -3.8702% | yes | 0.4911% | 4 / 63 |
| 2014-10-01 → 2015-01-01 | -4.1466% | 0.2259% | 4.3878% | -0.7554% | yes | 0.5005% | 3 / 63 |
| 2015-01-01 | no segment follows this rebalance, not scored | ||||||
Step 8 · 2015-01-02 → 2015-12-31
Trio (SPY, TLT, GLD), equal risk contribution
Portfolio book, rebalanced quarterly · 5 constructions · 3 names held · selection: reselect · 0.0% in cash · turnover 1.2× · cost drag 0.12%
Projection accuracy, realized outcome fell inside the P5–P95 cone in 100.0% of 4 scored rebalances (a well-calibrated 90% band contains ~90.0%) · 95% VaR breached on 8.47% of 248 days (expected ~5.0%)
| Rebalance | P5 | Median | P95 | Realized | In band | VaR 95 (1d) | Breaches |
|---|---|---|---|---|---|---|---|
| 2015-01-01 → 2015-04-01 | -4.9052% | 1.0791% | 6.8419% | 1.3223% | yes | 0.6853% | 4 / 60 |
| 2015-04-01 → 2015-07-01 | -4.9086% | 1.2044% | 7.7495% | -4.387% | yes | 0.6971% | 5 / 62 |
| 2015-07-01 → 2015-10-01 | -5.7837% | 0.6502% | 6.9009% | -2.2066% | yes | 0.735% | 7 / 63 |
| 2015-10-01 → 2016-01-01 | -5.3737% | 0.854% | 6.8911% | 0.2086% | yes | 0.7552% | 5 / 63 |
| 2016-01-01 | no segment follows this rebalance, not scored | ||||||
The full fifteen-fund shelf, equal risk contribution
Portfolio book, rebalanced quarterly · 5 constructions · 15 names held · selection: reselect · 0.0% in cash · turnover 1.1× · cost drag 0.11%
Projection accuracy, realized outcome fell inside the P5–P95 cone in 100.0% of 4 scored rebalances (a well-calibrated 90% band contains ~90.0%) · 95% VaR breached on 5.24% of 248 days (expected ~5.0%)
| Rebalance | P5 | Median | P95 | Realized | In band | VaR 95 (1d) | Breaches |
|---|---|---|---|---|---|---|---|
| 2015-01-01 → 2015-04-01 | -4.251% | -0.0509% | 3.9245% | 0.6539% | yes | 0.4929% | 4 / 60 |
| 2015-04-01 → 2015-07-01 | -4.45% | -0.0494% | 4.5812% | -2.4614% | yes | 0.5307% | 2 / 62 |
| 2015-07-01 → 2015-10-01 | -5.0767% | -0.35% | 4.1663% | -3.0284% | yes | 0.5352% | 4 / 63 |
| 2015-10-01 → 2016-01-01 | -4.4926% | -0.2293% | 3.8251% | -1.0757% | yes | 0.5141% | 3 / 63 |
| 2016-01-01 | no segment follows this rebalance, not scored | ||||||
Step 9 · 2016-01-04 → 2016-12-30
Trio (SPY, TLT, GLD), equal risk contribution
Portfolio book, rebalanced quarterly · 4 constructions · 3 names held · selection: reselect · 0.0% in cash · turnover 1.2× · cost drag 0.12%
Projection accuracy, realized outcome fell inside the P5–P95 cone in 50.0% of 4 scored rebalances (a well-calibrated 90% band contains ~90.0%) · 95% VaR breached on 4.44% of 248 days (expected ~5.0%)
| Rebalance | P5 | Median | P95 | Realized | In band | VaR 95 (1d) | Breaches |
|---|---|---|---|---|---|---|---|
| 2016-01-01 → 2016-04-01 | -5.6145% | 0.4402% | 6.2772% | 7.7613% | no | 0.7851% | 0 / 60 |
| 2016-04-01 → 2016-07-01 | -4.5803% | 1.6218% | 7.6297% | 5.1855% | yes | 0.7136% | 1 / 63 |
| 2016-07-01 → 2016-10-01 | -4.3954% | 1.8136% | 7.8279% | -0.2085% | yes | 0.6921% | 4 / 63 |
| 2016-10-01 → window end | -4.5901% | 1.3745% | 7.7501% | -6.4047% | no | 0.7195% | 6 / 62 |
The full fifteen-fund shelf, equal risk contribution
Portfolio book, rebalanced quarterly · 4 constructions · 15 names held · selection: reselect · 0.0% in cash · turnover 1.2× · cost drag 0.12%
Projection accuracy, realized outcome fell inside the P5–P95 cone in 50.0% of 4 scored rebalances (a well-calibrated 90% band contains ~90.0%) · 95% VaR breached on 4.03% of 248 days (expected ~5.0%)
| Rebalance | P5 | Median | P95 | Realized | In band | VaR 95 (1d) | Breaches |
|---|---|---|---|---|---|---|---|
| 2016-01-01 → 2016-04-01 | -4.5559% | -0.6183% | 3.0998% | 4.2143% | no | 0.5011% | 0 / 60 |
| 2016-04-01 → 2016-07-01 | -4.0018% | -0.029% | 3.7378% | 3.4118% | yes | 0.4567% | 2 / 63 |
| 2016-07-01 → 2016-10-01 | -3.7313% | 0.2327% | 3.9904% | 0.3986% | yes | 0.446% | 3 / 63 |
| 2016-10-01 → window end | -3.8354% | 0.0689% | 4.1558% | -4.3838% | no | 0.4662% | 5 / 62 |
Step 10 · 2017-01-03 → 2017-12-29
Trio (SPY, TLT, GLD), equal risk contribution
Portfolio book, rebalanced quarterly · 5 constructions · 3 names held · selection: reselect · 0.0% in cash · turnover 1.2× · cost drag 0.12%
Projection accuracy, realized outcome fell inside the P5–P95 cone in 100.0% of 4 scored rebalances (a well-calibrated 90% band contains ~90.0%) · 95% VaR breached on 1.21% of 247 days (expected ~5.0%)
| Rebalance | P5 | Median | P95 | Realized | In band | VaR 95 (1d) | Breaches |
|---|---|---|---|---|---|---|---|
| 2017-01-01 → 2017-04-01 | -5.1883% | 0.4923% | 7.082% | 4.2149% | yes | 0.7474% | 0 / 61 |
| 2017-04-01 → 2017-07-01 | -5.5548% | 0.406% | 6.7811% | 1.869% | yes | 0.7092% | 1 / 62 |
| 2017-07-01 → 2017-10-01 | -4.7608% | 0.9514% | 7.0426% | 3.1153% | yes | 0.6342% | 1 / 62 |
| 2017-10-01 → 2018-01-01 | -4.119% | 1.5377% | 7.564% | 4.0363% | yes | 0.5958% | 1 / 62 |
| 2018-01-01 | no segment follows this rebalance, not scored | ||||||
The full fifteen-fund shelf, equal risk contribution
Portfolio book, rebalanced quarterly · 5 constructions · 15 names held · selection: reselect · 0.0% in cash · turnover 1.3× · cost drag 0.13%
Projection accuracy, realized outcome fell inside the P5–P95 cone in 100.0% of 4 scored rebalances (a well-calibrated 90% band contains ~90.0%) · 95% VaR breached on 1.21% of 247 days (expected ~5.0%)
| Rebalance | P5 | Median | P95 | Realized | In band | VaR 95 (1d) | Breaches |
|---|---|---|---|---|---|---|---|
| 2017-01-01 → 2017-04-01 | -4.1758% | -0.3078% | 4.0926% | 2.1284% | yes | 0.4595% | 3 / 61 |
| 2017-04-01 → 2017-07-01 | -4.4534% | -0.1144% | 4.4486% | 1.2549% | yes | 0.4855% | 0 / 62 |
| 2017-07-01 → 2017-10-01 | -4.1585% | 0.1431% | 4.6644% | 2.4074% | yes | 0.485% | 0 / 62 |
| 2017-10-01 → 2018-01-01 | -3.7125% | 0.7542% | 5.4558% | 2.3371% | yes | 0.4978% | 0 / 62 |
| 2018-01-01 | no segment follows this rebalance, not scored | ||||||
Step 11 · 2018-01-02 → 2018-12-31
Trio (SPY, TLT, GLD), equal risk contribution
Portfolio book, rebalanced quarterly · 5 constructions · 3 names held · selection: reselect · 0.0% in cash · turnover 1.5× · cost drag 0.15%
Projection accuracy, realized outcome fell inside the P5–P95 cone in 100.0% of 4 scored rebalances (a well-calibrated 90% band contains ~90.0%) · 95% VaR breached on 8.1% of 247 days (expected ~5.0%)
| Rebalance | P5 | Median | P95 | Realized | In band | VaR 95 (1d) | Breaches |
|---|---|---|---|---|---|---|---|
| 2018-01-01 → 2018-04-01 | -3.4054% | 1.916% | 7.0045% | -1.5258% | yes | 0.5625% | 14 / 60 |
| 2018-04-01 → 2018-07-01 | -4.0766% | 1.8063% | 7.4863% | -0.2464% | yes | 0.644% | 3 / 63 |
| 2018-07-01 → 2018-10-01 | -4.7858% | 0.6376% | 6.4042% | -0.3189% | yes | 0.6707% | 0 / 62 |
| 2018-10-01 → 2019-01-01 | -5.4987% | -0.2837% | 5.2519% | -0.2465% | yes | 0.6752% | 3 / 62 |
| 2019-01-01 | no segment follows this rebalance, not scored | ||||||
The full fifteen-fund shelf, equal risk contribution
Portfolio book, rebalanced quarterly · 5 constructions · 15 names held · selection: reselect · 0.0% in cash · turnover 1.3× · cost drag 0.13%
Projection accuracy, realized outcome fell inside the P5–P95 cone in 100.0% of 4 scored rebalances (a well-calibrated 90% band contains ~90.0%) · 95% VaR breached on 8.91% of 247 days (expected ~5.0%)
| Rebalance | P5 | Median | P95 | Realized | In band | VaR 95 (1d) | Breaches |
|---|---|---|---|---|---|---|---|
| 2018-01-01 → 2018-04-01 | -3.1791% | 1.0766% | 5.1049% | -1.325% | yes | 0.4478% | 12 / 60 |
| 2018-04-01 → 2018-07-01 | -2.7395% | 1.1874% | 4.9073% | -0.2156% | yes | 0.4043% | 2 / 63 |
| 2018-07-01 → 2018-10-01 | -3.2208% | 0.3013% | 3.9733% | -0.1799% | yes | 0.4188% | 3 / 62 |
| 2018-10-01 → 2019-01-01 | -3.508% | -0.1752% | 3.2931% | -2.6363% | yes | 0.4226% | 5 / 62 |
| 2019-01-01 | no segment follows this rebalance, not scored | ||||||
Step 12 · 2019-01-02 → 2019-12-31
Trio (SPY, TLT, GLD), equal risk contribution
Portfolio book, rebalanced quarterly · 5 constructions · 3 names held · selection: reselect · 0.0% in cash · turnover 1.2× · cost drag 0.12%
Projection accuracy, realized outcome fell inside the P5–P95 cone in 75.0% of 4 scored rebalances (a well-calibrated 90% band contains ~90.0%) · 95% VaR breached on 6.85% of 248 days (expected ~5.0%)
| Rebalance | P5 | Median | P95 | Realized | In band | VaR 95 (1d) | Breaches |
|---|---|---|---|---|---|---|---|
| 2019-01-01 → 2019-04-01 | -5.4172% | 0.0766% | 5.344% | 4.8083% | yes | 0.6891% | 4 / 60 |
| 2019-04-01 → 2019-07-01 | -3.827% | 1.0854% | 6.2794% | 6.5536% | no | 0.6444% | 1 / 62 |
| 2019-07-01 → 2019-10-01 | -3.6283% | 1.5896% | 6.5949% | 5.5623% | yes | 0.6275% | 8 / 63 |
| 2019-10-01 → 2020-01-01 | -3.6219% | 1.9696% | 7.352% | 1.6676% | yes | 0.6537% | 4 / 63 |
| 2020-01-01 | no segment follows this rebalance, not scored | ||||||
The full fifteen-fund shelf, equal risk contribution
Portfolio book, rebalanced quarterly · 5 constructions · 15 names held · selection: reselect · 0.0% in cash · turnover 1.2× · cost drag 0.12%
Projection accuracy, realized outcome fell inside the P5–P95 cone in 75.0% of 4 scored rebalances (a well-calibrated 90% band contains ~90.0%) · 95% VaR breached on 3.63% of 248 days (expected ~5.0%)
| Rebalance | P5 | Median | P95 | Realized | In band | VaR 95 (1d) | Breaches |
|---|---|---|---|---|---|---|---|
| 2019-01-01 → 2019-04-01 | -3.7114% | -0.3277% | 2.8494% | 4.1921% | no | 0.4214% | 1 / 60 |
| 2019-04-01 → 2019-07-01 | -2.8374% | 0.3094% | 3.5773% | 2.96% | yes | 0.4045% | 0 / 62 |
| 2019-07-01 → 2019-10-01 | -2.7663% | 0.5835% | 3.7395% | 1.9287% | yes | 0.3973% | 6 / 63 |
| 2019-10-01 → 2020-01-01 | -2.9827% | 0.5091% | 3.8034% | 1.5203% | yes | 0.416% | 2 / 63 |
| 2020-01-01 | no segment follows this rebalance, not scored | ||||||
Step 13 · 2020-01-02 → 2020-12-31
Trio (SPY, TLT, GLD), equal risk contribution
Portfolio book, rebalanced quarterly · 4 constructions · 3 names held · selection: reselect · 0.0% in cash · turnover 1.3× · cost drag 0.13%
Projection accuracy, realized outcome fell inside the P5–P95 cone in 75.0% of 4 scored rebalances (a well-calibrated 90% band contains ~90.0%) · 95% VaR breached on 8.84% of 249 days (expected ~5.0%)
| Rebalance | P5 | Median | P95 | Realized | In band | VaR 95 (1d) | Breaches |
|---|---|---|---|---|---|---|---|
| 2020-01-01 → 2020-04-01 | -3.3738% | 1.8282% | 7.8265% | -1.0702% | yes | 0.6731% | 8 / 61 |
| 2020-04-01 → 2020-07-01 | -5.6365% | 1.6966% | 9.6473% | 10.5838% | no | 0.7709% | 3 / 62 |
| 2020-07-01 → 2020-10-01 | -4.6541% | 3.5812% | 11.7114% | 4.3922% | yes | 0.7368% | 8 / 63 |
| 2020-10-01 → window end | -4.4229% | 4.1712% | 12.682% | 1.5752% | yes | 0.8216% | 3 / 63 |
The full fifteen-fund shelf, equal risk contribution
Portfolio book, rebalanced quarterly · 4 constructions · 15 names held · selection: reselect · 0.0% in cash · turnover 1.5× · cost drag 0.15%
Projection accuracy, realized outcome fell inside the P5–P95 cone in 50.0% of 4 scored rebalances (a well-calibrated 90% band contains ~90.0%) · 95% VaR breached on 9.24% of 249 days (expected ~5.0%)
| Rebalance | P5 | Median | P95 | Realized | In band | VaR 95 (1d) | Breaches |
|---|---|---|---|---|---|---|---|
| 2020-01-01 → 2020-04-01 | -2.903% | 0.4199% | 4.1767% | -5.9714% | no | 0.4478% | 10 / 61 |
| 2020-04-01 → 2020-07-01 | -5.1869% | -0.388% | 4.6838% | 7.5349% | no | 0.4844% | 6 / 62 |
| 2020-07-01 → 2020-10-01 | -4.2636% | 0.9961% | 6.0451% | 3.5188% | yes | 0.4898% | 6 / 63 |
| 2020-10-01 → window end | -3.7374% | 1.5936% | 6.7132% | 3.4882% | yes | 0.503% | 1 / 63 |
Step 14 · 2021-01-04 → 2021-12-31
Trio (SPY, TLT, GLD), equal risk contribution
Portfolio book, rebalanced quarterly · 5 constructions · 3 names held · selection: reselect · 0.0% in cash · turnover 1.2× · cost drag 0.12%
Projection accuracy, realized outcome fell inside the P5–P95 cone in 75.0% of 4 scored rebalances (a well-calibrated 90% band contains ~90.0%) · 95% VaR breached on 4.84% of 248 days (expected ~5.0%)
| Rebalance | P5 | Median | P95 | Realized | In band | VaR 95 (1d) | Breaches |
|---|---|---|---|---|---|---|---|
| 2021-01-01 → 2021-04-01 | -4.3055% | 4.3091% | 12.8062% | -7.8867% | no | 0.8846% | 7 / 60 |
| 2021-04-01 → 2021-07-01 | -5.4248% | 2.9975% | 12.2254% | 4.8978% | yes | 0.9839% | 1 / 62 |
| 2021-07-01 → 2021-10-01 | -5.5431% | 3.6693% | 12.8534% | -0.2431% | yes | 0.9599% | 3 / 63 |
| 2021-10-01 → 2022-01-01 | -6.4067% | 3.0136% | 12.4304% | 5.2192% | yes | 0.9751% | 1 / 63 |
| 2022-01-01 | no segment follows this rebalance, not scored | ||||||
The full fifteen-fund shelf, equal risk contribution
Portfolio book, rebalanced quarterly · 5 constructions · 15 names held · selection: reselect · 0.0% in cash · turnover 1.5× · cost drag 0.15%
Projection accuracy, realized outcome fell inside the P5–P95 cone in 75.0% of 4 scored rebalances (a well-calibrated 90% band contains ~90.0%) · 95% VaR breached on 4.84% of 248 days (expected ~5.0%)
| Rebalance | P5 | Median | P95 | Realized | In band | VaR 95 (1d) | Breaches |
|---|---|---|---|---|---|---|---|
| 2021-01-01 → 2021-04-01 | -3.1003% | 2.1378% | 7.1419% | -3.2971% | no | 0.4775% | 6 / 60 |
| 2021-04-01 → 2021-07-01 | -3.6788% | 1.5223% | 7.037% | 2.7015% | yes | 0.5199% | 2 / 62 |
| 2021-07-01 → 2021-10-01 | -4.2856% | 1.9086% | 7.9074% | -0.5572% | yes | 0.5488% | 2 / 63 |
| 2021-10-01 → 2022-01-01 | -4.7758% | 1.6848% | 7.9591% | 0.7459% | yes | 0.587% | 2 / 63 |
| 2022-01-01 | no segment follows this rebalance, not scored | ||||||
Step 15 · 2022-01-03 → 2022-12-30
Trio (SPY, TLT, GLD), equal risk contribution
Portfolio book, rebalanced quarterly · 5 constructions · 3 names held · selection: reselect · 0.0% in cash · turnover 1.1× · cost drag 0.11%
Projection accuracy, realized outcome fell inside the P5–P95 cone in 50.0% of 4 scored rebalances (a well-calibrated 90% band contains ~90.0%) · 95% VaR breached on 10.93% of 247 days (expected ~5.0%)
| Rebalance | P5 | Median | P95 | Realized | In band | VaR 95 (1d) | Breaches |
|---|---|---|---|---|---|---|---|
| 2022-01-01 → 2022-04-01 | -5.6558% | 2.8215% | 12.9464% | -2.6663% | yes | 0.9602% | 7 / 61 |
| 2022-04-01 → 2022-07-01 | -6.8573% | 1.8753% | 12.3441% | -12.0062% | no | 1.0918% | 8 / 61 |
| 2022-07-01 → 2022-10-01 | -8.0634% | 0.3067% | 8.6038% | -8.4312% | no | 1.0874% | 6 / 63 |
| 2022-10-01 → 2023-01-01 | -10.3717% | -2.2302% | 6.7047% | 2.9746% | yes | 1.159% | 6 / 62 |
| 2023-01-01 | no segment follows this rebalance, not scored | ||||||
The full fifteen-fund shelf, equal risk contribution
Portfolio book, rebalanced quarterly · 5 constructions · 15 names held · selection: reselect · 0.0% in cash · turnover 1.2× · cost drag 0.12%
Projection accuracy, realized outcome fell inside the P5–P95 cone in 50.0% of 4 scored rebalances (a well-calibrated 90% band contains ~90.0%) · 95% VaR breached on 13.77% of 247 days (expected ~5.0%)
| Rebalance | P5 | Median | P95 | Realized | In band | VaR 95 (1d) | Breaches |
|---|---|---|---|---|---|---|---|
| 2022-01-01 → 2022-04-01 | -4.6407% | 1.2461% | 8.0873% | -3.4588% | yes | 0.6418% | 7 / 61 |
| 2022-04-01 → 2022-07-01 | -5.5269% | 0.8226% | 8.2412% | -8.5834% | no | 0.7185% | 10 / 61 |
| 2022-07-01 → 2022-10-01 | -5.3573% | 0.5388% | 6.2364% | -7.8148% | no | 0.7536% | 12 / 63 |
| 2022-10-01 → 2023-01-01 | -7.6179% | -1.6033% | 4.8412% | 3.7073% | yes | 0.8274% | 5 / 62 |
| 2023-01-01 | no segment follows this rebalance, not scored | ||||||
Step 16 · 2023-01-03 → 2023-12-29
Trio (SPY, TLT, GLD), equal risk contribution
Portfolio book, rebalanced quarterly · 5 constructions · 3 names held · selection: reselect · 0.0% in cash · turnover 1.1× · cost drag 0.11%
Projection accuracy, realized outcome fell inside the P5–P95 cone in 75.0% of 4 scored rebalances (a well-calibrated 90% band contains ~90.0%) · 95% VaR breached on 2.44% of 246 days (expected ~5.0%)
| Rebalance | P5 | Median | P95 | Realized | In band | VaR 95 (1d) | Breaches |
|---|---|---|---|---|---|---|---|
| 2023-01-01 → 2023-04-01 | -9.6006% | -1.4193% | 8.3582% | 6.7169% | yes | 1.1739% | 2 / 61 |
| 2023-04-01 → 2023-07-01 | -9.156% | -0.788% | 9.2281% | -0.1418% | yes | 1.171% | 1 / 61 |
| 2023-07-01 → 2023-10-01 | -9.3653% | -0.5327% | 9.2196% | -6.7221% | yes | 1.1873% | 2 / 62 |
| 2023-10-01 → 2024-01-01 | -10.6211% | -1.7816% | 7.9912% | 12.6962% | no | 1.1704% | 1 / 62 |
| 2024-01-01 | no segment follows this rebalance, not scored | ||||||
The full fifteen-fund shelf, equal risk contribution
Portfolio book, rebalanced quarterly · 5 constructions · 15 names held · selection: reselect · 0.0% in cash · turnover 1.1× · cost drag 0.11%
Projection accuracy, realized outcome fell inside the P5–P95 cone in 75.0% of 4 scored rebalances (a well-calibrated 90% band contains ~90.0%) · 95% VaR breached on 3.66% of 246 days (expected ~5.0%)
| Rebalance | P5 | Median | P95 | Realized | In band | VaR 95 (1d) | Breaches |
|---|---|---|---|---|---|---|---|
| 2023-01-01 → 2023-04-01 | -7.1658% | -0.8603% | 6.5122% | 3.5407% | yes | 0.8501% | 4 / 61 |
| 2023-04-01 → 2023-07-01 | -7.6516% | -1.1417% | 6.489% | -0.9601% | yes | 0.8919% | 1 / 61 |
| 2023-07-01 → 2023-10-01 | -8.2325% | -1.2698% | 6.2664% | -3.8466% | yes | 0.907% | 3 / 62 |
| 2023-10-01 → 2024-01-01 | -8.9591% | -1.8906% | 5.7728% | 7.3533% | no | 0.9172% | 1 / 62 |
| 2024-01-01 | no segment follows this rebalance, not scored | ||||||
Step 17 · 2024-01-02 → 2024-12-31
Trio (SPY, TLT, GLD), equal risk contribution
Portfolio book, rebalanced quarterly · 4 constructions · 3 names held · selection: reselect · 0.0% in cash · turnover 1.2× · cost drag 0.12%
Projection accuracy, realized outcome fell inside the P5–P95 cone in 100.0% of 4 scored rebalances (a well-calibrated 90% band contains ~90.0%) · 95% VaR breached on 3.63% of 248 days (expected ~5.0%)
| Rebalance | P5 | Median | P95 | Realized | In band | VaR 95 (1d) | Breaches |
|---|---|---|---|---|---|---|---|
| 2024-01-01 → 2024-04-01 | -9.9938% | -0.2846% | 9.4415% | 6.1316% | yes | 1.1572% | 1 / 60 |
| 2024-04-01 → 2024-07-01 | -8.9066% | 0.4087% | 10.7393% | 2.8661% | yes | 1.15% | 4 / 62 |
| 2024-07-01 → 2024-10-01 | -8.3611% | 1.6072% | 11.6419% | 8.8989% | yes | 1.1068% | 2 / 63 |
| 2024-10-01 → window end | -7.1466% | 2.5401% | 12.2539% | -2.708% | yes | 1.0971% | 2 / 63 |
The full fifteen-fund shelf, equal risk contribution
Portfolio book, rebalanced quarterly · 4 constructions · 15 names held · selection: reselect · 0.0% in cash · turnover 1.2× · cost drag 0.12%
Projection accuracy, realized outcome fell inside the P5–P95 cone in 100.0% of 4 scored rebalances (a well-calibrated 90% band contains ~90.0%) · 95% VaR breached on 2.42% of 248 days (expected ~5.0%)
| Rebalance | P5 | Median | P95 | Realized | In band | VaR 95 (1d) | Breaches |
|---|---|---|---|---|---|---|---|
| 2024-01-01 → 2024-04-01 | -8.9528% | -1.0562% | 6.7103% | 2.5516% | yes | 0.9667% | 1 / 60 |
| 2024-04-01 → 2024-07-01 | -8.1619% | -0.6541% | 7.5166% | 1.0148% | yes | 0.966% | 3 / 62 |
| 2024-07-01 → 2024-10-01 | -7.7094% | 0.1885% | 7.9802% | 5.6504% | yes | 0.9257% | 0 / 63 |
| 2024-10-01 → window end | -6.3769% | 0.9712% | 8.1753% | -5.0523% | yes | 0.8492% | 2 / 63 |
Step 18 · 2025-01-02 → 2025-12-31
Trio (SPY, TLT, GLD), equal risk contribution
Portfolio book, rebalanced quarterly · 5 constructions · 3 names held · selection: reselect · 0.0% in cash · turnover 1.3× · cost drag 0.13%
Projection accuracy, realized outcome fell inside the P5–P95 cone in 100.0% of 4 scored rebalances (a well-calibrated 90% band contains ~90.0%) · 95% VaR breached on 3.66% of 246 days (expected ~5.0%)
| Rebalance | P5 | Median | P95 | Realized | In band | VaR 95 (1d) | Breaches |
|---|---|---|---|---|---|---|---|
| 2025-01-01 → 2025-04-01 | -5.478% | 3.4211% | 11.7181% | 4.5965% | yes | 0.9902% | 1 / 59 |
| 2025-04-01 → 2025-07-01 | -5.3579% | 2.0356% | 10.7665% | 4.3501% | yes | 1.0062% | 5 / 61 |
| 2025-07-01 → 2025-10-01 | -6.4169% | 2.5959% | 11.5714% | 7.6449% | yes | 1.0167% | 0 / 63 |
| 2025-10-01 → 2026-01-01 | -5.0154% | 3.9431% | 12.8489% | 3.3115% | yes | 0.9935% | 3 / 63 |
| 2026-01-01 | no segment follows this rebalance, not scored | ||||||
The full fifteen-fund shelf, equal risk contribution
Portfolio book, rebalanced quarterly · 5 constructions · 15 names held · selection: reselect · 0.0% in cash · turnover 1.3× · cost drag 0.13%
Projection accuracy, realized outcome fell inside the P5–P95 cone in 100.0% of 4 scored rebalances (a well-calibrated 90% band contains ~90.0%) · 95% VaR breached on 2.44% of 246 days (expected ~5.0%)
| Rebalance | P5 | Median | P95 | Realized | In band | VaR 95 (1d) | Breaches |
|---|---|---|---|---|---|---|---|
| 2025-01-01 → 2025-04-01 | -5.157% | 1.3771% | 7.3387% | 3.6886% | yes | 0.7252% | 0 / 59 |
| 2025-04-01 → 2025-07-01 | -4.8758% | 0.3886% | 6.4679% | 3.1682% | yes | 0.7039% | 5 / 61 |
| 2025-07-01 → 2025-10-01 | -5.0019% | 1.0208% | 6.8464% | 3.8055% | yes | 0.6916% | 0 / 63 |
| 2025-10-01 → 2026-01-01 | -4.2134% | 1.7211% | 7.4541% | 1.5955% | yes | 0.6355% | 1 / 63 |
| 2026-01-01 | no segment follows this rebalance, not scored | ||||||