


Greedy When Others Are Fearful: Buffett's Rule Tested on CNN's Fear & Greed Index Since 2009
"Be greedy when others are fearful" is Warren Buffett's best-known advice, and CNN's Fear & Greed Index is how many people check what the others feel. We rebuilt CNN's index from the seven market measures it combines, which takes it back to 2007, and followed the advice to the letter: buy the S&P 500 at Extreme Fear, sell it at Extreme Greed.
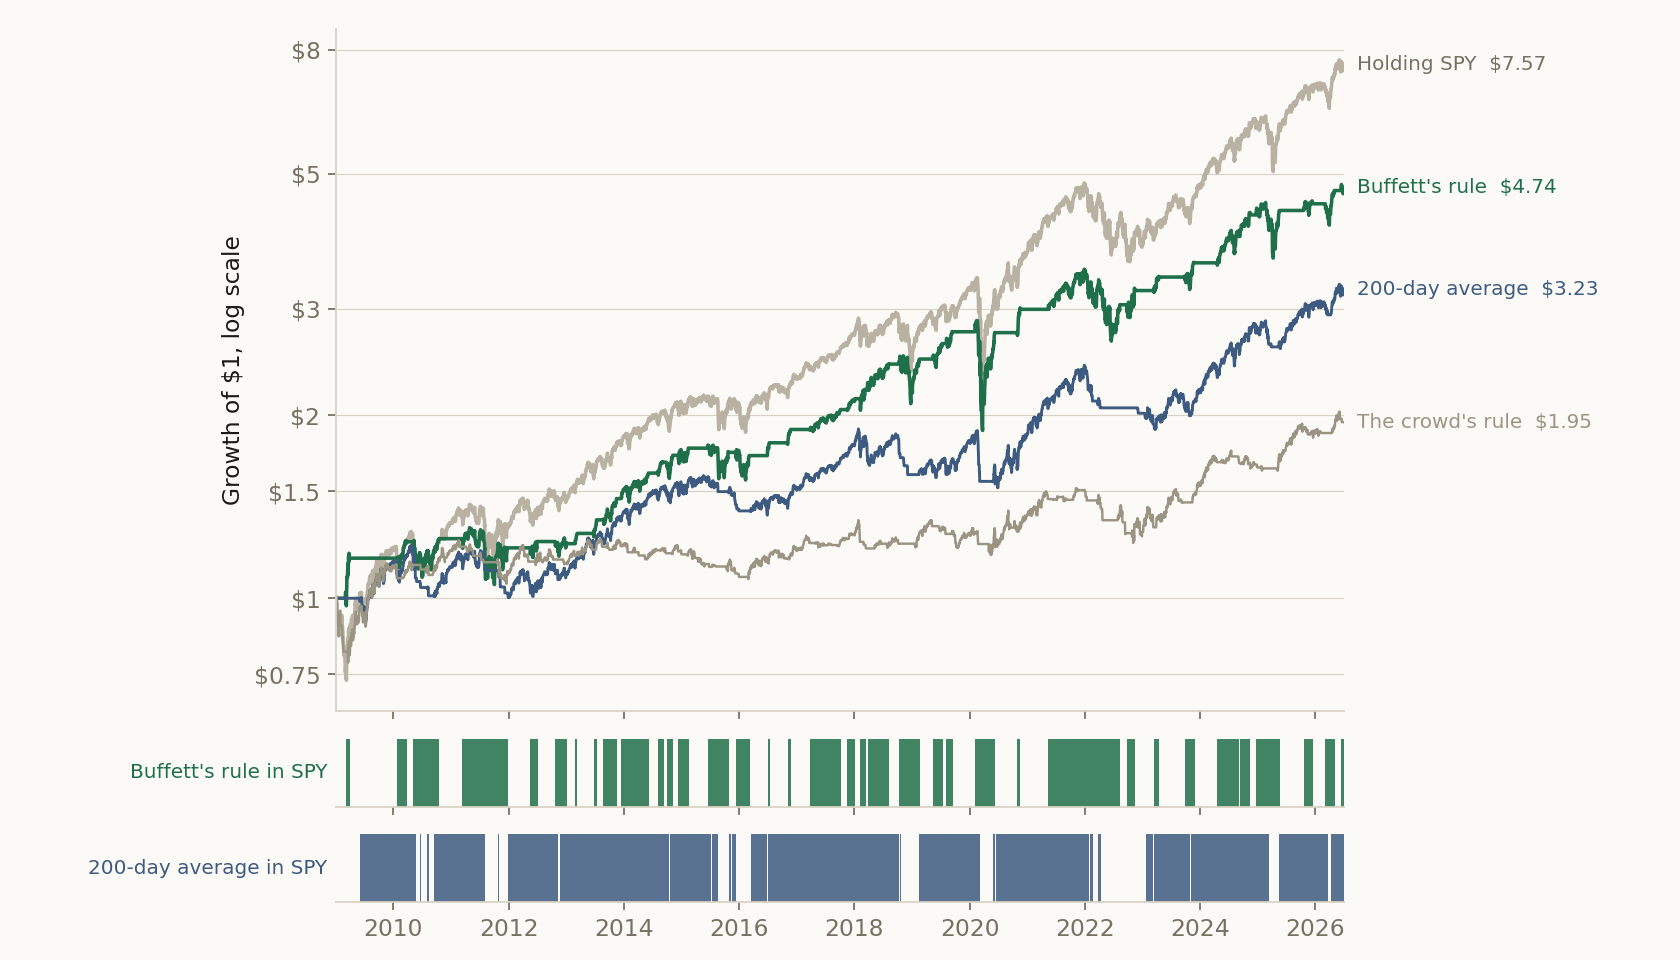
From 2009 to 2026 the rule turned $1 into $4.74. Simply holding the S&P 500 turned it into $7.57, and none of the 26 versions we tested beat holding.
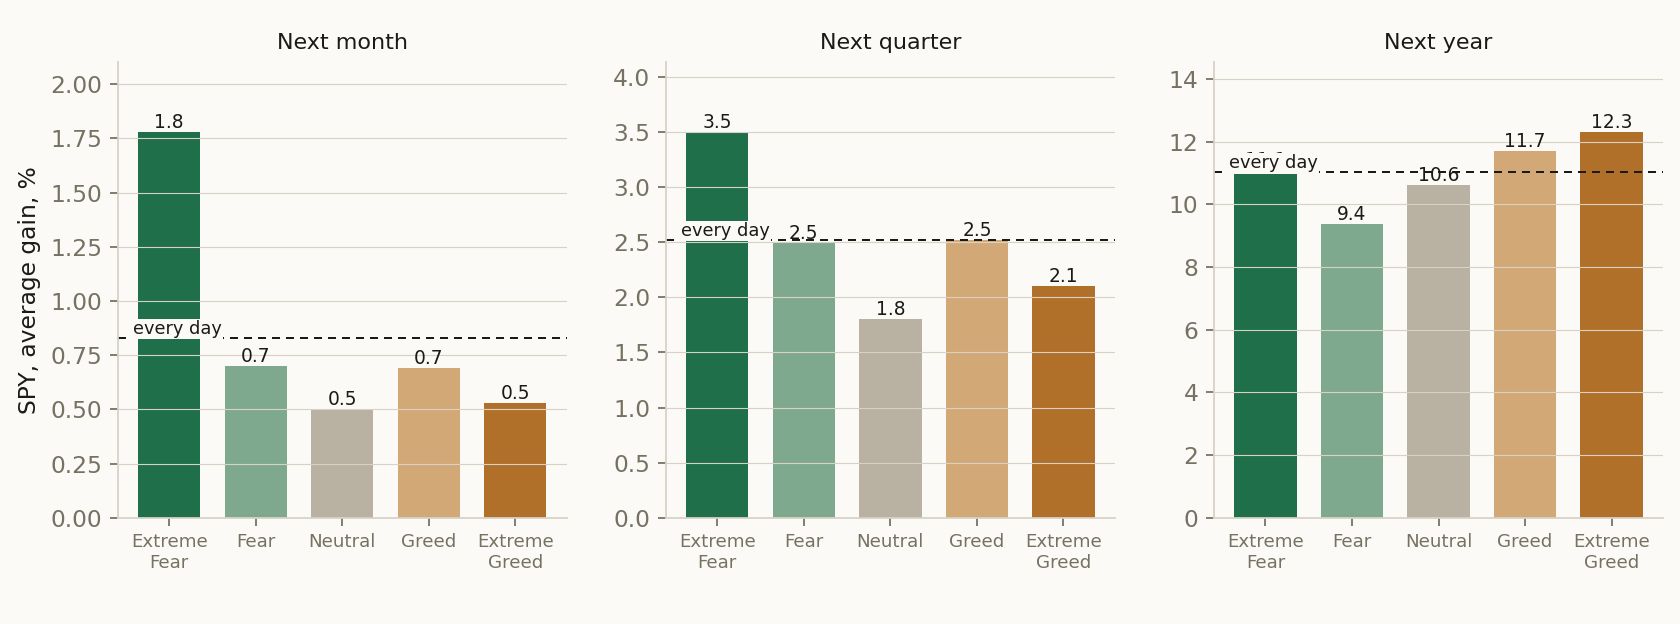
Half of the advice works: Extreme Fear marked good times to buy. The other half costs: the year after Extreme Greed was the best year of all, and the rule spent it in cash.
Why this one
In his 1986 letter to shareholders Warren Buffett wrote that he tries to be "fearful when others are greedy" and greedy "only when others are fearful". It is the best-known advice in investing, and it comes back on every bad day in the market.
CNN's Fear & Greed Index is how many people check what the others feel: a dial from 0 to 100, from Extreme Fear to Extreme Greed, built from seven measures of the market. Put the two together and you get a rule anyone can follow. Buy when the dial reads Extreme Fear, sell when it reads Extreme Greed.
We followed that rule to the letter on the S&P 500 from 2009 to 2026, on the dial rebuilt from its parts, and asked the question every investor asks of a rule: does it beat simply holding the S&P 500? It does not. Buying when others are fearful works. Selling when others are greedy is what costs.
CNN's index, rebuilt
CNN publishes the dial from 2011 and describes its seven measures in words: Market Momentum (the S&P 500 against its 125-day average), Stock Price Strength (stocks at 52-week highs against those at 52-week lows), Stock Price Breadth (rising against falling volume), Put and Call Options, Market Volatility (the VIX against its 50-day average), Safe Haven Demand (stocks against bonds over 20 days) and Junk Bond Demand (risky bonds against safe ones). Each measure is scored from 0 to 100 against its own past year, and the dial is their average, read in five zones: Extreme Fear below 25, Fear up to 45, Neutral up to 55, Greed up to 75 and Extreme Greed above.
We rebuilt it from those words. Two measures had to be built another way. Options volumes are not in our data, so Put and Call Options uses the VIX against its own three-month version, which rises when traders pay up for protection now. And the two stock counts use the S&P 500's members instead of the whole New York Stock Exchange.
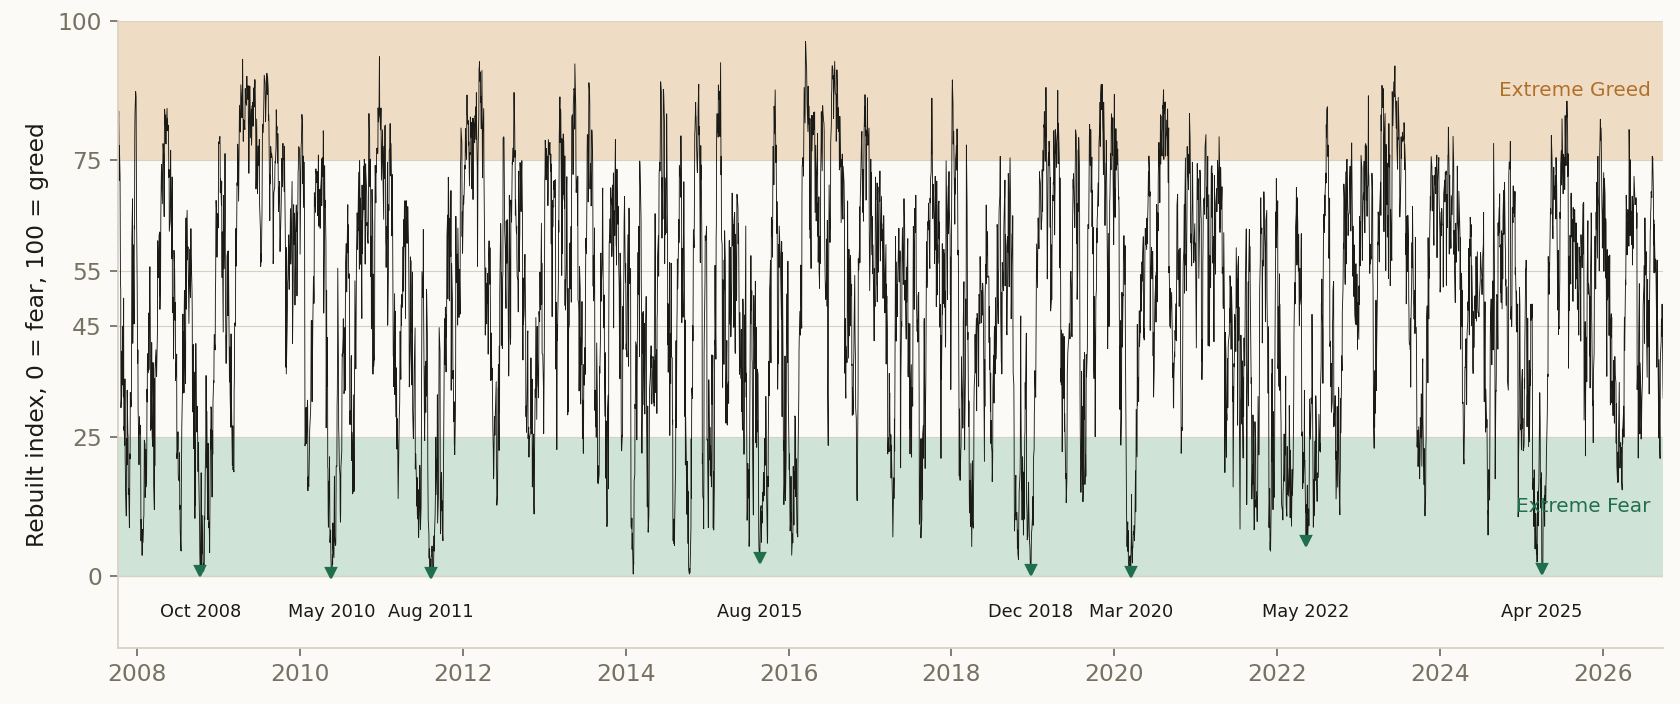
The rebuilt dial moves closely with CNN's own: over almost 4,000 days since 2011 the correlation between the two is 0.86, and on the days CNN showed Extreme Fear, ours read Extreme Fear three times in four. CNN's numbers were used for this check only.
Because it is built from its parts, the rebuilt dial goes back to 2007 and through the financial crisis. On 10 October 2008 it read 0.7 out of 100. Six days later Buffett wrote in the New York Times that he was buying American stocks.
1 Methodology, in detail (click to open)
1 Methodology
Buffett's rule. Buy SPY, the S&P 500 fund, when the dial falls into Extreme Fear, below 25. Sell when it climbs into Extreme Greed, above 75. Wait in cash in between. It is our simple version of his sentence, not a strategy he runs.
The crowd's rule. The opposite, doing what the others do: own SPY while the dial reads greed, above 50, and sell when it reads fear, below 50.
The 200-day average. Own SPY while its price is above its average price of the last 200 days. It is the trend rule most traders know, and the yardstick of our Kalman filter study.
Buying sharp drops. Buy SPY after a sharp two-day drop (its 2-day RSI below 10, the rule of our buy-the-dip study) and sell at the first close above its 5-day average. Then the same, but only on days of Extreme Fear.
Six months at a time. Each rule ran forward six months at a time from January 2009 to July 2026, 35 tests in a row, and each test was locked on the platform before it started, so nothing could be changed after seeing a result. A test starts where the rule's own history stands, so a position bought before the start carries on. The rules trade at the daily close and read the dial of the day before. Prices are daily closes from a licensed commercial data provider, without dividends, for the rules and for holding alike. Each trade costs 0.02%, and cash earns nothing.
Everything we tried. Besides the rules above we ran Buffett's rule on each of the seven measures alone, on the dial without some of its measures, with other buy and sell lines, with measures ranked against half a year or two years instead of one, on the Nasdaq-100 and small-company funds, and the drop rules on nine sector funds: 26 tests in all. The chart of every rule we ran on SPY is below, and the SSRN edition reports all of them.
2 Results
2.1 Headline
Sections 2.2 to 3, the full record: every year, every test, and how each one was run (click to open)
The registration names the two groups compared Buy fear, sell greed and Follow the mood; this paper calls them Buffett's rule and The crowd's rule.
Table 1. What $1 became on SPY, January 2009 to July 2026. 35 six-month tests in a row, each locked before it ran; SPY prices without dividends, 0.02% a trade, cash earns nothing. A trade is one holding inside a six-month test, so a holding that runs from one test into the next counts in both.
| Rule | $1 became | A year | Worst fall | Time in SPY | Trades a year |
|---|---|---|---|---|---|
| Buffett's rule | $4.74 | 9.3% | −34.1% | 50% | 3.2 |
| The crowd's rule | $1.95 | 3.9% | −22.0% | 55% | 16.3 |
| 200-day average | $3.23 | 6.9% | −21.6% | 81% | 4.6 |
| Holding SPY | $7.57 | 12.3% | −34.1% | 100% |
Table 2. The rules that came closest to holding SPY. The five of the 29 rules tested on SPY that made the most, and holding SPY. Gain per unit of risk is the Sharpe ratio of the daily returns.
| Rule | $1 became | A year | Worst fall | Gain per unit of risk |
|---|---|---|---|---|
| Holding SPY | $7.57 | 12.3% | −34.1% | 0.74 |
| Buffett's rule, without Stock Price Strength and Breadth | $6.09 | 10.9% | −34.1% | 0.77 |
| Buffett's rule, measures ranked against half a year | $5.15 | 9.8% | −28.7% | 0.73 |
| Buffett's rule, without Put and Call Options | $4.95 | 9.6% | −28.8% | 0.70 |
| Buffett's rule, CNN's full index | $4.74 | 9.3% | −34.1% | 0.68 |
| Buffett's rule, buy below 20 and sell above 80 | $4.17 | 8.5% | −28.7% | 0.61 |
Table 3. What came after each zone of the dial. SPY's average gain after a day in each zone, read the way a rule could (the day before), October 2007 to September 2026. Each column uses the days with its full horizon after them; the next-year column uses 4,524 days, to 29 September 2025. Averages over overlapping periods, not locked in advance.
| Zone of the dial | Share of days | Next month | Next year |
|---|---|---|---|
| Extreme Fear | 17% | 1.8% | 11.1% |
| Fear | 22% | 0.7% | 9.4% |
| Neutral | 15% | 0.5% | 10.6% |
| Greed | 32% | 0.7% | 11.7% |
| Extreme Greed | 14% | 0.5% | 12.3% |
| All days | 100% | 0.8% | 11.0% |
Table 4. Buying sharp drops on SPY, January 2009 to July 2026. A sharp drop: a close with the 2-day RSI below 10, sold at the first close above the 5-day average. Trades are counted as in the first table.
| Rule | $1 became | Worst fall | Time in SPY | Trades a year |
|---|---|---|---|---|
| Every sharp drop | $2.23 | −28.3% | 16% | 11.7 |
| Only sharp drops in Extreme Fear | $1.47 | −23.5% | 6% | 4.2 |
| Holding SPY | $7.57 | −34.1% | 100% |
2.2 Per-step results
| # | Out-of-sample window | Buffett's rule SR | The crowd's rule SR |
|---|---|---|---|
| 1 | 2009-01-02 → 2009-07-01 | 1.79 | -0.27 |
| 2 | 2009-07-01 → 2009-12-31 | n/a | 2.23 |
| 3 | 2010-01-04 → 2010-07-01 | -0.66 | -0.05 |
| 4 | 2010-07-01 → 2010-12-31 | 2.18 | 1.47 |
| 5 | 2011-01-03 → 2011-07-01 | 0.51 | -0.55 |
| 6 | 2011-07-01 → 2011-12-30 | -0.24 | -1.02 |
| 7 | 2012-01-03 → 2012-06-29 | 0.57 | 1.48 |
| 8 | 2012-07-02 → 2012-12-31 | -0.14 | -0.88 |
| 9 | 2013-01-02 → 2013-07-01 | 2.69 | 1.32 |
| 10 | 2013-07-01 → 2013-12-31 | 3.67 | 0.72 |
| 11 | 2014-01-02 → 2014-07-01 | 1.25 | -0.97 |
| 12 | 2014-07-01 → 2014-12-31 | 1.52 | -0.35 |
| 13 | 2015-01-02 → 2015-07-01 | 0.21 | -1.38 |
| 14 | 2015-07-01 → 2015-12-31 | -0.06 | -1.23 |
| 15 | 2016-01-04 → 2016-07-01 | 0.55 | 1.38 |
| 16 | 2016-07-01 → 2016-12-30 | 2.87 | 1.14 |
| 17 | 2017-01-03 → 2017-06-30 | 1.20 | 0.80 |
| 18 | 2017-07-03 → 2017-12-29 | 2.65 | 2.31 |
| 19 | 2018-01-02 → 2018-06-29 | 1.51 | -0.73 |
| 20 | 2018-07-02 → 2018-12-31 | -0.38 | 0.01 |
| 21 | 2019-01-02 → 2019-07-01 | 2.94 | 1.25 |
| 22 | 2019-07-01 → 2019-12-31 | 1.46 | -0.25 |
| 23 | 2020-01-02 → 2020-07-01 | 0.20 | -0.46 |
| 24 | 2020-07-01 → 2020-12-31 | 2.78 | 1.89 |
| 25 | 2021-01-04 → 2021-07-01 | 1.92 | 1.15 |
| 26 | 2021-07-01 → 2021-12-31 | 1.61 | 1.53 |
| 27 | 2022-01-03 → 2022-07-01 | -1.69 | -2.81 |
| 28 | 2022-07-01 → 2022-12-30 | 1.76 | -0.42 |
| 29 | 2023-01-03 → 2023-06-30 | 1.71 | 2.06 |
| 30 | 2023-07-03 → 2023-12-29 | 1.39 | 1.59 |
| 31 | 2024-01-02 → 2024-07-01 | 2.91 | 2.01 |
| 32 | 2024-07-01 → 2024-12-31 | 1.52 | -0.77 |
| 33 | 2025-01-02 → 2025-07-01 | 0.26 | 2.12 |
| 34 | 2025-07-01 → 2025-12-31 | 0.76 | 1.10 |
| 35 | 2026-01-02 → 2026-07-01 | 1.21 | 1.16 |
2.3 Search accounting
No search record exists for this design. It was not promoted from a recorded evolving search, so the number of alternatives tried before it, on paper, in another tool, or in the author's head, is unknown. Unknown is a different fact from one: a study with no lineage is not a strategy with one trial, it is a strategy with an unrecorded number of them. Accordingly no count of alternatives tried is claimed, and nothing in this paper is corrected for a search that was never recorded; the number that stands is the raw out-of-sample result plus this disclosure. The registered per-step record below (§4) still guarantees each window's hypothesis was hashed and registered before that window was scored.
2.4 The comparison
Both arms trade the same registered windows, so their returns can be PAIRED: inside each window the two return series are inner-joined date by date and the difference rBuffett's rule − rThe crowd's rule is the object under test. Because this is ONE pre-declared contrast, frozen at registration before any window was scored, the paired statistic needs no multiple-testing deflation, and the per-arm pooled numbers above are likewise uncorrected, because this design has no recorded search to correct against (§2.3). The paired contrast carries that gap differently from the arm levels: it was declared before each window ran and it is scored on the difference, so no window could be read first and scored after. What the timestamps cannot speak to is how this contrast came to be the declared one, which is the limit §2.3 states.
In the table: Arm A = Buffett's rule · Arm B = The crowd's rule.
| # | Window | Paired bars | Arm A | Arm B | Δ | Leader |
|---|---|---|---|---|---|---|
| 1 | 2009-01-05 → 2009-07-01 | 124 | +16.4% | -5.6% | +22.1 pp | Arm A |
| 2 | 2009-07-02 → 2009-12-31 | 127 | +0.0% | +18.7% | -18.7 pp | Arm B |
| 3 | 2010-01-05 → 2010-07-01 | 124 | -6.4% | -0.4% | -6.0 pp | Arm B |
| 4 | 2010-07-02 → 2010-12-31 | 127 | +15.1% | +7.3% | +7.8 pp | Arm A |
| 5 | 2011-01-04 → 2011-07-01 | 125 | +2.3% | -1.9% | +4.2 pp | Arm A |
| 6 | 2011-07-05 → 2011-12-30 | 126 | -5.6% | -6.4% | +0.7 pp | Arm A |
| 7 | 2012-01-04 → 2012-06-29 | 124 | +2.4% | +7.0% | -4.5 pp | Arm B |
| 8 | 2012-07-03 → 2012-12-31 | 124 | -0.7% | -3.1% | +2.4 pp | Arm A |
| 9 | 2013-01-03 → 2013-07-01 | 124 | +5.4% | +5.5% | -0.1 pp | Arm B |
| 10 | 2013-07-02 → 2013-12-31 | 127 | +16.6% | +2.3% | +14.3 pp | Arm A |
| 11 | 2014-01-03 → 2014-07-01 | 124 | +6.3% | -3.0% | +9.3 pp | Arm A |
| 12 | 2014-07-02 → 2014-12-31 | 127 | +7.7% | -1.0% | +8.6 pp | Arm A |
| 13 | 2015-01-05 → 2015-07-01 | 124 | +0.7% | -4.7% | +5.4 pp | Arm A |
| 14 | 2015-07-02 → 2015-12-31 | 127 | -1.3% | -3.7% | +2.5 pp | Arm A |
| 15 | 2016-01-05 → 2016-07-01 | 125 | +3.0% | +5.9% | -2.9 pp | Arm B |
| 16 | 2016-07-05 → 2016-12-30 | 126 | +6.9% | +4.2% | +2.7 pp | Arm A |
| 17 | 2017-01-04 → 2017-06-30 | 124 | +3.2% | +2.2% | +1.0 pp | Arm A |
| 18 | 2017-07-05 → 2017-12-29 | 125 | +7.8% | +3.9% | +3.9 pp | Arm A |
| 19 | 2018-01-03 → 2018-06-29 | 124 | +9.9% | -3.1% | +13.0 pp | Arm A |
| 20 | 2018-07-03 → 2018-12-31 | 125 | -3.8% | -0.0% | -3.7 pp | Arm B |
| 21 | 2019-01-03 → 2019-07-01 | 124 | +15.8% | +4.9% | +10.9 pp | Arm A |
| 22 | 2019-07-02 → 2019-12-31 | 127 | +6.3% | -1.0% | +7.3 pp | Arm A |
| 23 | 2020-01-03 → 2020-07-01 | 125 | -0.3% | -3.8% | +3.5 pp | Arm A |
| 24 | 2020-07-02 → 2020-12-31 | 127 | +9.2% | +11.9% | -2.6 pp | Arm B |
| 25 | 2021-01-05 → 2021-07-01 | 124 | +4.9% | +5.8% | -0.9 pp | Arm B |
| 26 | 2021-07-02 → 2021-12-31 | 127 | +10.3% | +3.2% | +7.2 pp | Arm A |
| 27 | 2022-01-04 → 2022-07-01 | 124 | -20.2% | -10.4% | -9.8 pp | Arm B |
| 28 | 2022-07-05 → 2022-12-30 | 126 | +16.2% | -4.3% | +20.5 pp | Arm A |
| 29 | 2023-01-04 → 2023-06-30 | 123 | +5.2% | +13.9% | -8.7 pp | Arm B |
| 30 | 2023-07-05 → 2023-12-29 | 125 | +5.5% | +5.6% | -0.1 pp | Arm B |
| 31 | 2024-01-03 → 2024-07-01 | 124 | +9.2% | +9.1% | +0.0 pp | tie |
| 32 | 2024-07-02 → 2024-12-31 | 127 | +9.8% | -2.9% | +12.7 pp | Arm A |
| 33 | 2025-01-03 → 2025-07-01 | 122 | +1.7% | +8.4% | -6.6 pp | Arm B |
| 34 | 2025-07-02 → 2025-12-31 | 127 | +2.6% | +4.9% | -2.4 pp | Arm B |
| 35 | 2026-01-05 → 2026-07-01 | 123 | +6.3% | +4.5% | +1.8 pp | Arm A |
Paired Sharpe of the difference track: 0.35 · block bootstrap (2000 paths, block 10, seed 1234): P(Buffett's rule beats The crowd's rule) = 95.2%.
Window win-rate. Buffett's rule led 21 of 35 windows (60.0%), The crowd's rule led 13, and 1 windows were ties, and the mean window gap of +2.71 pp points the same way. Widest single window: 2009 at +22.1 pp.
3 The circuit
The strategy is a circuit of platform primitives, frozen when the study is registered. Below is the circuit as wired on the canvas, the objective it encodes and how the search runs through it, followed by the mathematics each primitive actually computes, the same formulas the execution engine runs. The complete parameterisation is preserved in the study ledger (Appendix A).
The sentence below is the registered design with its rules in plain words; the exact registration record is in Appendix A2; the authored description of the design is Section 1.
A COMPARATIVE study: Buy fear, sell greed vs Follow the mood, walked on the same registered out-of-sample windows. Buy fear, sell greed: SPY, bought when the Fear & Greed gauge of the session before crosses below 25; sell when the Fear & Greed gauge of the session before crosses above 75, and forward-tested out-of-sample from the anchor: the rule set is frozen at the anchor, with no in-sample re-optimization. Follow the mood: SPY, bought when the Fear & Greed gauge of the session before crosses above 50; sell when the Fear & Greed gauge of the session before crosses below 50, and forward-tested out-of-sample from the anchor: the rule set is frozen at the anchor, with no in-sample re-optimization. The arms differ in: Signal Module, config (entry · operator: crosses_below → crosses_above; entry · value: 25 → 50; exit · operator: crosses_above → crosses_below; exit · value: 75 → 50). The contrast under test: whether Buy fear, sell greed generates better risk-adjusted returns than Follow the mood over the identical out-of-sample windows.
Every block in this study is a card from the platform's catalog: SPY and its price loader, the signal module that uses the rebuilt Fear & Greed Index, the six-month test and the cost card. The Fear & Greed card in the Regime palette draws the index and each of its seven measures, so a reader can rebuild every test.
Envelopes show counts, ratios, dates, and the parameters the author chose. Full price and per-name data series are not republished: the underlying market data is licensed to QuanterLab. Point figures quoted in the prose, a named holding's return over a stated span, are summary facts derived from public market prices, not redistributed series.
The objective and the search
Buy fear, sell greed
| Universe | Single ticker SPY with 365 days (~1.0y) of price history. |
|---|---|
| Signal generation | buy when the Fear & Greed gauge of the session before crosses below 25; sell when the Fear & Greed gauge of the session before crosses above 75. |
| Validation & out-of-sample | signal forward test (6m horizon from the anchor); overlays: Transaction Cost. |
Follow the mood
| Signal generation | buy when the Fear & Greed gauge of the session before crosses above 50; sell when the Fear & Greed gauge of the session before crosses below 50. |
|---|
Every other specification row is identical to Buy fear, sell greed's table above.
What differs between the arms, one difference; the comparison is clean:
-
paramSignal Module, config
- · buy when: the Fear & Greed gauge of the session before crosses below 25 (Buffett's rule); the Fear & Greed gauge of the session before crosses above 50 (The crowd's rule)
- · sell when: the Fear & Greed gauge of the session before crosses above 75 (Buffett's rule); the Fear & Greed gauge of the session before crosses below 50 (The crowd's rule)
Everything else is held identical, so an out-of-sample gap between the arms is attributable to this one change.
Cost elements are wired into the circuit.
Show the mathematics, 5 primitives, formulas and parity notes
3.1 Ticker
A single instrument symbol, the seed of a single-name circuit.
No math. It just names one stock and hands the symbol to a Ticker Price Loader, which fetches its price history.
A constant: one ticker string. The computation lives downstream in the loader and the signal.
3.2 Ticker Price Loader
Single-ticker OHLCV loader, the deep window a signal needs.
Same as the bulk loader but for one name, fetching a deep lifecycle window so an indicator or stochastic signal has enough history to warm up.
One ticker's OHLCV up to the anchor, length set by the strategy's warm-up requirement.
P = \{(o,h,l,c,v)_\tau : \tau \le t\}3.3 Signal Module
The entry / exit rule, turn indicators into a per-bar trade signal.
Composes indicators (RSI, moving averages, …) with comparison and logic operators into a rule that says enter, exit, or hold each bar. The rule is emitted as a portable config the optimizer tunes and the walk-forward validates, so what you design is exactly what gets traded.
\text{signal}_t = \begin{cases} +1 & \text{entry rule true} \\ 0 & \text{exit rule true} \\ \text{hold} & \text{otherwise}\end{cases}3.4 Backtest Validator
Forward-test the winning rule on unseen, out-of-sample data.
Takes the wired rule config (the Walk-Forward validated config wins, else the optimized config, else the raw signal config) and trades it FORWARD on the out-of-sample window to the right of the anchor, data it never saw during optimization, re-deriving the regime as-of each bar. It produces the true out-of-sample equity curve, trades and statistics: the signal-path twin of the Portfolio Forward Test, not an in-sample replay.
E_t = E_{t-1}\,(1 + r_t),\qquad \text{Sharpe} = \frac{\bar r - r_f}{\sigma_r}\sqrt{252}3.5 Transaction Cost
Charge for trading, slippage + commission on every turn.
Real trading isn't free. This deducts a cost proportional to how much you trade (turnover), in basis points, so the backtest reflects net, not gross, performance.
\text{cost}_t = \frac{\text{bps}}{10{,}000}\;\times\;\text{turnover}_t, \qquad \text{turnover}_t = \tfrac12\sum_i \lvert w_{i,t}-w_{i,t^-}\rvert4 Discussion
4.1 Findings
The answer. Buffett's rule turned $1 into $4.74. Simply holding SPY turned it into $7.57.
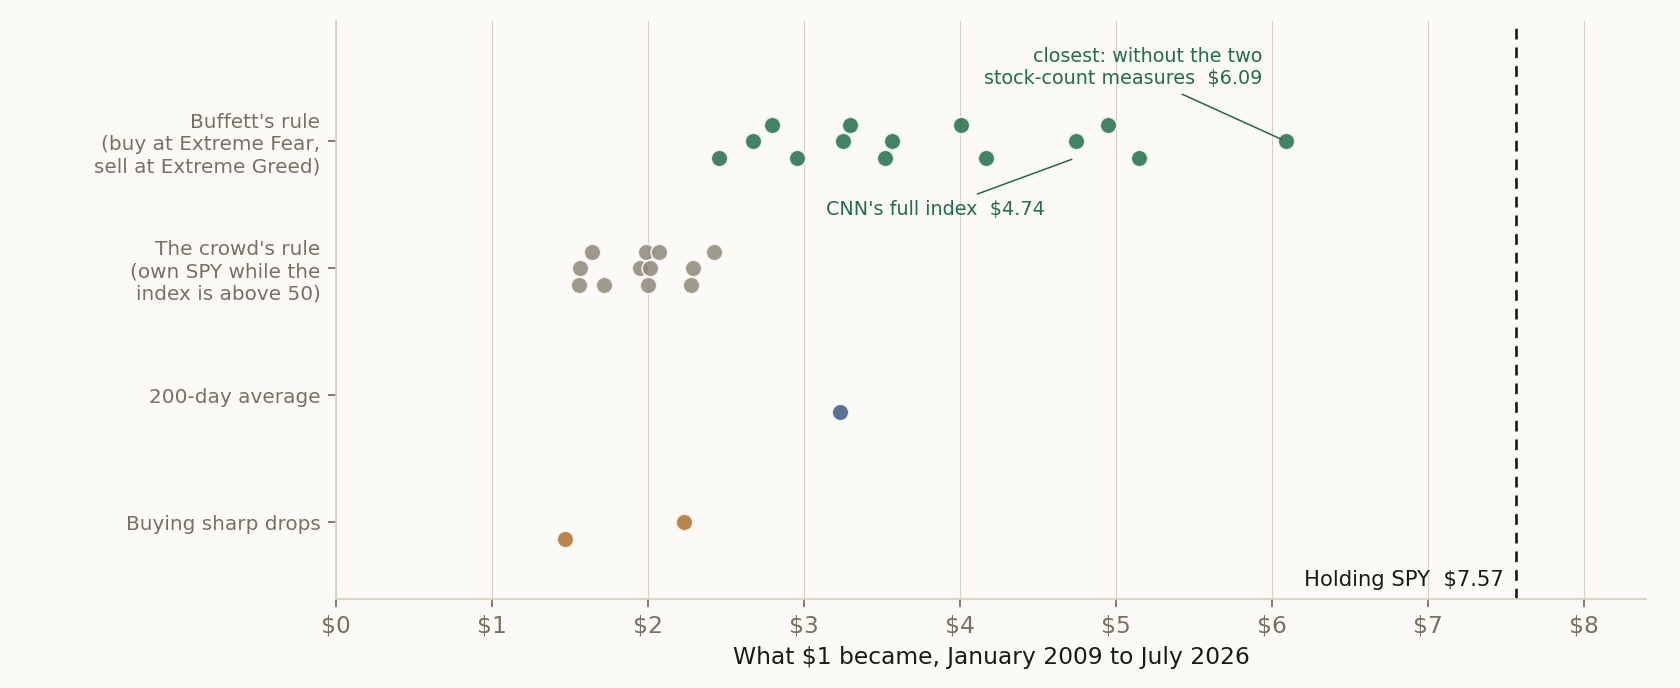
Did anything beat holding SPY? No. We ran 29 rules on SPY across the tests, and every one of them ended below holding. The closest was Buffett's rule on the dial without its two stock counts, at $6.09. For the swings it went through it did slightly better than holding, by a margin too small to count on after 26 tests. On the Nasdaq-100 fund, the small-company fund and the nine sector funds the result was the same: no rule made more than holding its own fund.
The half that works. In the month after a day of Extreme Fear, SPY rose more than twice as much as in an average month. Being greedy when others are fearful paid.
The half that costs. In the year after a day of Extreme Greed, SPY rose more than after any other level of the dial, and selling at greed meant sitting in cash through those years. March 2009 shows how it happens. The rule bought on the 3rd, a few days before the bottom, and sold on the 27th with a 16% gain, because after a crash three good weeks already look like Extreme Greed against the year behind them. SPY rose another 37% by the end of the year while the rule waited in cash.
Selling did not protect it either. In late January 2020 the rule bought a scare, the dial never reached greed before the crash, and the rule fell as far as holding did.
Against the other rules. Buffett's rule still beat the other ways to trade: the crowd's rule turned $1 into $1.95 and the 200-day average into $3.23. Among trading rules his was the best of the three. It could not beat holding.
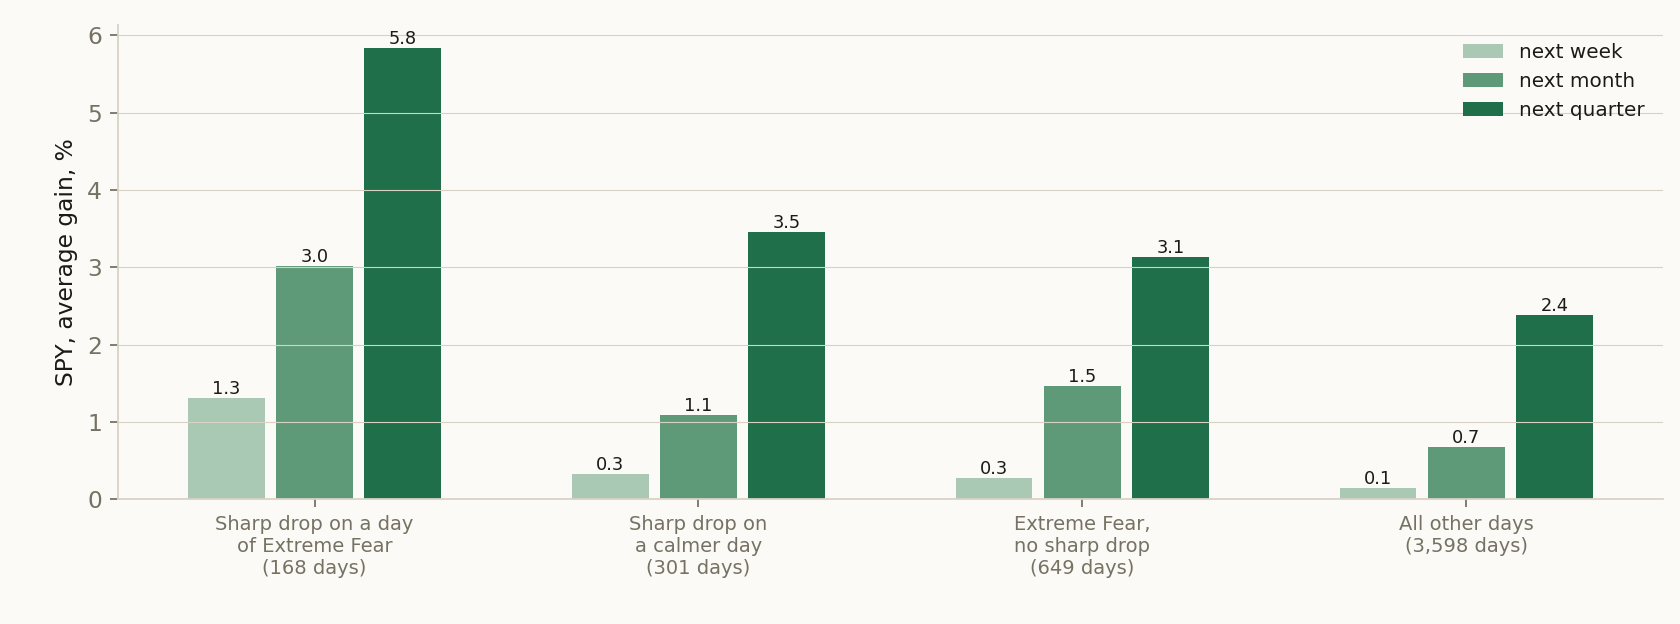
Buying sharp drops in fear. A sharp drop on a day of Extreme Fear was followed by a far better week than the same drop on a calmer day. Such days are rare, though, and waiting for both turned $1 into $1.47, against $2.23 for buying every sharp drop.
4.2 Interpretation
Buffett's other advice. Buffett also wrote that his "favorite holding period is forever", about outstanding businesses. For people who own the index his advice is plainer: in his 2013 letter he told the trustee for his wife to put 90% of the cash in a very low-cost S&P 500 index fund. In this record that is the rule that won.
The data agree with buying when others are fearful and disagree with selling when others are greedy. The year after a day of Extreme Greed was the best of any level of the dial, so a rule that sells there leaves the rest of the rise behind and waits in cash for the next scare.
Every rule here sells at greed. The next test keeps Buffett's buy and changes the sell: buy at Extreme Fear, then hold for a fixed time, or until the 200-day average says the trend has turned. It will be locked in before it runs, like these.
The SSRN edition reports all 26 tests, and the circuit of this study opens in the lab, where each of those settings is one click away.
Enter the lab
Press Open the platform and this paper's circuit opens in the lab: SPY and its prices, Buffett's rule and the crowd's rule side by side, the six-month test and the cost card. The Fear & Greed card in the Regime palette draws the rebuilt dial, measure by measure.
Things to try. Keep Buffett's buy and write a different sell. Use one of the seven measures alone. Move the lines to 20 and 80. Or change the fund.
4.3 Limitations
Prices leave out dividends, for the rules and for holding alike, and cash earns nothing. Dividends would add about twice as much to holding, which is always in the fund, as to a rule that is in it half the time, so they would widen holding's lead; interest on cash would narrow it, mostly after 2022, when cash began to pay again. There is one trading cost, 0.02% a trade. The dial is our rebuild of CNN's: two measures are built another way, and the stock counts miss companies whose prices are no longer carried, most of them in 2008. The averages after each zone of the dial overlap and were not locked in advance. Before the tests were locked, while the engine's run time was being measured, nine six-month results inside the test period were printed for three of the 26 tests; nothing in the design changed after that.
References
- Gelman, A., & Loken, E. (2013). The garden of forking paths: Why multiple comparisons can be a problem, even when there is no “fishing expedition.” Working paper, Columbia University.
- Harvey, C. R., Liu, Y., & Zhu, H. (2016). … and the Cross-Section of Expected Returns. Review of Financial Studies, 29(1), 5–68. doi:10.1093/rfs/hhv059
- Lo, A. W. (2002). The Statistics of Sharpe Ratios. Financial Analysts Journal, 58(4), 36–52. doi:10.2469/faj.v58.n4.2453
- Buffett (1987), Chairman's letter in the Berkshire Hathaway 1986 Annual Report: "fearful when others are greedy" and greedy "only when others are fearful". https://www.berkshirehathaway.com/letters/1986.html
- Buffett (1989), Chairman's letter in the Berkshire Hathaway 1988 Annual Report: "our favorite holding period is forever", of outstanding businesses with outstanding managements. https://www.berkshirehathaway.com/letters/1988.html
- Buffett (2008), Buy American. I Am., The New York Times, 16 October 2008: written six days after the rebuilt dial's lowest point of the crisis. https://www.nytimes.com/2008/10/17/opinion/17buffett.html
- Buffett (2014), Chairman's letter in the Berkshire Hathaway 2013 Annual Report: his advice to the trustee for his wife, 90% of the cash in a very low-cost S&P 500 index fund. https://www.berkshirehathaway.com/letters/2013ltr.pdf
- CNN Business, Fear & Greed Index: the published dial and its seven measures in words. https://www.cnn.com/markets/fear-and-greed
- Farrell and O'Connor (2025), The CNN Fear and Greed Index as a predictor of US equity index returns: Static and time-varying Granger causality, Finance Research Letters 72: on CNN's published series, the index helped predict US index returns, most of all in its early years. https://www.sciencedirect.com/science/article/abs/pii/S1544612324015216
- Whaley (2000), The Investor Fear Gauge, Journal of Portfolio Management 26(3): the VIX as the market's measure of fear. https://doi.org/10.3905/jpm.2000.319728
- Baker and Wurgler (2006), Investor Sentiment and the Cross-Section of Stock Returns, Journal of Finance 61(4): when sentiment is low, the stocks most exposed to it later earn more. https://doi.org/10.1111/j.1540-6261.2006.00885.x
- Connors and Alvarez (2009), Short Term Trading Strategies That Work, TradingMarkets: the 2-day RSI rule for buying sharp drops in a rising market.
- Faber (2007), A Quantitative Approach to Tactical Asset Allocation, Journal of Wealth Management 9(4): the moving-average rule on US stocks and other asset classes. https://doi.org/10.3905/jwm.2007.674809
- Bailey and Lopez de Prado (2014), The Deflated Sharpe Ratio, Journal of Portfolio Management 40(5): how much a result must be discounted for the number of tests behind it. https://doi.org/10.3905/jpm.2014.40.5.094
Appendix A Reproducibility in QuanterLab
Each step is backed by a frozen run report. The study is re-derivable from the ledger below.
| # | Commit | Report | Anchor | OOS window |
|---|---|---|---|---|
| 1 | 38f76f54bfad | 12764 | 2009-01-01 | 2009-01-02 → 2009-07-01 |
| 2 | 2e33160507ed | 12765 | 2009-07-01 | 2009-07-01 → 2009-12-31 |
| 3 | 230601821742 | 12766 | 2010-01-01 | 2010-01-04 → 2010-07-01 |
| 4 | 4a142701841a | 12767 | 2010-07-01 | 2010-07-01 → 2010-12-31 |
| 5 | 8c7e3e5264f4 | 12768 | 2011-01-01 | 2011-01-03 → 2011-07-01 |
| 6 | bb6b0b2988e2 | 12769 | 2011-07-01 | 2011-07-01 → 2011-12-30 |
| 7 | a195a95cb10f | 12770 | 2012-01-01 | 2012-01-03 → 2012-06-29 |
| 8 | a24be4b87f15 | 12771 | 2012-07-01 | 2012-07-02 → 2012-12-31 |
| 9 | 850df3fa395f | 12772 | 2013-01-01 | 2013-01-02 → 2013-07-01 |
| 10 | aa8b255e775d | 12773 | 2013-07-01 | 2013-07-01 → 2013-12-31 |
| 11 | 0da77580e3cc | 12774 | 2014-01-01 | 2014-01-02 → 2014-07-01 |
| 12 | 4d66aae62a15 | 12775 | 2014-07-01 | 2014-07-01 → 2014-12-31 |
| 13 | 5f0d38c5c434 | 12776 | 2015-01-01 | 2015-01-02 → 2015-07-01 |
| 14 | 9c62fc076637 | 12777 | 2015-07-01 | 2015-07-01 → 2015-12-31 |
| 15 | bd04bd224070 | 12778 | 2016-01-01 | 2016-01-04 → 2016-07-01 |
| 16 | 5e9aa4640aef | 12779 | 2016-07-01 | 2016-07-01 → 2016-12-30 |
| 17 | 5542f3adf46d | 12780 | 2017-01-01 | 2017-01-03 → 2017-06-30 |
| 18 | f85f9c0a2e5d | 12781 | 2017-07-01 | 2017-07-03 → 2017-12-29 |
| 19 | 69efa0d278e6 | 12782 | 2018-01-01 | 2018-01-02 → 2018-06-29 |
| 20 | 0df422d17916 | 12783 | 2018-07-01 | 2018-07-02 → 2018-12-31 |
| 21 | f6eefb67087f | 12784 | 2019-01-01 | 2019-01-02 → 2019-07-01 |
| 22 | 36a81db1c0ae | 12785 | 2019-07-01 | 2019-07-01 → 2019-12-31 |
| 23 | 263cd95f082e | 12786 | 2020-01-01 | 2020-01-02 → 2020-07-01 |
| 24 | 2634e9081e2b | 12787 | 2020-07-01 | 2020-07-01 → 2020-12-31 |
| 25 | 804dcffc32f9 | 12788 | 2021-01-01 | 2021-01-04 → 2021-07-01 |
| 26 | 0c2f474fc26e | 12789 | 2021-07-01 | 2021-07-01 → 2021-12-31 |
| 27 | eaecee8c9647 | 12790 | 2022-01-01 | 2022-01-03 → 2022-07-01 |
| 28 | 8f563fda1111 | 12791 | 2022-07-01 | 2022-07-01 → 2022-12-30 |
| 29 | 48492095843b | 12792 | 2023-01-01 | 2023-01-03 → 2023-06-30 |
| 30 | a35398d5a48e | 12793 | 2023-07-01 | 2023-07-03 → 2023-12-29 |
| 31 | aa6a19b6f685 | 12794 | 2024-01-01 | 2024-01-02 → 2024-07-01 |
| 32 | 16a69d8ea5da | 12795 | 2024-07-01 | 2024-07-01 → 2024-12-31 |
| 33 | a0fbda5541c4 | 12796 | 2025-01-01 | 2025-01-02 → 2025-07-01 |
| 34 | 841d27a4030b | 12797 | 2025-07-01 | 2025-07-01 → 2025-12-31 |
| 35 | 59e6433d4b4f | 12798 | 2026-01-01 | 2026-01-02 → 2026-07-01 |
Appendix A2 Registration record
What this record does and does not establish. Every window in this study is historical: the data existed before the study began, so this is sequential registration on past windows, not pre-registration in the clinical-trial sense, and no procedure could make it so. What the platform does enforce is order, each step's specification was frozen and hashed before that step was scored, and the walk cannot advance past a step that was never run or close one with a result registered for a different window. The two timestamp columns below are the evidence: read them together and each registration precedes its own run, and each run precedes the next registration. A study whose registrations all post-date its runs would show it here. Wall-clock spacing between registrations varies with the author's schedule and queue latency; the ordering, not the tempo, is the claim.
“A COMPARATIVE study: Buy fear, sell greed vs Follow the mood, walked on the same registered out-of-sample windows. Buy fear, sell greed: SPY, bought when the Fear & Greed gauge of the session before crosses below 25; sell when the Fear & Greed gauge of the session before crosses above 75, and forward-tested out-of-sample from the anchor: the rule set is frozen at the anchor, with no in-sample re-optimization. Follow the mood: SPY, bought when the Fear & Greed gauge of the session before crosses above 50; sell when the Fear & Greed gauge of the session before crosses below 50, and forward-tested out-of-sample from the anchor: the rule set is frozen at the anchor, with no in-sample re-optimization. The arms differ in: Signal Module, config (entry · operator: crosses_below → crosses_above; entry · value: 25 → 50; exit · operator: crosses_above → crosses_below; exit · value: 75 → 50). The contrast under test: whether Buy fear, sell greed generates better risk-adjusted returns than Follow the mood over the identical out-of-sample windows.”
The same hypothesis was registered independently at every step, hashed before each step's out-of-sample window was scored:
| # | Anchor | Registered at (UTC) | Run completed (UTC) |
|---|---|---|---|
| 1 | 2009-01-01 | 2026-10-02 04:06:21 | 2026-10-02 04:06:22 |
| 2 | 2009-07-01 | 2026-10-02 04:06:22 | 2026-10-02 04:06:23 |
| 3 | 2010-01-01 | 2026-10-02 04:06:23 | 2026-10-02 04:06:24 |
| 4 | 2010-07-01 | 2026-10-02 04:06:24 | 2026-10-02 04:06:25 |
| 5 | 2011-01-01 | 2026-10-02 04:06:25 | 2026-10-02 04:06:27 |
| 6 | 2011-07-01 | 2026-10-02 04:06:27 | 2026-10-02 04:06:28 |
| 7 | 2012-01-01 | 2026-10-02 04:06:28 | 2026-10-02 04:06:29 |
| 8 | 2012-07-01 | 2026-10-02 04:06:29 | 2026-10-02 04:06:30 |
| 9 | 2013-01-01 | 2026-10-02 04:06:30 | 2026-10-02 04:06:31 |
| 10 | 2013-07-01 | 2026-10-02 04:06:31 | 2026-10-02 04:06:32 |
| 11 | 2014-01-01 | 2026-10-02 04:06:32 | 2026-10-02 04:06:33 |
| 12 | 2014-07-01 | 2026-10-02 04:06:33 | 2026-10-02 04:06:35 |
| 13 | 2015-01-01 | 2026-10-02 04:06:35 | 2026-10-02 04:06:36 |
| 14 | 2015-07-01 | 2026-10-02 04:06:36 | 2026-10-02 04:06:37 |
| 15 | 2016-01-01 | 2026-10-02 04:06:37 | 2026-10-02 04:06:38 |
| 16 | 2016-07-01 | 2026-10-02 04:06:38 | 2026-10-02 04:06:39 |
| 17 | 2017-01-01 | 2026-10-02 04:06:39 | 2026-10-02 04:06:40 |
| 18 | 2017-07-01 | 2026-10-02 04:06:40 | 2026-10-02 04:06:41 |
| 19 | 2018-01-01 | 2026-10-02 04:06:41 | 2026-10-02 04:06:42 |
| 20 | 2018-07-01 | 2026-10-02 04:06:42 | 2026-10-02 04:06:44 |
| 21 | 2019-01-01 | 2026-10-02 04:06:44 | 2026-10-02 04:06:45 |
| 22 | 2019-07-01 | 2026-10-02 04:06:45 | 2026-10-02 04:06:46 |
| 23 | 2020-01-01 | 2026-10-02 04:06:46 | 2026-10-02 04:06:47 |
| 24 | 2020-07-01 | 2026-10-02 04:06:47 | 2026-10-02 04:06:48 |
| 25 | 2021-01-01 | 2026-10-02 04:06:48 | 2026-10-02 04:06:49 |
| 26 | 2021-07-01 | 2026-10-02 04:06:49 | 2026-10-02 04:06:50 |
| 27 | 2022-01-01 | 2026-10-02 04:06:50 | 2026-10-02 04:06:51 |
| 28 | 2022-07-01 | 2026-10-02 04:06:51 | 2026-10-02 04:06:53 |
| 29 | 2023-01-01 | 2026-10-02 04:06:53 | 2026-10-02 04:06:54 |
| 30 | 2023-07-01 | 2026-10-02 04:06:54 | 2026-10-02 04:06:55 |
| 31 | 2024-01-01 | 2026-10-02 04:06:55 | 2026-10-02 04:06:56 |
| 32 | 2024-07-01 | 2026-10-02 04:06:56 | 2026-10-02 04:06:57 |
| 33 | 2025-01-01 | 2026-10-02 04:06:57 | 2026-10-02 04:06:58 |
| 34 | 2025-07-01 | 2026-10-02 04:06:58 | 2026-10-02 04:06:59 |
| 35 | 2026-01-01 | 2026-10-02 04:06:59 | 2026-10-02 04:07:00 |