

Navigating Mean Reversion: Breaking Down the Base Mechanism
Mean reversion is the idea that a price pushed too far in a few days tends to come part of the way back. The research explains it as a trade: holders who must sell at once push the price below what the news justifies, and whoever buys from them is paid when it drifts back.
We test its plainest trading form, the two-day RSI dip rule: buy a stock after a sharp two-day fall while its long trend is still up, and sell at the first close back above its short average. We run it on every member of the S&P 500 for twenty years, one year at a time, each year registered on the platform before it was run.
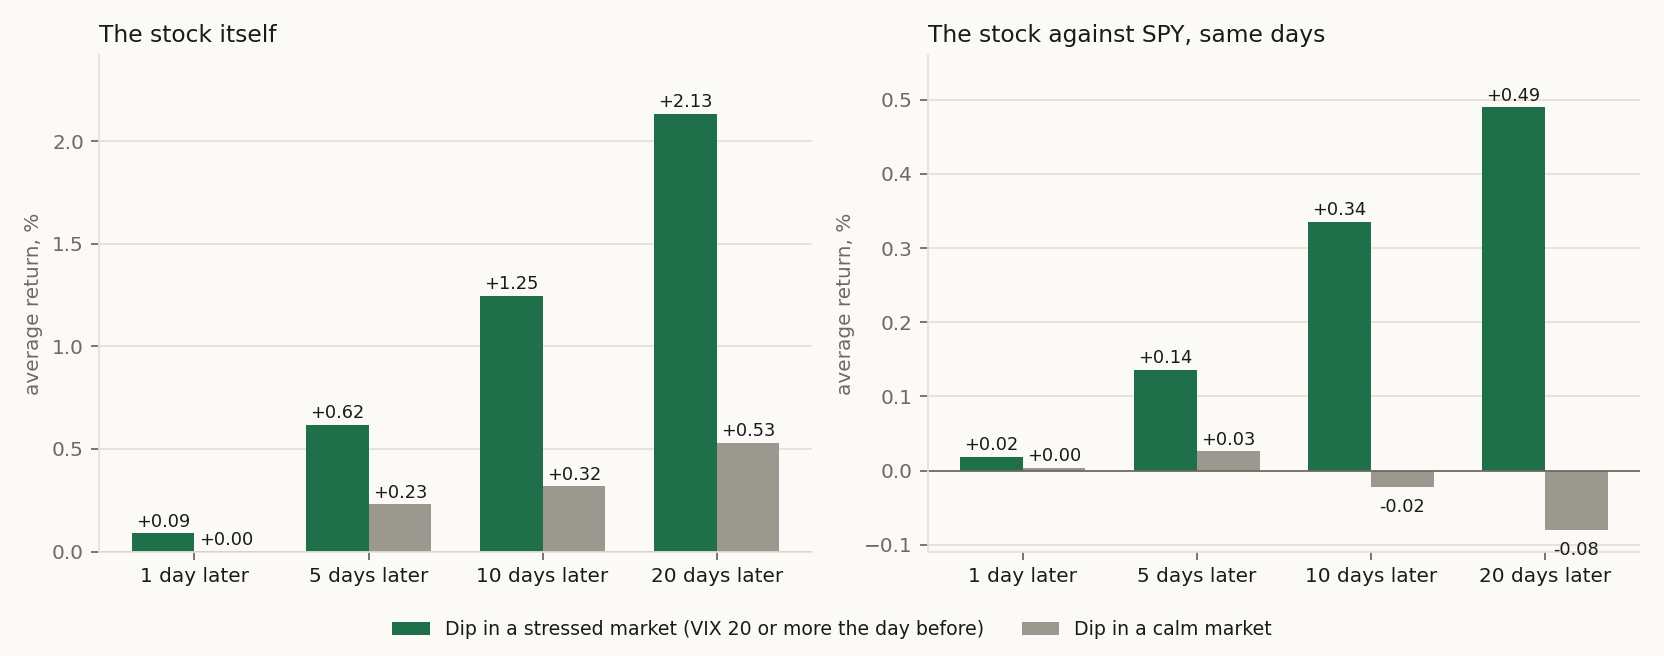
We measured the bounce first, with no trading: what the stock did in the days after a dip, and what the market did over the same days. Most of the bounce was the market's. Then we let the rule trade. Before costs it beat holding the index, but it trades so often that a small charge on each buy and each sell takes that lead away. Last we tried three ways to take fewer dips. Choosing them by the shape of the fall, or by how the stock behaved the year before, kept less than taking every dip. Taking only the dips that came when the VIX was high, when the research on liquidity expects buyers to be scarce, kept more once costs were high. Most of that lead was made in the three stressed years that began with the pandemic, and in calm bull years the gated book sits almost idle.
Why this one
I came to quantitative finance through mean reversion. A price pushed too far in a few days tends to come part of the way back, and that was the first market behaviour I could actually set up myself. Since then I have built thousands of versions of it: other entries, other exits, other filters, other markets, other holding periods. It is still my favourite mechanism, because it works like a tool with many knobs, and each knob changes what the tool does.
That is also why this paper shows the plain version and not my best one. After thousands of combinations, any striking curve I could put on this page would be the one that survived my own search, and it would tell you more about my search than about the market. So this paper is a lesson in how the mechanism works. It takes the textbook rule, runs it on every member of the S&P 500 for twenty years, and turns two knobs: what trading costs, and which dips to take. Every card in the circuit opens in the lab, and every knob this paper leaves alone is one you can turn yourself.
The mechanism
The usual answer in the research is a trade between two kinds of people. Some holders need to sell now, because of a margin call, a fund outflow, a stop order or plain fear, and they sell faster than buyers arrive, so the price falls further than the news behind it justifies. Whoever buys from them provides a service, the chance to sell at once, and is paid for it when the price drifts back. Lehmann (1990) and Jegadeesh (1990) found this short-term reversal in US stocks: the losers of one week or one month tended to do better the next. Lo and MacKinlay (1990) showed that part of it comes from stocks catching up with one another. Nagel (2012) tied the pay to the service: reversal profits were largest when the VIX was high, because that is when few people are willing to buy.
The rule in this paper is the plainest form of that trade. A dip is a day on which the two-day RSI, a gauge of how one-sided the last two closes were, falls below 10 while the close is still above its 200-day average: the long trend is up and the last two days were not. The position is sold when the close is back above its 5-day average. Practitioners know the rule from Connors and Alvarez (2008), and it has a thousand variations. We use its common form.
1 Methodology, in detail (click to open)
1 Methodology
The index. Each window starts on the first of January of a year from 2006 to 2025 with the S&P 500 as it stood that day, members included whatever became of them later. The Every Member card passes the whole index to the rule, with no ranking and no screen. A member counts when our data vendor has its prices: 345 members in 2006, rising to 498 from 2021 on (see the limits).
The rule. A dip is a day on which the two-day RSI closes below 10 while the close is above its 200-day average. The position is closed when the close is back above its 5-day average. Long only.
The book. Each window starts with 100,000 dollars. A new dip asks for a tenth of the book and keeps its size from entry to exit. Dips arrive faster than the book frees cash, so a day's new dips share whatever cash is free, and most positions end up far smaller than a tenth. The book usually holds many more than ten names. A dip that finds no free cash at all is skipped, and is not bought later in the middle of its move. The book buys at the close that gives the signal.
The cost. Four copies of each twenty-year walk differ only in the cost charged on every buy and every sell: nothing, 0.02, 0.05 and 0.1 percent of the traded value. A round trip pays twice that.
The walk. Each of the twenty one-year windows was registered on the platform before it was run, with the rule, the book and the cost fixed in the registration, and the paper is compiled from the frozen run reports. Growth a year compounds the twenty yearly returns. Sharpe ratios are the platform's pooled figure on the daily returns of all twenty windows, one basis for the whole page.
What Happens Next. On the every-dip book a second card records every new dip in the year and the stock's return 1, 5, 10 and 20 trading days later, bought at the next open (the figures) or at that day's close, raw and against SPY over the same days. It trades nothing and measures the bounce on its own. It counts every dip on every member, including dips on names the book already held.
The three designs. The first test registered, quiet slides, took a dip only when the last three days traded on less than 0.8 of the stock's 50-day average volume and less than half of the fall came in the overnight gaps: a slide on thin volume reads as selling that runs out, a gap as news. The second split the index by the Hurst exponent over the prior year and traded the most mean-reverting third against the most trending third. The third took a dip only when the VIX had closed at 20 or higher the session before. The level was fixed before the walk from years the walk does not test: from 1990 to 2005 the VIX averaged 19.45, so a stressed market here means a VIX above its long-run average, and about a quarter of all dips fell on such days. The one-session lag is there because the VIX settles after the stock market closes.
The family. Three designs at four costs make twelve walks, all reported here. On 24 September 2026 the first walk was registered and read, the Hurst design was registered after it, and the stress design after the Hurst walks were read. The paper's trial count is twelve.
2 Results
2.1 Headline
This paper answers for a declared family of 12 registered studies. 12 member walks are drawn as 24 lines (a comparative walk contributes one line per arm), each chained across its own out-of-sample windows, on one calendar axis, all rebased to 1× on the first session they share. 4 of them are shown to start, the ones the paper reads by; the others are switched off until their name is clicked. The paper’s own walk is the heavy line; the dashed grey line is the study’s own benchmark.
Sections 2.2 to 3, the full record: every year, every test, and how each one was run (click to open)
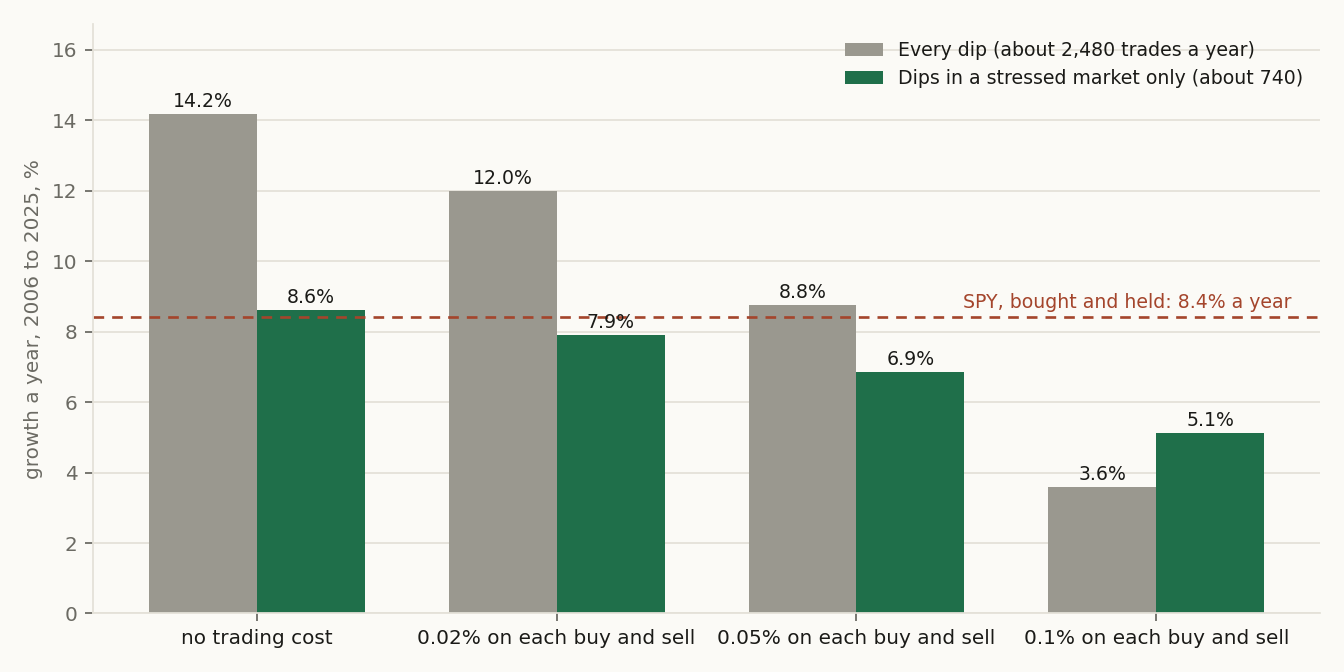
Table 1. What each book kept, by trading cost: growth a year, 2006 to 2025. Twenty one-year windows compounded. The cost is charged on every buy and every sell, so a round trip pays twice. Trades are the positions actually opened in a year, on average. SPY is its price only, without its dividends.
| Book | Trades a year | No cost | 0.02% a side | 0.05% a side | 0.1% a side |
|---|---|---|---|---|---|
| Every dip | 2,480 | 14.2% | 12.0% | 8.8% | 3.6% |
| Dips in a stressed market | 740 | 8.6% | 7.9% | 6.9% | 5.1% |
| Quiet slides | 700 | 8.2% | 6.8% | 4.7% | 1.3% |
| Mean-reverting third (Hurst) | 790 | 11.6% | 9.9% | 7.4% | 3.5% |
| Trending third (Hurst) | 770 | 10.6% | 9.0% | 6.6% | 2.7% |
| SPY price, bought and held | none | 8.4% | 8.4% | 8.4% | 8.4% |
Table 2. Sharpe on the pooled daily returns, by trading cost. The platform's pooled Sharpe over the daily returns of all twenty windows, the one basis this page uses.
| Book | No cost | 0.02% a side | 0.05% a side | 0.1% a side |
|---|---|---|---|---|
| Every dip | 0.92 | 0.80 | 0.61 | 0.30 |
| Dips in a stressed market | 0.73 | 0.68 | 0.60 | 0.47 |
| Quiet slides | 0.72 | 0.61 | 0.45 | 0.17 |
| Mean-reverting third (Hurst) | 0.87 | 0.76 | 0.59 | 0.32 |
| Trending third (Hurst) | 0.82 | 0.71 | 0.54 | 0.27 |
Table 3. What happens after a dip, bought at the next open. Every new dip of the rule in the year, pooled over the twenty windows, split by the VIX close of the session before. Returns are averages, in percent. It counts every dip on every member, including dips on names the book already held, so it counts more dips than the book signalled.
| Dips | How many | 1 day | 5 days | 10 days | 20 days | 20 days vs SPY | Up after 5 days |
|---|---|---|---|---|---|---|---|
| In a stressed market | 16,512 | +0.09 | +0.62 | +1.25 | +2.13 | +0.49 | 57.5% |
| In a calm market | 48,693 | +0.00 | +0.23 | +0.32 | +0.53 | -0.08 | 54.2% |
| All dips | 65,205 | +0.02 | +0.33 | +0.55 | +0.94 | +0.06 | 55.0% |
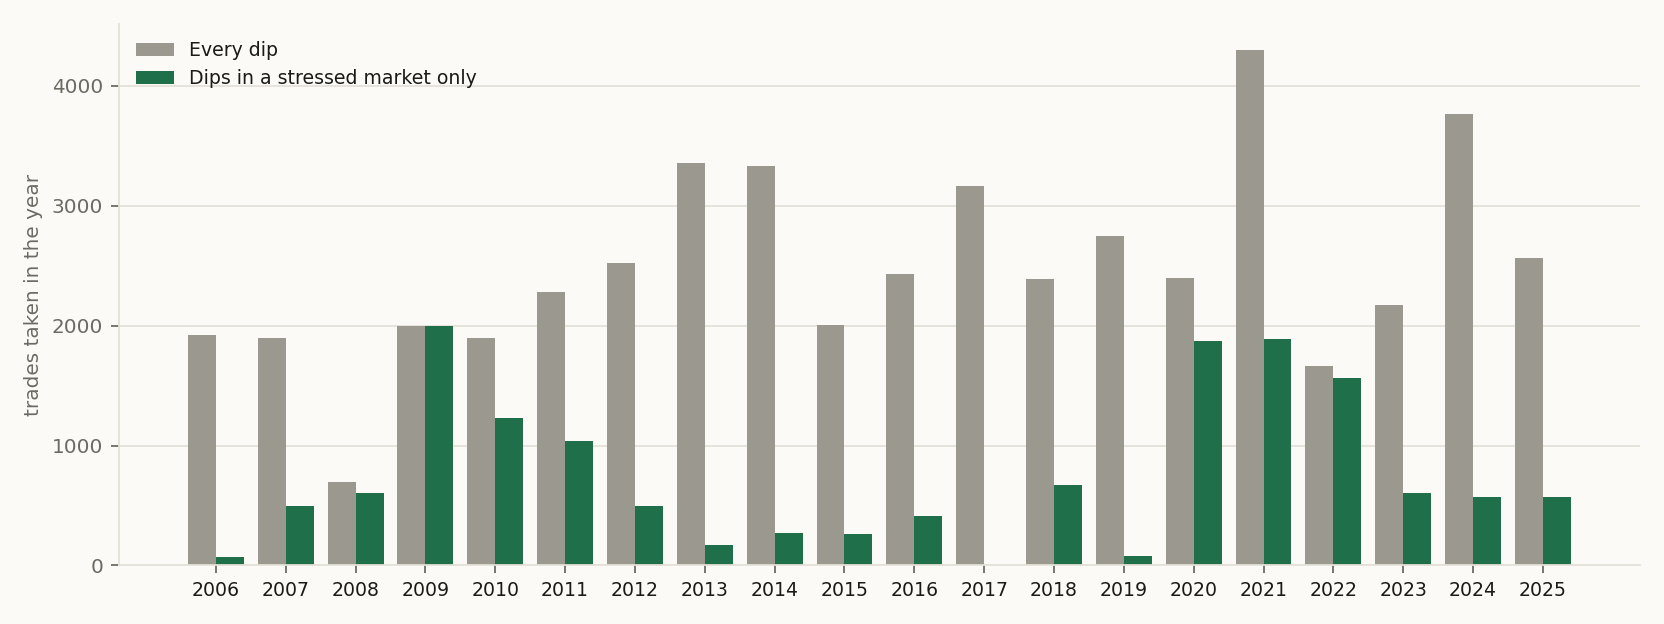
Table 4. The two books year by year at 0.1% a side, 2006 to 2015. Trades opened in the year, and the year's return after costs, in percent.
| Year | Trades, every dip | Trades, stressed only | Every dip | Stressed only | SPY price |
|---|---|---|---|---|---|
| 2006 | 1,924 | 73 | +15.3 | +2.7 | +11.8 |
| 2007 | 1,898 | 497 | +9.8 | +11.5 | +3.4 |
| 2008 | 694 | 607 | -12.0 | -13.9 | -37.7 |
| 2009 | 1,999 | 1,994 | +5.4 | +5.4 | +19.9 |
| 2010 | 1,898 | 1,229 | -0.5 | -0.4 | +11.0 |
| 2011 | 2,284 | 1,041 | -2.6 | +5.7 | -1.2 |
| 2012 | 2,526 | 492 | -2.8 | +2.1 | +11.7 |
| 2013 | 3,361 | 172 | +22.9 | +3.8 | +26.4 |
| 2014 | 3,334 | 268 | +10.4 | +5.6 | +12.4 |
| 2015 | 2,005 | 264 | -4.2 | +11.6 | -0.8 |
Table 5. The two books year by year at 0.1% a side, 2016 to 2025. Trades opened in the year, and the year's return after costs, in percent.
| Year | Trades, every dip | Trades, stressed only | Every dip | Stressed only | SPY price |
|---|---|---|---|---|---|
| 2016 | 2,432 | 412 | -1.9 | +1.8 | +11.2 |
| 2017 | 3,164 | 0 | +1.0 | +0.0 | +18.5 |
| 2018 | 2,393 | 667 | -11.4 | -3.6 | -7.0 |
| 2019 | 2,751 | 82 | +8.1 | +8.1 | +28.7 |
| 2020 | 2,394 | 1,871 | +12.3 | +23.4 | +15.1 |
| 2021 | 4,302 | 1,893 | +13.0 | +19.3 | +28.8 |
| 2022 | 1,662 | 1,560 | -1.8 | +12.8 | -19.9 |
| 2023 | 2,175 | 604 | -1.7 | +1.6 | +24.8 |
| 2024 | 3,765 | 574 | +18.6 | +7.0 | +24.0 |
| 2025 | 2,566 | 568 | +2.4 | +3.9 | +16.6 |
2.2 Per-step results
| # | Out-of-sample window | Stressed-market dips SR | Every dip SR |
|---|---|---|---|
| 1 | 2006-01-03 → 2006-12-29 | 1.43 | 1.25 |
| 2 | 2007-01-03 → 2007-12-31 | 1.06 | 0.71 |
| 3 | 2008-01-02 → 2008-12-31 | -0.49 | -0.39 |
| 4 | 2009-01-02 → 2009-12-31 | 0.39 | 0.39 |
| 5 | 2010-01-04 → 2010-12-31 | 0.06 | 0.06 |
| 6 | 2011-01-03 → 2011-12-30 | 0.41 | -0.04 |
| 7 | 2012-01-03 → 2012-12-31 | 0.34 | -0.18 |
| 8 | 2013-01-02 → 2013-12-31 | 1.10 | 1.74 |
| 9 | 2014-01-02 → 2014-12-31 | 1.64 | 0.89 |
| 10 | 2015-01-02 → 2015-12-31 | 1.48 | -0.18 |
| 11 | 2016-01-04 → 2016-12-30 | 0.27 | -0.10 |
| 12 | 2017-01-03 → 2017-12-29 | n/a | 0.16 |
| 13 | 2018-01-02 → 2018-12-31 | -0.28 | -0.71 |
| 14 | 2019-01-02 → 2019-12-31 | 2.18 | 0.69 |
| 15 | 2020-01-02 → 2020-12-31 | 1.04 | 0.61 |
| 16 | 2021-01-04 → 2021-12-31 | 1.58 | 0.87 |
| 17 | 2022-01-03 → 2022-12-30 | 0.84 | -0.02 |
| 18 | 2023-01-03 → 2023-12-29 | 0.26 | -0.05 |
| 19 | 2024-01-02 → 2024-12-31 | 1.42 | 1.42 |
| 20 | 2025-01-02 → 2025-12-31 | 0.34 | 0.22 |
2.2b Every test, in numbers
Figure 1 draws these walks; here is every one of them in numbers, the paper’s own walk first and the study’s benchmark last.
| Walk | Windows | Span | Growth | CAGR | Worst drawdown | Pooled Sharpe |
|---|---|---|---|---|---|---|
| dips in a stressed market every dip · Stressed-market dips (this paper) | 20 | 2006-01-03 → 2025-12-31 | +171.9% | +5.1% | -27.5% | 0.47 |
| dips in a stressed market every dip · Every dip (this paper) | 20 | 2006-01-03 → 2025-12-31 | +103.3% | +3.6% | -32.2% | 0.30 |
| quiet slides every dip · Quiet slides | 20 | 2006-01-03 → 2025-12-31 | +30.0% | +1.3% | -33.8% | 0.17 |
| quiet slides every dip · Every dip | 20 | 2006-01-03 → 2025-12-31 | +103.3% | +3.6% | -32.2% | 0.30 |
| quiet slides every dip · no trading cost · Quiet slides | 20 | 2006-01-03 → 2025-12-31 | +382.7% | +8.2% | -23.4% | 0.72 |
| quiet slides every dip · no trading cost · Every dip | 20 | 2006-01-03 → 2025-12-31 | +1319.9% | +14.2% | -24.9% | 0.92 |
| the mean-reverting third the trending third · Mean-reverting third | 20 | 2006-01-03 → 2025-12-31 | +97.9% | +3.5% | -40.7% | 0.32 |
| the mean-reverting third the trending third · Trending third | 20 | 2006-01-03 → 2025-12-31 | +69.8% | +2.7% | -27.5% | 0.27 |
| the mean-reverting third the trending third · no trading cost · Mean-reverting third | 20 | 2006-01-03 → 2025-12-31 | +795.1% | +11.6% | -22.1% | 0.87 |
| the mean-reverting third the trending third · no trading cost · Trending third | 20 | 2006-01-03 → 2025-12-31 | +654.9% | +10.6% | -22.1% | 0.82 |
| quiet slides every dip · 0.02% a trade · Quiet slides | 20 | 2006-01-03 → 2025-12-31 | +271.4% | +6.8% | -25.3% | 0.61 |
| quiet slides every dip · 0.02% a trade · Every dip | 20 | 2006-01-03 → 2025-12-31 | +862.7% | +12.0% | -25.5% | 0.80 |
| the mean-reverting third the trending third · 0.02% a trade · Mean-reverting third | 20 | 2006-01-03 → 2025-12-31 | +561.9% | +9.9% | -24.8% | 0.76 |
| the mean-reverting third the trending third · 0.02% a trade · Trending third | 20 | 2006-01-03 → 2025-12-31 | +460.1% | +9.0% | -22.5% | 0.71 |
| quiet slides every dip · 0.05% a trade · Quiet slides | 20 | 2006-01-03 → 2025-12-31 | +150.6% | +4.7% | -28.4% | 0.45 |
| quiet slides every dip · 0.05% a trade · Every dip | 20 | 2006-01-03 → 2025-12-31 | +437.3% | +8.8% | -26.3% | 0.61 |
| the mean-reverting third the trending third · 0.05% a trade · Mean-reverting third | 20 | 2006-01-03 → 2025-12-31 | +320.9% | +7.5% | -28.5% | 0.59 |
| the mean-reverting third the trending third · 0.05% a trade · Trending third | 20 | 2006-01-03 → 2025-12-31 | +258.0% | +6.6% | -22.9% | 0.54 |
| dips in a stressed market every dip · no trading cost · Stressed-market dips | 20 | 2006-01-03 → 2025-12-31 | +423.4% | +8.6% | -25.0% | 0.73 |
| dips in a stressed market every dip · no trading cost · Every dip | 20 | 2006-01-03 → 2025-12-31 | +1319.9% | +14.2% | -24.9% | 0.92 |
| dips in a stressed market every dip · 0.02% a trade · Stressed-market dips | 20 | 2006-01-03 → 2025-12-31 | +359.1% | +7.9% | -25.5% | 0.68 |
| dips in a stressed market every dip · 0.02% a trade · Every dip | 20 | 2006-01-03 → 2025-12-31 | +862.7% | +12.0% | -25.5% | 0.80 |
| dips in a stressed market every dip · 0.05% a trade · Stressed-market dips | 20 | 2006-01-03 → 2025-12-31 | +277.3% | +6.9% | -26.3% | 0.60 |
| dips in a stressed market every dip · 0.05% a trade · Every dip | 20 | 2006-01-03 → 2025-12-31 | +437.3% | +8.8% | -26.3% | 0.61 |
| platform reference (SPY) (benchmark) | 2006-01-03 → 2025-12-31 | +402.8% | +8.4% | -57.4% |
2.3 Search accounting
This paper's search is a declared family: the paper's twelve walks, counted at N = 12 evaluated books. Every member is either a registered walk with its own hypothesis and frozen record, or a derived average computed from those frozen records; every member is reported, in the family figure and table, and none was selected away. The count is declared by the author rather than derived from one project's ledger, because the members are sibling registered studies; the declaration names them and is frozen in this artifact. What the source strategy's author searched before publishing is not knowable from here and is not counted. The registered per-step record below still guarantees each window's hypothesis was hashed and registered before that window was scored.
2.4 The comparison
Both arms trade the same registered windows, so their returns can be PAIRED: inside each window the two return series are inner-joined date by date and the difference rStressed-market dips − rEvery dip is the object under test. Because this is ONE pre-declared contrast, frozen at registration before any window was scored, the paired statistic needs no multiple-testing deflation; the arm-level records carry the declared family count of §2.3 as their search accounting, and this contrast, registered per window before scoring, is not multiplied by it.
In the table: Arm A = Stressed-market dips · Arm B = Every dip.
| # | Window | Paired bars | Arm A | Arm B | Δ | Leader |
|---|---|---|---|---|---|---|
| 1 | 2006-01-04 → 2006-12-29 | 250 | +2.7% | +15.3% | -12.6 pp | Arm B |
| 2 | 2007-01-04 → 2007-12-31 | 250 | +11.5% | +9.8% | +1.7 pp | Arm A |
| 3 | 2008-01-03 → 2008-12-31 | 252 | -13.9% | -12.0% | -1.9 pp | Arm B |
| 4 | 2009-01-05 → 2009-12-31 | 251 | +5.4% | +5.4% | +0.0 pp | tie |
| 5 | 2010-01-05 → 2010-12-31 | 251 | -0.4% | -0.5% | +0.1 pp | Arm A |
| 6 | 2011-01-04 → 2011-12-30 | 251 | +5.7% | -2.6% | +8.3 pp | Arm A |
| 7 | 2012-01-04 → 2012-12-31 | 249 | +2.1% | -2.8% | +4.9 pp | Arm A |
| 8 | 2013-01-03 → 2013-12-31 | 251 | +3.8% | +22.9% | -19.1 pp | Arm B |
| 9 | 2014-01-03 → 2014-12-31 | 251 | +5.6% | +10.4% | -4.8 pp | Arm B |
| 10 | 2015-01-05 → 2015-12-31 | 251 | +11.6% | -4.2% | +15.9 pp | Arm A |
| 11 | 2016-01-05 → 2016-12-30 | 251 | +1.8% | -1.9% | +3.7 pp | Arm A |
| 12 | 2017-01-04 → 2017-12-29 | 250 | +0.0% | +1.0% | -1.0 pp | Arm B |
| 13 | 2018-01-03 → 2018-12-31 | 250 | -3.6% | -11.4% | +7.8 pp | Arm A |
| 14 | 2019-01-03 → 2019-12-31 | 251 | +8.1% | +8.1% | -0.0 pp | tie |
| 15 | 2020-01-03 → 2020-12-31 | 252 | +23.4% | +12.3% | +11.1 pp | Arm A |
| 16 | 2021-01-05 → 2021-12-31 | 251 | +19.3% | +13.0% | +6.3 pp | Arm A |
| 17 | 2022-01-04 → 2022-12-30 | 250 | +12.8% | -1.8% | +14.6 pp | Arm A |
| 18 | 2023-01-04 → 2023-12-29 | 249 | +1.6% | -1.7% | +3.3 pp | Arm A |
| 19 | 2024-01-03 → 2024-12-31 | 251 | +7.0% | +18.6% | -11.6 pp | Arm B |
| 20 | 2025-01-03 → 2025-12-31 | 249 | +3.9% | +2.4% | +1.5 pp | Arm A |
Paired Sharpe of the difference track: 0.10 · block bootstrap (2000 paths, block 10, seed 1234): P(Stressed-market dips beats Every dip) = 69.0%.
Window win-rate. Stressed-market dips led 12 of 20 windows (60.0%), Every dip led 6, and 2 windows were ties, and the mean window gap of +1.40 pp points the same way. Widest single window: 2013 at -19.1 pp.
| Period | Windows | Stressed-market dips | Every dip | Mean gap | Stressed-market dips led |
|---|---|---|---|---|---|
| All windows | 20 | +5.42% | +4.02% | +1.40 pp | 12/20 |
| Before 2010 | 4 | +1.44% | +4.64% | -3.20 pp | 1/4 |
| 2010 onward | 16 | +6.42% | +3.87% | +2.55 pp | 11/16 |
The two eras disagree by 5.75 pp. The pooled figure is therefore not a standing property of either method, it is dominated by the later period. Read the two rows, not the average.
3 The circuit
The strategy is a circuit of platform primitives, frozen when the study is registered. Below is the circuit as wired on the canvas, the objective it encodes and how the search runs through it, followed by the mathematics each primitive actually computes, the same formulas the execution engine runs. The complete parameterisation is preserved in the study ledger (Appendix A).
The sentence below is the registered design with its rules in plain words; the exact registration record is in Appendix A2; the authored description of the design is Section 1.
A COMPARATIVE study: Stressed-market dips vs Every dip, walked on the same registered out-of-sample windows. Stressed-market dips: S&P 500, every member of the index, unranked, bought when the 2-day RSI is below 10; only when the close is above its 200-day average and the VIX closed at or above 20 the session before; sell when the close is above its 5-day average, and forward-tested out-of-sample from the anchor: the rule set is frozen at the anchor, with no in-sample re-optimization. Every dip: S&P 500, every member of the index, unranked, bought when the 2-day RSI is below 10; only when the close is above its 200-day average; sell when the close is above its 5-day average, and forward-tested out-of-sample from the anchor: the rule set is frozen at the anchor, with no in-sample re-optimization. The arms differ in: Signal Module, config (confirm: {2 entries} → {4 entries}). The contrast under test: whether Stressed-market dips generates better risk-adjusted returns than Every dip over the identical out-of-sample windows.
Every block in this study is a card from the platform's catalog: the index, Every Member, the Signal Module with the rule and its confirmations, the forward test that takes dips first come, the cost card and What Happens Next. Nothing was written for this paper. The thresholds, the confirmations, the exit, the slots and the cost are settings on those cards, so a reader can rebuild any of the twelve walks and change any of it.
Envelopes show counts, ratios, dates, and the parameters the author chose. Full price and per-name data series are not republished: the underlying market data is licensed to QuanterLab. Point figures quoted in the prose, a named holding's return over a stated span, are summary facts derived from public market prices, not redistributed series.
The objective and the search
Stressed-market dips
| Universe | S&P 500 index constituents. |
|---|---|
| Selection | every member of the universe, unranked (no screen, no ranking). |
| Signal generation | buy when the 2-day RSI is below 10; only when the close is above its 200-day average and the VIX closed at or above 20 the session before; sell when the close is above its 5-day average. |
| Validation & out-of-sample | signal forward test (1y horizon from the anchor, each position a fixed 1/10 of the book; a position keeps its size to its exit, new signals take free room, share it equally when it is short, and skip the trade when the book is full; up to 520 names priced); overlays: Transaction Cost. |
| Other components | Select: Every Member. |
Every dip
| Signal generation | buy when the 2-day RSI is below 10; only when the close is above its 200-day average; sell when the close is above its 5-day average. |
|---|
Every other specification row is identical to Stressed-market dips's table above.
What differs between the arms, one difference; the comparison is clean:
-
paramSignal Module, config
- · only when: the close is above its 200-day average and the VIX closed at or above 20 the session before (Stressed-market dips); the close is above its 200-day average (Every dip)
Everything else is held identical, so an out-of-sample gap between the arms is attributable to this one change.
Cost elements are wired into the circuit.
Show the mathematics, 6 primitives, formulas and parity notes
3.1 Universe
The starting set of tickers, resolved point-in-time from the index change-log, so names delisted or removed later still compete on the dates they traded.
Before any math, you need a list of stocks. An index preset (S&P 500, Nasdaq-100, Dow 30) is reconstructed as it stood ON your anchor date by replaying the historical add/drop change-log backwards, so a 2018 backtest sees the 2018 membership, not today's winners.
Start from today's constituents and un-apply every membership change after the anchor t:
\mathcal{U}(t) = \mathcal{U}_{\text{now}} \;\ominus\; \{\text{adds after } t\} \;\oplus\; \{\text{drops after } t\}3.2 Every Member
Every name of the universe, unranked.
Passes the whole universe through as survivors, in no order and without a screen. With a point-in-time universe that is the index exactly as it stood at the anchor, so a rule meant to look at every member (every dip, every event) does, and no ranking choice sits between the universe and the signal.
\mathcal{S} = \mathcal{U}(t_0)3.3 Signal Module
The entry / exit rule, turn indicators into a per-bar trade signal.
Composes indicators (RSI, moving averages, …) with comparison and logic operators into a rule that says enter, exit, or hold each bar. The rule is emitted as a portable config the optimizer tunes and the walk-forward validates, so what you design is exactly what gets traded.
\text{signal}_t = \begin{cases} +1 & \text{entry rule true} \\ 0 & \text{exit rule true} \\ \text{hold} & \text{otherwise}\end{cases}3.4 Backtest Validator
Forward-test the winning rule on unseen, out-of-sample data.
Takes the wired rule config (the Walk-Forward validated config wins, else the optimized config, else the raw signal config) and trades it FORWARD on the out-of-sample window to the right of the anchor, data it never saw during optimization, re-deriving the regime as-of each bar. It produces the true out-of-sample equity curve, trades and statistics: the signal-path twin of the Portfolio Forward Test, not an in-sample replay.
E_t = E_{t-1}\,(1 + r_t),\qquad \text{Sharpe} = \frac{\bar r - r_f}{\sigma_r}\sqrt{252}3.5 Transaction Cost
Charge for trading, slippage + commission on every turn.
Real trading isn't free. This deducts a cost proportional to how much you trade (turnover), in basis points, so the backtest reflects net, not gross, performance.
\text{cost}_t = \frac{\text{bps}}{10{,}000}\;\times\;\text{turnover}_t, \qquad \text{turnover}_t = \tfrac12\sum_i \lvert w_{i,t}-w_{i,t^-}\rvert3.6 Event Table
What happens next: every event, and the return that followed it.
Finds every day a rule fires on the names it receives (a new event, not a repeat of yesterday), then measures each event’s return 1, 5, 10 and 20 sessions later, raw and against a benchmark over the same days, bought at the next open or at that day’s close. Up to two split rules divide the events into groups (quiet against loud volume, a stressed market against a calm one), so the table shows which kind of event was followed by what. It trades nothing: it is the evidence under a rule.
r_{i,h} = \frac{P_{i,\,t+h}}{P_{i,\,\text{fill}}} - 1, \qquad x_{i,h} = r_{i,h} - r_{\text{bench},h}\bar r_h,\ \operatorname{median}(r_h),\ \Pr(r_h > 0),\ \bar x_hOnly events inside the window count: the year after the anchor in a walk, or the lookback years before it. A name without prices is listed as unpriced, not dropped without a word. Events close in time are not independent, so read the yearly rows before trusting a small difference.
4 Discussion
4.1 Findings
Most of the bounce is the market's. Twenty trading days after a dip the stock was up just under 1 percent on average, bought at the next open, and only 0.06 of it was ahead of SPY (Table 3).
The every-dip book beats the index before costs. It grew 14.2 percent a year against 8.4 percent for SPY's price (Table 1).
It trades too much for its edge. The book took about 2,480 trades a year, and every trade pays on the way in and on the way out. Each hundredth of a percent on a buy or a sell took about one point of growth a year off it (Figure 3, Table 1). It matches SPY's price at about 0.05 percent a side.
Trading less by what the dip or the stock looked like did not help. Quiet slides cut the trades to about 700 a year and kept less than every dip at every cost (Table 1). Split by the Hurst exponent, the most mean-reverting third did a little better than the most trending third, and neither kept as much as every dip at any cost.
Trading less by when the dip came did better once costs were high. Taking only the dips that came when the VIX had closed at 20 or higher the day before cut the trades by about 70 percent. Before costs the gated book grew less than every dip, because it sat out most calm years. Each hundredth of a percent a side took only about a third of a point a year off it, so above about 0.08 percent a side the order flips: at 0.1 percent it kept 5.1 percent a year against 3.6 (Table 1). It was ahead in twelve years, behind in six and level in two, and the paired test in Table 7 gives it about a seven-in-ten chance of beating every dip, where a coin would give five in ten. Most of its lead came in 2020 to 2022 (Tables 4 and 5). Leave those three years out and the two books grew at the same pace.
The reason is in the dips themselves (Figure 2, Table 3). A dip in a stressed market bounced several times as far as a dip in a calm one, and after twenty days only the stressed dips were ahead of SPY. The dips that pay are the ones bought when few others are buying, which is what Nagel (2012) found for reversal profits.
In calm bull years the gated book sits almost idle. In 2017 the VIX never closed at 20 or higher and it made no trade at all, and in 2013 it made a small part of every dip's gain. In 2022 it gained while every dip and SPY both lost. It did not protect in 2008, when it lost a little more than every dip.
4.2 Interpretation
We turned two knobs. These are the others a practitioner reaches for, and each is a card or a setting on the circuit in the lab.
How deep the dip. A two-day RSI below 10 is a moderate fall. Below 5 takes fewer, deeper dips; a three- or five-day RSI takes slower ones. Deeper dips tend to bounce harder and come less often, which raises the gain per trade and cuts the number of trades.
What confirms it. The 200-day average keeps the rule out of stocks in a long decline. Other confirmations test the story behind the fall: volume against its own average, the share of the fall that came in overnight gaps, the distance from the 52-week high, the state of the market. We tried two of the first kind and found little; the state of the market was the one that mattered here.
When to leave. Selling at the first close above the 5-day average takes the first part of the bounce. Waiting for the RSI to recover to 50 or 70, or holding a fixed number of days, trades less and holds longer, and What Happens Next shows the stressed dips still rising after twenty days.
How big a position. This book asks for a tenth of itself per dip and usually gets far less. Sizing by volatility gives calmer stocks more room; a cap on positions per sector keeps one bad day from filling the book with one industry.
How to fill. We filled at the signal close. Buying at the next open gave back a little of the bounce in our data; a limit order a little below the close buys only the dips that keep falling for a moment, a common practitioner refinement that also changes what the book pays in spread.
What to trade. The same rule on SPY itself trades a few times a year and pays one spread instead of hundreds; on pairs of related stocks it becomes statistical arbitrage, where the dip is measured against a partner instead of the stock's own past (Avellaneda and Lee 2010).
Which side. Everything here is long. The mirror rule, selling spikes, meets the index's long upward drift and pays for borrowing, which is why practitioners mostly keep the short side for hedged books.
Each of these changes the trade count and the gain per trade together, so judge a variation by what it keeps per trade after costs. The reversal the early papers measured has also shrunk as more money trades it: Khandani and Lo (2007) followed a daily reversal strategy of Lehmann's kind and found its returns falling year after year from 1995 to 2007. In our data the every-dip book did not fade: at 0.1 percent a side it grew at about the same pace in the second decade as in the first. The one knob this paper cannot turn for you is your own trading cost.
Enter the lab
The circuit behind every walk is published with this paper: the index, Every Member, the Signal Module with the rule, the forward test, the cost card and What Happens Next. Open it in the lab, change one knob, and walk it forward over the same twenty years. The platform registers your version before it runs and keeps its record next to ours.
4.3 Limitations
Prices are missing for part of the index in the early years. Our vendor has price histories for 345 of the index's members in 2006, rising to 498 by 2021; most of the missing names are companies that later left the index. For a dip buyer that flatters the early years, because the dips that never came back include those of companies that failed. The gate's lead was made in 2020 to 2022, when nearly every member was priced, so the missing names do not drive it.
The book buys at the close that gives the signal. Buying at the next open instead gives back a little of the bounce.
Prices in this paper leave out dividends, for the stocks and for SPY alike. The every-dip book holds stocks most of the year, so it misses close to what SPY misses, about two points a year, and its comparison with SPY's price is close to like for like. The gated book sits in cash most of the year, so it misses less, and its idle cash earns nothing here. Dividends would add more to the every-dip book and interest on cash more to the gated book. Each could move the gap between them at 0.1 percent a side by about a point, in opposite directions.
Costs are a flat share of the traded value. Real costs grow with size and with the speed at which a book buys into a falling market. Read the ladder for its shape. Your own bill depends on your size and your broker.
The VIX level of 20 was fixed from 1990 to 2005, before the walk, and was not tuned on these years. Other levels give other books, and a reader who tries them is running a new search.
The stress design was registered after the first two designs were read, which the family record states and the trial count of twelve covers.
References
- Gelman, A., & Loken, E. (2013). The garden of forking paths: Why multiple comparisons can be a problem, even when there is no “fishing expedition.” Working paper, Columbia University.
- Harvey, C. R., Liu, Y., & Zhu, H. (2016). … and the Cross-Section of Expected Returns. Review of Financial Studies, 29(1), 5–68. doi:10.1093/rfs/hhv059
- Lo, A. W. (2002). The Statistics of Sharpe Ratios. Financial Analysts Journal, 58(4), 36–52. doi:10.2469/faj.v58.n4.2453
- Lehmann (1990), Fads, martingales, and market efficiency, Quarterly Journal of Economics: the losers of one week in US stocks beat the winners the next week.
- Jegadeesh (1990), Evidence of predictable behavior of security returns, Journal of Finance: monthly stock returns reverse in the following month.
- Lo and MacKinlay (1990), When are contrarian profits due to stock market overreaction?, Review of Financial Studies: part of the reversal profit comes from stocks lagging one another.
- Connors and Alvarez (2008), Short Term Trading Strategies That Work: the two-day RSI rule with the 200-day and 5-day averages.
- Nagel (2012), Evaporating liquidity, Review of Financial Studies: short-term reversal profits rise with the VIX; a dip buyer is paid for providing liquidity.
- Khandani and Lo (2007), What happened to the quants in August 2007?, Journal of Investment Management: a daily reversal strategy whose returns fell year after year from 1995 to 2007.
- Avellaneda and Lee (2010), Statistical arbitrage in the US equities market, Quantitative Finance: reversal measured against related stocks.
Appendix A Reproducibility in QuanterLab
Each step is backed by a frozen run report. The study is re-derivable from the ledger below.
| # | Commit | Report | Anchor | OOS window |
|---|---|---|---|---|
| 1 | e92ae6815e59 | 11360 | 2006-01-01 | 2006-01-03 → 2006-12-29 |
| 2 | 079ceae179e5 | 11361 | 2007-01-01 | 2007-01-03 → 2007-12-31 |
| 3 | 4103de442c6f | 11362 | 2008-01-01 | 2008-01-02 → 2008-12-31 |
| 4 | a61c7a0d3c82 | 11363 | 2009-01-01 | 2009-01-02 → 2009-12-31 |
| 5 | b72c96a99dec | 11364 | 2010-01-01 | 2010-01-04 → 2010-12-31 |
| 6 | 1cee65bb8c0d | 11365 | 2011-01-01 | 2011-01-03 → 2011-12-30 |
| 7 | b43994d20996 | 11366 | 2012-01-01 | 2012-01-03 → 2012-12-31 |
| 8 | bb08b6798802 | 11367 | 2013-01-01 | 2013-01-02 → 2013-12-31 |
| 9 | 0b238458bb83 | 11368 | 2014-01-01 | 2014-01-02 → 2014-12-31 |
| 10 | 3772eecfe2df | 11369 | 2015-01-01 | 2015-01-02 → 2015-12-31 |
| 11 | 5785df0d15f3 | 11370 | 2016-01-01 | 2016-01-04 → 2016-12-30 |
| 12 | 9738f836d9da | 11371 | 2017-01-01 | 2017-01-03 → 2017-12-29 |
| 13 | 1a541366eb64 | 11372 | 2018-01-01 | 2018-01-02 → 2018-12-31 |
| 14 | f609049b5520 | 11373 | 2019-01-01 | 2019-01-02 → 2019-12-31 |
| 15 | 54491c680b57 | 11374 | 2020-01-01 | 2020-01-02 → 2020-12-31 |
| 16 | 7a863a9b8901 | 11375 | 2021-01-01 | 2021-01-04 → 2021-12-31 |
| 17 | 8539e1193648 | 11376 | 2022-01-01 | 2022-01-03 → 2022-12-30 |
| 18 | 9b6e4a14a3d3 | 11377 | 2023-01-01 | 2023-01-03 → 2023-12-29 |
| 19 | 96498a58666f | 11378 | 2024-01-01 | 2024-01-02 → 2024-12-31 |
| 20 | 2652dc605a09 | 11379 | 2025-01-01 | 2025-01-02 → 2025-12-31 |
Appendix A2 Registration record
What this record does and does not establish. Every window in this study is historical: the data existed before the study began, so this is sequential registration on past windows, not pre-registration in the clinical-trial sense, and no procedure could make it so. What the platform does enforce is order, each step's specification was frozen and hashed before that step was scored, and the walk cannot advance past a step that was never run or close one with a result registered for a different window. The two timestamp columns below are the evidence: read them together and each registration precedes its own run, and each run precedes the next registration. A study whose registrations all post-date its runs would show it here. Wall-clock spacing between registrations varies with the author's schedule and queue latency; the ordering, not the tempo, is the claim.
“A COMPARATIVE study: Stressed-market dips vs Every dip, walked on the same registered out-of-sample windows. Stressed-market dips: S&P 500, selected by statistical / factor criteria, traded via enter long when RSI (length=2) less than 10; confirmed by BBANDS (length=200, std=2) greater than 0 and VIX (lag=1) ≥ 20; exit when BBANDS (length=5, std=2) greater than 0, and forward-tested out-of-sample from the anchor: the rule set is frozen at the anchor, with no in-sample re-optimization. Every dip: S&P 500, selected by statistical / factor criteria, traded via enter long when RSI (length=2) less than 10; confirmed by BBANDS (length=200, std=2) greater than 0; exit when BBANDS (length=5, std=2) greater than 0, and forward-tested out-of-sample from the anchor: the rule set is frozen at the anchor, with no in-sample re-optimization. The arms differ in: Signal Module, config (confirm: {2 entries} → {4 entries}). The contrast under test: whether Stressed-market dips generates better risk-adjusted returns than Every dip over the identical out-of-sample windows.”
The same hypothesis was registered independently at every step, hashed before each step's out-of-sample window was scored:
| # | Anchor | Registered at (UTC) | Run completed (UTC) |
|---|---|---|---|
| 1 | 2006-01-01 | 2026-09-24 14:47:45 | 2026-09-24 14:49:10 |
| 2 | 2007-01-01 | 2026-09-24 14:49:10 | 2026-09-24 14:51:00 |
| 3 | 2008-01-01 | 2026-09-24 14:51:00 | 2026-09-24 14:52:25 |
| 4 | 2009-01-01 | 2026-09-24 14:52:25 | 2026-09-24 14:53:50 |
| 5 | 2010-01-01 | 2026-09-24 14:53:50 | 2026-09-24 14:55:27 |
| 6 | 2011-01-01 | 2026-09-24 14:55:27 | 2026-09-24 14:56:52 |
| 7 | 2012-01-01 | 2026-09-24 14:56:52 | 2026-09-24 14:58:30 |
| 8 | 2013-01-01 | 2026-09-24 14:58:30 | 2026-09-24 14:59:55 |
| 9 | 2014-01-01 | 2026-09-24 14:59:55 | 2026-09-24 15:01:32 |
| 10 | 2015-01-01 | 2026-09-24 15:01:32 | 2026-09-24 15:03:09 |
| 11 | 2016-01-01 | 2026-09-24 15:03:09 | 2026-09-24 15:04:46 |
| 12 | 2017-01-01 | 2026-09-24 15:04:46 | 2026-09-24 15:06:24 |
| 13 | 2018-01-01 | 2026-09-24 15:06:24 | 2026-09-24 15:08:01 |
| 14 | 2019-01-01 | 2026-09-24 15:08:01 | 2026-09-24 15:09:40 |
| 15 | 2020-01-01 | 2026-09-24 15:09:40 | 2026-09-24 15:11:17 |
| 16 | 2021-01-01 | 2026-09-24 15:11:17 | 2026-09-24 15:12:54 |
| 17 | 2022-01-01 | 2026-09-24 15:12:55 | 2026-09-24 15:14:32 |
| 18 | 2023-01-01 | 2026-09-24 15:14:32 | 2026-09-24 15:16:09 |
| 19 | 2024-01-01 | 2026-09-24 15:16:09 | 2026-09-24 15:17:46 |
| 20 | 2025-01-01 | 2026-09-24 15:17:46 | 2026-09-24 15:19:24 |
Appendix B Per-step diagnostics
Realized in the projection tables below is the risk engine scoring its own forecast: the buy-and-hold return of the segment that followed each rebalance, on the same gross basis the cone was projected on. It is deliberately not the charged, calendar-window total return the study’s tables print, so the two will not reconcile line by line; the cone and its outcome share one basis, which is what a calibration test requires. Each row names its segment’s span so a boundary session is visible.
Names held is the union across the window: the count of distinct instruments the book touched between the window’s first and last session, not the number it held at one time. A book that rotates monthly touches more names than it holds.
What each step's run actually did beyond its return: capital allocation across lanes and regimes, the portfolio book's rebalancing and cost drag, and how positions were sized. Harvested from the frozen run reports, present where the circuit produced them. Cost drag is the gap between the step's return before and after its trading costs, in percentage points of the step's starting capital, so on a book that trades every session and compounds it can exceed the step's own net return.
Open the full per-step grid (20 steps: every rebalance, capital routing and sizing, per window)
Step 1 · 2006-01-03 → 2006-12-29
Position sizing, sizing: equal
Step 2 · 2007-01-03 → 2007-12-31
Position sizing, sizing: equal
Step 3 · 2008-01-02 → 2008-12-31
Position sizing, sizing: equal
Step 4 · 2009-01-02 → 2009-12-31
Position sizing, sizing: equal
Step 5 · 2010-01-04 → 2010-12-31
Position sizing, sizing: equal
Step 6 · 2011-01-03 → 2011-12-30
Position sizing, sizing: equal
Step 7 · 2012-01-03 → 2012-12-31
Position sizing, sizing: equal
Step 8 · 2013-01-02 → 2013-12-31
Position sizing, sizing: equal
Step 9 · 2014-01-02 → 2014-12-31
Position sizing, sizing: equal
Step 10 · 2015-01-02 → 2015-12-31
Position sizing, sizing: equal
Step 11 · 2016-01-04 → 2016-12-30
Position sizing, sizing: equal
Step 12 · 2017-01-03 → 2017-12-29
Position sizing, sizing: equal
Step 13 · 2018-01-02 → 2018-12-31
Position sizing, sizing: equal
Step 14 · 2019-01-02 → 2019-12-31
Position sizing, sizing: equal
Step 15 · 2020-01-02 → 2020-12-31
Position sizing, sizing: equal
Step 16 · 2021-01-04 → 2021-12-31
Position sizing, sizing: equal
Step 17 · 2022-01-03 → 2022-12-30
Position sizing, sizing: equal
Step 18 · 2023-01-03 → 2023-12-29
Position sizing, sizing: equal
Step 19 · 2024-01-02 → 2024-12-31
Position sizing, sizing: equal
Step 20 · 2025-01-02 → 2025-12-31
Position sizing, sizing: equal