
Does Altman’s Z-score formula still tell you anything about today’s S&P 500? Altman’s three zones tested apart
In 1968 Edward Altman took sixty-six manufacturers, half of which had gone bankrupt, and found five numbers from their accounts that together told the two halves apart. His Z-score is still taught, and it is now used for a different job: as a quality screen, a way of choosing which shares to own. The reasoning is easy to follow. A low score means trouble, so a high score should mean a sound company, and sound companies should be good to own.
On the whole US market that reasoning has held: the most distressed companies earned less than the rest. It has not been checked the way the score is used on large companies today. So we ran it on the S&P 500. Every July from 2006 to 2025 we scored every member outside banking and insurance on the accounts the SEC had accepted by that morning, sorted them into Altman's three zones, bought each zone in equal parts and held it for a year. Each zone is set against every scored company in the index, bought the same way in the same year, so the only difference between the two books is the score.
Nothing separates them on returns. Each zone finished ahead of the companies it came from in eight to eleven of the twenty years, which is what a coin does, and the second published form of the score gives the same answer. They came apart in the two worst years, 2008 and the pandemic, when the safe zone fell least and the distress zone most. A reader looking for the zone to own will not find one here.
What the score does sort is the kind of business. In July 2025 about half the distress zone was utilities and property companies: regulated, asset-heavy businesses that borrow on purpose and have kept little of their past profit. The safe zone held the large technology companies. The score reads the shape of a balance sheet, which is what Altman built it to read. In this index that shape is a business model, not a warning.
What the score asks, and what it was built for
The score asks five questions of one balance sheet and one income statement, and each answer is a ratio. How much spare short-term money does the company have, against everything it owns (working capital over assets). How much of its past profit has it kept rather than paid out (retained earnings over assets). How much does the business earn before interest and tax, against what it owns (operating income over assets). What is the stock market's price for the whole company, against what the company owes (market value of equity over total liabilities). And how much does it sell for every dollar of assets it holds (sales over assets).
Altman weighted those five and added them up. Above 2.99 the company sits in what he called the safe zone, below 1.81 in the distress zone, and in between is a grey zone he was explicit about: the formula does not know. Every one of those weights and both of those edges are numbers you can change on the card that computes this; we left them where he published them.
The formula does the job it was built for, and this paper leaves that job alone. It tests the step people take after it: treating the safe zone as a buy list and the distress zone as a list to avoid. That step has been checked on the whole US market, where Dichev (1998) and Campbell, Hilscher and Szilagyi (2008) found the most distressed companies earned less than the rest. It has not been checked the way the score is used on large companies today: on the index as it stood each July, from the statements that were public that morning, held for a year and repeated.
Table 1. The six walks over the twenty windows from July 2006, and the six earlier windows beside them
| Book | Score form | Names, average | Compounded, % a year | Reference compounded, % | Gap compounded, points | Gap in the average year | Years ahead of 20 | Chance it was better, % | Gap, 2000 to 2005 | Years ahead of 6 |
|---|---|---|---|---|---|---|---|---|---|---|
| The safe zone | the 1968 model | 181 | 11.0 | 10.7 | +0.26 | +0.06 | 8 of 20 | 51 | -4.00 | 0 of 6 |
| The grey zone | the 1968 model | 93 | 10.4 | 10.7 | -0.31 | -0.10 | 10 of 20 | 45 | +2.63 | 3 of 6 |
| The distress zone | the 1968 model | 106 | 10.2 | 10.7 | -0.56 | -0.15 | 11 of 20 | 45 | +3.78 | 5 of 6 |
| Z'' the safe zone | the Z'' model | 212 | 10.7 | 10.7 | -0.03 | +0.01 | 9 of 20 | 50 | -1.22 | 3 of 6 |
| Z'' the grey zone | the Z'' model | 99 | 10.8 | 10.7 | +0.06 | +0.00 | 9 of 20 | 50 | +1.43 | 5 of 6 |
| Z'' the distress zone | the Z'' model | 69 | 10.3 | 10.7 | -0.41 | -0.09 | 8 of 20 | 47 | +2.82 | 3 of 6 |
1 Methodology
The universe. The S&P 500's membership on the first of July of each year, rebuilt from the index's own change log, so a company is in a year's test only if it was in the index that morning. The paper's windows are the twenty from July 2006, the anchor every other study on this site uses. The six registered windows before that are reported in Table 1 and Table 3 and claimed nowhere, for the coverage reason the limitations give.
The score. For each company, the statements the SEC had accepted on or before the anchor: the flows over the last four quarters that were public, the balance sheet from the latest of them, and the market value from the anchor's own closing price and the share count on the latest statement. A company whose statements do not carry a line the formula needs is left unscored and counted. Banks and insurers are left unscored by design, because these five ratios do not describe a balance sheet made of loans: 53 of the index in 2006 and 67 in 2025. The scored set grew from 285 companies in July 2006 to 431 in July 2025, mostly as the price record filled in (Table 4).
The books. Three, one per zone, on Altman's published edges, plus the same three on the Z'' form: six registered walks in all. In every window the zone is arm A and every scored company of the same index is arm B, bought the same way on the same morning, so the two arms differ in one thing and it is the cut. That second book is the only ruler this paper uses, and it holds the zone's own names too. An index fund would make a poor ruler here, because it is weighted by company size and holds names this test cannot price.
The trade. Every name in the book bought in equal parts at the anchor close and held to the same day a year later, each dividend reinvested into the company that paid it on its ex-date, ten basis points paid on every name at entry and at exit. A company that stops trading marks at its last close and is sold there. A window holding fewer than ten names would be excluded and counted; none was.
The test. Each walk was registered before it ran: its circuit, its anchors and its claim were written down and frozen first. The platform pairs the two arms day by day inside each window and asks how often the zone was the better book: a seeded block bootstrap over 6,524 paired days of all twenty-six registered windows. One comparison per walk, decided in advance. Table 1 prints a different number, taken over the twenty yearly gaps this paper reads, 20,000 resamples on a fixed seed; the platform's own tables below print the day-by-day one.
Two ways of averaging, kept apart. Compounded means the growth of one dollar through the twenty windows, annualised; the average year is the plain average of the twenty window returns. A book that swings more compounds to less off the same average year, which is why the two disagree, and every gap in this paper says which one it is on. The platform's own tables below cover all twenty-six registered windows and recompute the arms over the days they both traded, so their figures sit above these and are not the same quantity.
2 Results
2.1 Headline
This paper answers for a declared family of 6 sealed studies. 6 member walks are drawn as 12 lines (a comparative walk contributes one line per arm), each chained across its own out-of-sample windows, on one calendar axis, all rebased to 1× on the first session they share. 5 of them are shown to start, the ones the paper reads by; the others are switched off until their name is clicked. The paper’s own walk is the heavy line; the dashed grey line is the study’s own benchmark.
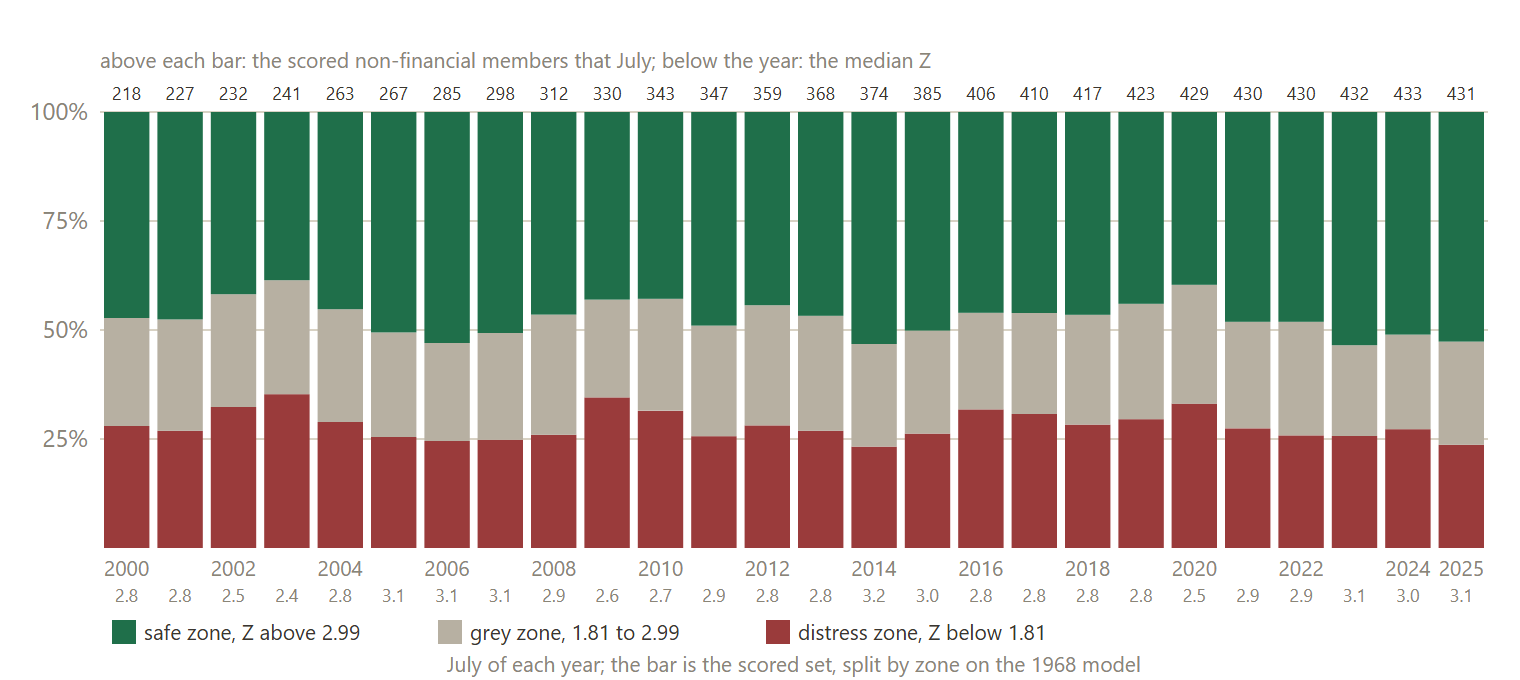
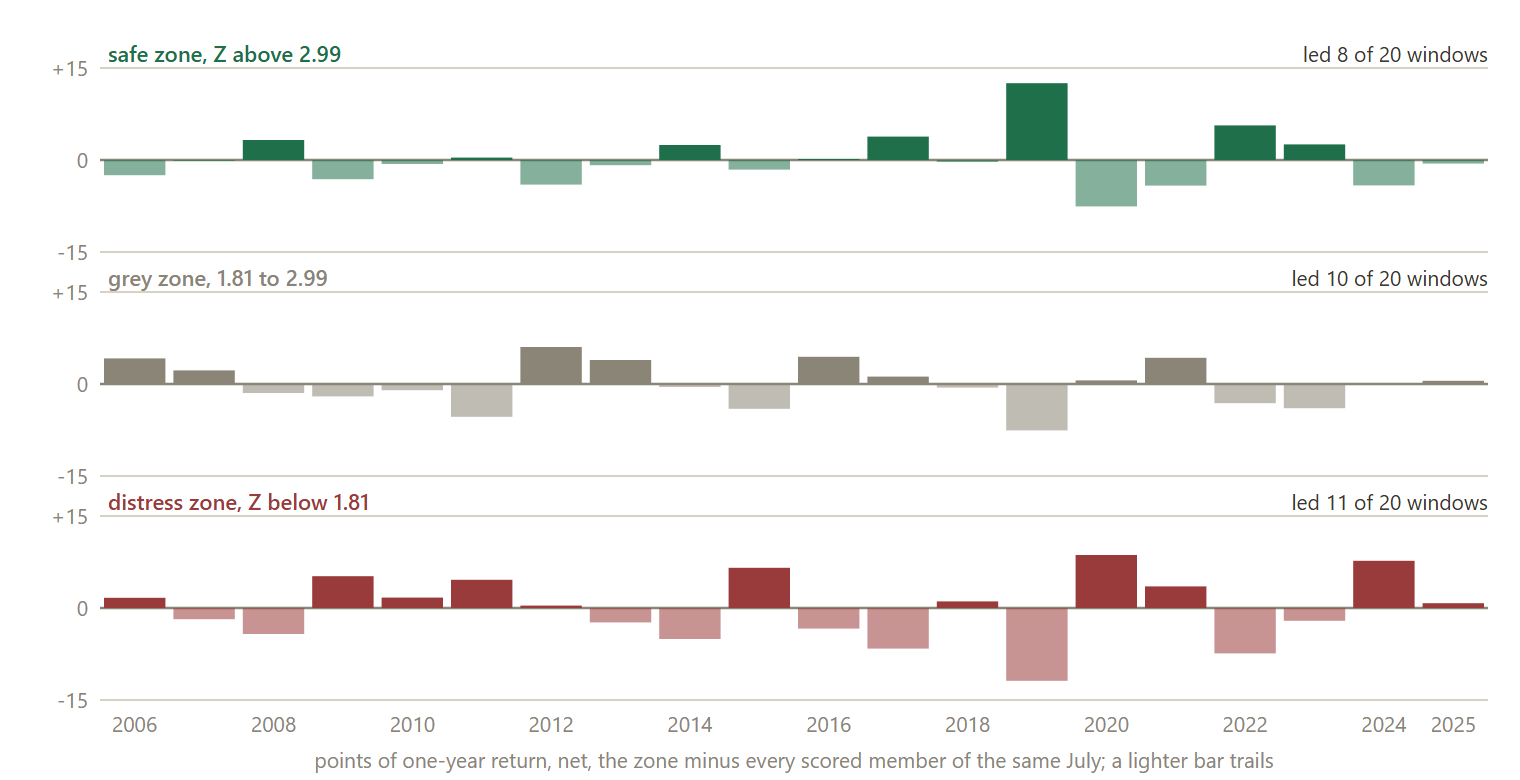
Table 2. What the two ends are made of, at two anchors
| Book | July | Names | Three largest sectors | Three largest names | Market value over debts, typical | Past profit kept, cents per dollar |
|---|---|---|---|---|---|---|
| Safe zone | 2025 | 227 | Tech 60, Industry 48, Health 38 | NVDA, MSFT, AAPL | 5.06 | 51 |
| Distress zone | 2025 | 102 | Utilities 28, Property 21, Retail 11 | T, VZ, BA | 0.89 | 3 |
| Safe zone | 2015 | 193 | Retail 33, Tech 31, Industry 29 | AAPL, GOOGL, GOOG | 3.31 | 46 |
| Distress zone | 2015 | 101 | Utilities 25, Property 16, Energy 11 | GE, AGN, CMCSA | 0.64 | 8 |
Table 3. The gap by stretch: the zone’s return minus every scored company’s, average points a year
| Book | The paper, 2006 to 2025 | First half, 2006 to 2015 | Second half, 2016 to 2025 | Not claimed, 2000 to 2005 |
|---|---|---|---|---|
| Safe zone | +0.1 (8 of 20) | -0.7 (3 of 10) | +0.8 (5 of 10) | -4.0 (0 of 6) |
| Grey zone | -0.1 (10 of 20) | +0.2 (4 of 10) | -0.4 (6 of 10) | +2.6 (3 of 6) |
| Distress zone | -0.1 (11 of 20) | +0.7 (6 of 10) | -1.0 (5 of 10) | +3.8 (5 of 6) |
Table 4. What could be held and what could be scored, every fifth July and the paper’s first
| July | Index members | Priced by the vendor | Scored | Banks and insurers, unscored | Safe / grey / distress | Typical score |
|---|---|---|---|---|---|---|
| 2000 | 488 | 257 | 218 | 39 | 103 54 · 61 | 2.78 |
| 2005 | 491 | 326 | 267 | 51 | 135 64 · 68 | 3.06 |
| 2006 | 492 | 344 | 285 | 53 | 151 64 · 70 | 3.14 |
| 2010 | 494 | 406 | 343 | 56 | 147 88 · 108 | 2.72 |
| 2015 | 495 | 448 | 385 | 58 | 193 91 · 101 | 2.99 |
| 2020 | 499 | 497 | 429 | 68 | 170 117 · 142 | 2.53 |
| 2025 | 498 | 496 | 431 | 67 | 227 102 · 102 | 3.12 |
Table 5. Where each book’s return came from, over the twenty windows from July 2006
| Book | Average year, % | Compounded, % a year | Dividends, points a year | Cost, points a year | Yearly returns, spread in points | Average fall inside a year, % | Fall in the 2008 window, % | Fall in the 2019 window, % | Years ahead of every scored company |
|---|---|---|---|---|---|---|---|---|---|
| Safe zone | 12.08 | 11.0 | 1.4 | 0.22 | 15.4 | -15.2 | -45.0 | -32.1 | 8 of 20 |
| Grey zone | 11.92 | 10.4 | 2.1 | 0.22 | 18.1 | -15.9 | -50.7 | -42.7 | 10 of 20 |
| Distress zone | 11.87 | 10.2 | 3.1 | 0.22 | 19.4 | -15.8 | -53.1 | -42.5 | 11 of 20 |
| Every scored company, the ruler | 12.02 | 10.7 | 2.0 | 0.22 | 16.9 | -15.2 | -48.6 | -37.7 | it is the ruler |
| The index fund (SPY) | 12.23 | 11.1 | in the price | 0.00 | not reported | not reported | not reported | not reported | not comparable |
2.2 Per-step results
| # | Out-of-sample window | The safe zone SR | Every scored member SR |
|---|---|---|---|
| 1 | 2000-07-03 → 2001-06-29 | 0.21 | 0.91 |
| 2 | 2001-07-02 → 2002-07-01 | 0.00 | 0.07 |
| 3 | 2002-07-01 → 2003-07-01 | 0.25 | 0.25 |
| 4 | 2003-07-01 → 2004-06-30 | 1.90 | 2.18 |
| 5 | 2004-07-01 → 2005-07-01 | 0.82 | 1.30 |
| 6 | 2005-07-01 → 2006-06-30 | 1.09 | 1.14 |
| 7 | 2006-07-03 → 2007-06-29 | 1.45 | 1.75 |
| 8 | 2007-07-02 → 2008-06-30 | -0.48 | -0.48 |
| 9 | 2008-07-01 → 2009-07-01 | -0.36 | -0.42 |
| 10 | 2009-07-01 → 2010-07-01 | 1.04 | 1.07 |
| 11 | 2010-07-01 → 2011-07-01 | 2.26 | 2.19 |
| 12 | 2011-07-01 → 2012-06-29 | 0.12 | 0.10 |
| 13 | 2012-07-02 → 2013-07-01 | 1.59 | 1.84 |
| 14 | 2013-07-01 → 2014-07-01 | 2.08 | 2.25 |
| 15 | 2014-07-01 → 2015-07-01 | 0.78 | 0.62 |
| 16 | 2015-07-01 → 2016-06-30 | 0.18 | 0.27 |
| 17 | 2016-07-01 → 2017-06-30 | 1.50 | 1.46 |
| 18 | 2017-07-03 → 2018-06-29 | 1.26 | 1.06 |
| 19 | 2018-07-02 → 2019-07-01 | 0.57 | 0.65 |
| 20 | 2019-07-01 → 2020-06-30 | 0.42 | 0.05 |
| 21 | 2020-07-01 → 2021-07-01 | 2.40 | 2.61 |
| 22 | 2021-07-01 → 2022-07-01 | -0.53 | -0.35 |
| 23 | 2022-07-01 → 2023-06-30 | 1.07 | 0.84 |
| 24 | 2023-07-03 → 2024-06-28 | 1.11 | 0.91 |
| 25 | 2024-07-01 → 2025-07-01 | 0.52 | 0.76 |
| 26 | 2025-07-01 → 2026-07-01 | 1.50 | 1.70 |
2.2b The family, walk by walk
Figure 1 draws these walks; here is every one of them in numbers, the paper’s own walk first and the study’s benchmark last.
| Walk | Windows | Span | Growth | CAGR | Worst drawdown |
|---|---|---|---|---|---|
| safe · The safe zone (this paper) | 20 | 2006-07-03 → 2026-07-01 | +703.0% | +11.0% | -50.4% |
| safe · Every scored member (this paper) | 20 | 2006-07-03 → 2026-07-01 | +666.5% | +10.7% | -53.7% |
| Z'' distress · Z'' the distress zone | 20 | 2006-07-03 → 2026-07-01 | +612.1% | +10.3% | -61.1% |
| Z'' distress · Every scored member, Z'' | 20 | 2006-07-03 → 2026-07-01 | +666.5% | +10.7% | -53.7% |
| Z'' grey · Z'' the grey zone | 20 | 2006-07-03 → 2026-07-01 | +674.2% | +10.8% | -51.5% |
| Z'' grey · Every scored member, Z'' | 20 | 2006-07-03 → 2026-07-01 | +666.5% | +10.7% | -53.7% |
| Z'' safe · Z'' the safe zone | 20 | 2006-07-03 → 2026-07-01 | +662.4% | +10.7% | -53.5% |
| Z'' safe · Every scored member, Z'' | 20 | 2006-07-03 → 2026-07-01 | +666.5% | +10.7% | -53.7% |
| distress · The distress zone | 20 | 2006-07-03 → 2026-07-01 | +592.7% | +10.2% | -58.9% |
| distress · Every scored member | 20 | 2006-07-03 → 2026-07-01 | +666.5% | +10.7% | -53.7% |
| grey · The grey zone | 20 | 2006-07-03 → 2026-07-01 | +625.2% | +10.4% | -54.6% |
| grey · Every scored member | 20 | 2006-07-03 → 2026-07-01 | +666.5% | +10.7% | -53.7% |
| platform reference (SPY) (benchmark) | 2006-07-03 → 2026-07-01 | +717.4% | +11.1% | -55.3% |
Every row above is that walk from 2006-07-01 on, the stretch this paper reads, rebased and recomputed over those windows. The pooled Sharpe is left out here because the compile pooled it over the whole registered walk, earlier windows included; the platform's own tables below carry it.
2.3 Search accounting
This paper's search is a declared family: a declared family, counted at N = 6 evaluated books. Every member is either a registered walk with its own sealed hypothesis and frozen record, or a derived average computed from those frozen records; every member is reported, in the family matrix table and the robustness figure, and none was selected away. The count is declared by the author rather than derived from one project's ledger, because the members are sibling registered studies; the declaration names them and is frozen in this artifact. What the source strategy's author searched before publishing is not knowable from here and is not counted. The registered per-step record below still guarantees each window's hypothesis was hashed and registered before that window was scored.
2.4 The comparison
Both arms trade the same registered windows, so their returns can be PAIRED: inside each window the two return series are inner-joined date by date and the difference rThe safe zone − rEvery scored member is the object under test. Because this is ONE pre-declared contrast, frozen at registration before any window was scored, the paired statistic needs no multiple-testing deflation; the arm-level records carry the declared family count of §2.3 as their search accounting, and this contrast, sealed per window before scoring, is not multiplied by it.
In the table: Arm A = The safe zone · Arm B = Every scored member.
| # | Window | Paired bars | Arm A | Arm B | Δ | Leader |
|---|---|---|---|---|---|---|
| 1 | 2000-07-05 → 2001-06-29 | 250 | +2.2% | +13.1% | -10.9 pp | Arm B |
| 2 | 2001-07-03 → 2002-07-01 | 247 | -1.8% | -0.3% | -1.6 pp | Arm B |
| 3 | 2002-07-02 → 2003-07-01 | 252 | +3.2% | +3.3% | -0.1 pp | Arm B |
| 4 | 2003-07-02 → 2004-06-30 | 251 | +25.8% | +30.9% | -5.2 pp | Arm B |
| 5 | 2004-07-02 → 2005-07-01 | 253 | +10.2% | +15.9% | -5.7 pp | Arm B |
| 6 | 2005-07-05 → 2006-06-30 | 251 | +13.3% | +13.9% | -0.6 pp | Arm B |
| 7 | 2006-07-05 → 2007-06-29 | 249 | +18.0% | +20.5% | -2.5 pp | Arm B |
| 8 | 2007-07-03 → 2008-06-30 | 251 | -11.1% | -10.9% | -0.2 pp | Arm B |
| 9 | 2008-07-02 → 2009-07-01 | 252 | -21.4% | -24.7% | +3.3 pp | Arm A |
| 10 | 2009-07-02 → 2010-07-01 | 252 | +19.8% | +22.9% | -3.1 pp | Arm B |
| 11 | 2010-07-02 → 2011-07-01 | 253 | +38.2% | +38.9% | -0.7 pp | Arm B |
| 12 | 2011-07-05 → 2012-06-29 | 251 | -0.2% | -0.5% | +0.4 pp | Arm A |
| 13 | 2012-07-03 → 2013-07-01 | 249 | +22.1% | +26.2% | -4.0 pp | Arm B |
| 14 | 2013-07-02 → 2014-07-01 | 252 | +25.8% | +26.7% | -0.9 pp | Arm B |
| 15 | 2014-07-02 → 2015-07-01 | 252 | +9.5% | +7.0% | +2.5 pp | Arm A |
| 16 | 2015-07-02 → 2016-06-30 | 252 | +1.7% | +3.3% | -1.6 pp | Arm B |
| 17 | 2016-07-05 → 2017-06-30 | 251 | +14.2% | +14.1% | +0.2 pp | Arm A |
| 18 | 2017-07-05 → 2018-06-29 | 250 | +16.0% | +12.2% | +3.8 pp | Arm A |
| 19 | 2018-07-03 → 2019-07-01 | 250 | +8.2% | +8.5% | -0.3 pp | Arm B |
| 20 | 2019-07-02 → 2020-06-30 | 252 | +8.5% | -4.0% | +12.5 pp | Arm A |
| 21 | 2020-07-02 → 2021-07-01 | 252 | +42.7% | +50.3% | -7.6 pp | Arm B |
| 22 | 2021-07-02 → 2022-07-01 | 252 | -11.9% | -7.7% | -4.2 pp | Arm B |
| 23 | 2022-07-05 → 2023-06-30 | 250 | +20.9% | +15.2% | +5.7 pp | Arm A |
| 24 | 2023-07-05 → 2024-06-28 | 249 | +12.8% | +10.2% | +2.5 pp | Arm A |
| 25 | 2024-07-02 → 2025-07-01 | 250 | +8.0% | +12.1% | -4.1 pp | Arm B |
| 26 | 2025-07-02 → 2026-07-01 | 251 | +22.0% | +22.6% | -0.6 pp | Arm B |
Paired Sharpe of the difference track: -0.16 · block bootstrap (2000 paths, block 10, seed 1234): P(The safe zone beats Every scored member) = 17.7%.
Window win-rate. The safe zone led 8 of 26 windows (30.8%), Every scored member led 18, and the mean window gap of -0.88 pp points the same way. Widest single window: 2019 at +12.5 pp.
| Period | Windows | The safe zone | Every scored member | Mean gap | The safe zone led |
|---|---|---|---|---|---|
| All windows | 26 | +11.41% | +12.29% | -0.88 pp | 8/26 |
| Before 2006 | 6 | +8.80% | +12.80% | -4.00 pp | 0/6 |
| 2006 onward | 20 | +12.19% | +12.14% | +0.06 pp | 8/20 |
The two eras disagree by 4.06 pp. The pooled figure is therefore not a standing property of either method, it is dominated by the earlier period. Read the two rows, not the average.
3 The circuit
The strategy is a circuit of platform primitives, frozen when the study is registered. Below is the circuit as wired on the canvas, the objective it encodes and how the search runs through it, followed by the mathematics each primitive actually computes, the same formulas the execution engine runs. The complete parameterisation is preserved in the study ledger (Appendix A).
The sentence below is the registration record, generated when the circuit was sealed and printed verbatim; the authored description of the design is Section 1.
A COMPARATIVE study: The safe zone vs Every scored member, walked on the same registered out-of-sample windows. The safe zone: S&P 500, evaluated, and run out-of-sample from the anchor: anything the design estimates from history, where it estimates at all, is re-estimated at each anchor from pre-anchor data only, and the walk advances through registered out-of-sample windows; its disposition is the realized forward path versus the benchmark. Every scored member: S&P 500, evaluated, and run out-of-sample from the anchor: anything the design estimates from history, where it estimates at all, is re-estimated at each anchor from pre-anchor data only, and the walk advances through registered out-of-sample windows; its disposition is the realized forward path versus the benchmark. The arms differ in: Score Select, mode: zone → all; Score Select, zone: safe →, . The contrast under test: whether The safe zone generates better risk-adjusted returns than Every scored member over the identical out-of-sample windows.
Every block in this study is a card from the platform’s catalog: the index, the price loader, the statements loader, the Altman score, the cut and the one-year hold. Nothing was written for this paper. The coefficients, both zone edges, the source of operating income and the treatment of banks are parameters on the score card, and the cut is a separate card, so a reader can rebuild any of the six walks and change any of it.
Envelopes show counts, ratios, dates, and the parameters the author chose. Full price and per-name data series are not republished: the underlying market data is licensed to QuanterLab. Point figures quoted in the prose, a named holding's return over a stated span, are summary facts derived from public market prices, not redistributed series.
The objective and the search
The safe zone
| Universe | S&P 500 index constituents. |
|---|---|
| Validation & out-of-sample | held forward test (every wired name bought equal weight at the anchor close and held to the end of the one year window, dividends reinvested on the ex-date, 10 basis points one way at entry and at exit, fewer than 10 names excludes the window, SPY held the same way as the benchmark). |
| Other components | Factor models: Fundamentals Loader (PIT). |
Every scored member
The specification is identical to The safe zone's table above, row for row; the one sealed difference between the arms is itemized below.
What differs between the arms, one manipulated variable, expressed as 2 paired settings on one node:
- paramScore Select, mode: zone → all
- paramScore Select, zone: safe →,
Everything else is held identical, so an out-of-sample gap between the arms is attributable to this one change.
Cost elements are wired into the circuit, the realised drag is reported per step in Appendix B.
Show the mathematics, 7 primitives, formulas and parity notes
3.1 Universe
The starting set of tickers, resolved point-in-time from the index change-log, so names delisted or removed later still compete on the dates they traded.
Before any math, you need a list of stocks. An index preset (S&P 500, Nasdaq-100, Dow 30) is reconstructed as it stood ON your anchor date by replaying the historical add/drop change-log backwards, so a 2018 backtest sees the 2018 membership, not today's winners.
Start from today's constituents and un-apply every membership change after the anchor t:
\mathcal{U}(t) = \mathcal{U}_{\text{now}} \;\ominus\; \{\text{adds after } t\} \;\oplus\; \{\text{drops after } t\}3.2 Price Loader
Bulk OHLCV fetch for the whole universe, point-in-time, no future bars.
Momentum, volatility, trend, every price-based metric needs history. This loads open/high/low/close/volume for all names in parallel, clipped so nothing after the anchor can leak in. The lookback window is derived automatically from the deepest metric you wired.
It loads exactly enough history for the hungriest downstream metric plus a warm-up buffer:
W = \max_k(\text{lookback}_k) + \text{buffer}, \qquad \text{bars} \le \text{anchor } t3.3 Factor Loader
Point-in-time fundamentals, never let the user see a number before the SEC did.
Loads ~23 fundamental metrics (valuation, quality, growth) per name, but with one inviolable rule: a financial statement becomes visible only on or after its SEC acceptedDate. A 2020 backtest sees only what was actually filed by 2020, no look-ahead, ever.
\text{visible}(f, t) \iff \text{acceptedDate}(f) \le t3.4 Factor Altman
Altman's Z: five balance-sheet ratios, weighted, read against two zone edges.
Working capital, retained earnings, operating income and sales each over total assets, plus equity over total liabilities, weighted by Altman’s coefficients into one number. Above the safe edge the company looks far from distress, below the distress edge it looks close to it, between them is the grey zone. Three published forms are offered (the 1968 original with the market value of equity, Z′ for private firms with book equity, Z″ with no sales term) and every coefficient and both edges are yours to change. Banks and insurers are left unscored by default, because these ratios do not describe a balance sheet made of loans.
Z = c_1X_1 + c_2X_2 + c_3X_3 + c_4X_4 + c_5X_5X_1=\frac{\text{working capital}}{\text{assets}},\; X_2=\frac{\text{retained earnings}}{\text{assets}},\; X_3=\frac{\text{EBIT}}{\text{assets}},\; X_4=\frac{\text{equity}}{\text{liabilities}},\; X_5=\frac{\text{sales}}{\text{assets}}\text{zone}(Z)=\begin{cases}\text{distress} & Z < \ell\\ \text{grey} & \ell \le Z \le h\\ \text{safe} & Z > h\end{cases}3.5 Factor Score Select
The cut: turn a score into the book you hold.
Keeps the top N or the bottom N by a named score, or every name above a value, below a value, between two values, an Altman zone, or every scored name (the reference book a study compares a cut against). What it emits is a standard survivors set, so any forward test, portfolio or optimizer downstream takes it.
\{i:\operatorname{rank}(s_i)\le N\},\quad \{i:\operatorname{rank}(-s_i)\le N\},\quad \{i: s_i \ge \ell\},\quad \{i: s_i \le h\},\quad \{i: \ell \le s_i \le h\},\quad \{i: \text{zone}(s_i)\in Z\}3.6 Hold Forward
The one hold every paper used: equal weight at the anchor, held to the end.
Buys every selected name in equal parts at the anchor close and holds to the window’s end, reinvesting each dividend into the paying name on its ex-date, paying a cost once at entry and once at exit. No signal, no rebalance, nothing re-estimated: what it measures is the selection itself. A name that stops trading marks flat at its last close and is sold there; fewer names than the floor excludes the window and says so.
u_i=\frac{C/N \cdot (1-f)}{P_{i,0}},\qquad E_t=\sum_i u_{i,t}P_{i,t}u_{i,t}=u_{i,t^-}\left(1+\frac{D_{i,t}}{P_{i,t}}\right)3.7 Portfolio Forward Autopsy
The post-mortem, where the forward test’s return actually came from.
Runs after the Portfolio Forward Test and dissects its realized path: per-rebalance contributions, winners and losers, exposure and cash periods, and how the realized route compares to what the risk cones projected. It computes nothing new about the future, it explains the past the book just lived.
Depth I–IV: headline attribution, per-segment breakdown, per-name contributions, and the calibration ledger (projected cone vs realized, segment by segment). In a study, this is the node that fills the appendices.
4 Discussion
4.1 Findings
Figure 3 is the result. Each bar is one year: the zone's return that year minus the return of every scored company bought the same way. The bars fall on both sides of the line in all three zones. The safe zone was ahead in eight years of the twenty, the grey zone in ten, the distress zone in eleven.
In the average year the three zones land within a fifth of a point of the companies they came from. Compounded over the whole twenty years the safe zone comes out 0.26 points a year ahead of them, the grey zone 0.31 behind and the distress zone 0.56 behind. That is the same twenty years read a second way, and it favours the steadier book: the distress zone's yearly returns swung the widest and the safe zone's the least (Table 5), and a book that swings more ends a long stretch lower even when its average year is the same. Table 1 prints both ways of averaging for all six walks.
The falls are where the score did sort something, and it took a crash to show it. The two worst years of the twenty were the one beginning in July 2008 and the one beginning in July 2019, and in both the safe zone fell least and the distress zone most, with the companies they came from in between. In 2008 the safe zone was down 45.0 percent at its lowest, the companies it came from 48.6 and the distress zone 53.1; in the pandemic year, 32.1, 37.7 and 42.5 (Table 5). Across all twenty years the order held in seven of them, so this is a crash effect and not a rule of the ordinary years.
What the score does sort is the kind of business, and that part does not move. In July 2025 the safe zone held the large technology companies and most of the healthcare and industrial names, while the distress zone held 28 utilities, 21 property companies and the two large telephone companies. Ten years earlier the same shape: 41 utilities and property companies of 101 names. A company in the distress zone had kept 3 cents of every dollar of assets as past profit against 51 cents in the safe zone (Table 2). It shows up in what the books pay as well: 3.1 points of the distress zone's average year came from dividends against 2.0 for the companies it came from, because utilities and property companies pay them (Table 5).
The registration carries six earlier windows, July 2000 to July 2005, and they say something different: the safe zone 4.0 points a year behind and behind in all six, the distress zone 3.8 points ahead and ahead in five. We do not claim those years, because a book can only hold a company the price record still carries, and in July 2000 that is 257 of the index's 488 members. The record is keyed to a company's current ticker, so what is missing is every 2000 ticker that is not a ticker today: bought, failed and merely renamed alike. The same hole is smaller but still open inside the paper's own window, 30 percent of the index unpriced in 2006 and 9 percent in 2015, so we ran the second half on its own. From 2016 the safe zone is 0.79 points ahead of the companies it came from in the average year, and 0.51 behind with the pandemic year left out. The answer does not change: nothing here sorts returns.
Every step of this ran on cards from the platform's own catalog, in this order: the index, the price loader, the statements loader, the Altman score, the cut and the one-year hold. A reader with an account can put the same six on a canvas, move a zone edge or change a coefficient, and run their own version of any of it, on this index or outside it.
4.2 Interpretation
Used as a buy list on large companies, the three zones earned about what the companies they were drawn from earned, in both published forms of the score, and the one thing the score sorted was how far each fell in a crash.
In a large-cap index the score sorts companies by how their balance sheets are built, not by how likely they are to fail. It puts regulated borrowers at one end and cash-rich technology companies at the other. That is a style, and styles take turns. Anyone using the score as a quality filter is choosing one type of business and calling it a safety measure.
The companies Dichev (1998) and Campbell, Hilscher and Szilagyi (2008) found earning least were small and close to failure, and an index of the five hundred largest holds few of them. Here about half the distress zone is utilities and landlords, which is why the effect they found has little to work on.
This is the second score we have taken apart this way, and the answer has the same shape as the first. Piotroski's nine-signal score, tested on the same index (our earlier paper), also failed to pick winners among large companies, while Piotroski (2000) found it worked among the cheap small companies he built it for. Both scores read the accounts of companies that have already survived the thing the score was built to predict.
What we would test next, and the cards are on the canvas for it: the same six books outside the S&P 500, where a low score is more likely to mean what Altman meant; and the change in a company's score from one year to the next, which is a different question from its level.
This study is one member of a declared search family: the same design walked at several sealed settings across sibling registered projects, every member either a registered walk with its own frozen record or a derived average of those records, and every member reported. The family size is declared by the author and named in the lineage; it is the search-accounting count for this paper. What was searched before the source strategy was published is not knowable from here and is not counted.
4.3 Limitations
Twenty one-year windows is not many. Resampling the yearly gaps puts every one of the six books between 45 and 51 percent likely to have been the better book, which is the range a coin covers. The claim is that the score does not sort returns in this index, and both published forms of it agree on that over twenty years.
The price record is the paper's largest limitation. A book can only hold a company the vendor still carries: 257 of the index's 488 members in July 2000, 317 of 488 in 2003, 344 of 492 in 2006, and from 2020 all but two. Scoring did not cause that gap. In the July 2000 window the whole priced set returned 16.6 percent and the scored part of it 13.2, so scoring lowered the level.
Banks and insurers are left out of both books, 67 of the index in 2025, so this is a test of the score on everything else. One year is the only holding period tested. Nothing is sold short, nothing is fitted or tuned, and the coefficients and both zone edges are Altman's own.
References
- Gelman, A., & Loken, E. (2013). The garden of forking paths: Why multiple comparisons can be a problem, even when there is no “fishing expedition.” Working paper, Columbia University.
- Harvey, C. R., Liu, Y., & Zhu, H. (2016). … and the Cross-Section of Expected Returns. Review of Financial Studies, 29(1), 5–68. doi:10.1093/rfs/hhv059
- Lo, A. W. (2002). The Statistics of Sharpe Ratios. Financial Analysts Journal, 58(4), 36–52. doi:10.2469/faj.v58.n4.2453
- Altman (1968), Financial ratios, discriminant analysis and the prediction of corporate bankruptcy, Journal of Finance: the five ratios and the zones, fitted on 66 manufacturers, 33 of which had filed for bankruptcy, with the safe edge at 2.99 and the distress edge at 1.81.
- Altman (1983), Corporate Financial Distress: the Z′ and Z′′ forms for companies that are not listed manufacturers, the second of which drops the sales term and uses the book value of equity.
- Altman, Iwanicz-Drozdowska, Laitinen and Suvas (2017), Financial distress prediction in an international context, Journal of International Financial Management and Accounting: the score still separates failing from surviving companies across 31 countries, which is the job this paper does not test.
- Piotroski (2000), Value investing: the use of historical financial statement information to separate winners from losers, Journal of Accounting Research: the nine-signal score our earlier paper tested the same way on the same index, and the finding that it worked among the cheap small companies it was built for.
- Dichev (1998), Is the risk of bankruptcy a systematic risk?, Journal of Finance: on the whole US market, the companies this score and Ohlson’s placed closest to failure earned less than the rest.
- Campbell, Hilscher and Szilagyi (2008), In search of distress risk, Journal of Finance: the same result from a different failure model.
Appendix A Reproducibility in QuanterLab
Each step is backed by a frozen run report. The study is re-derivable from the ledger below.
| # | Commit | Report | Anchor | OOS window |
|---|---|---|---|---|
| 1 | badf1e356b60 | 10989 | 2000-07-01 | 2000-07-03 → 2001-06-29 |
| 2 | d65a60207fa3 | 10991 | 2001-07-01 | 2001-07-02 → 2002-07-01 |
| 3 | d4f18d2ad8e5 | 10995 | 2002-07-01 | 2002-07-01 → 2003-07-01 |
| 4 | 1b2f000f29dc | 10997 | 2003-07-01 | 2003-07-01 → 2004-06-30 |
| 5 | ccb776bad49e | 11000 | 2004-07-01 | 2004-07-01 → 2005-07-01 |
| 6 | 7bd91c837c2d | 11005 | 2005-07-01 | 2005-07-01 → 2006-06-30 |
| 7 | 9090115ecea8 | 11006 | 2006-07-01 | 2006-07-03 → 2007-06-29 |
| 8 | eb120068e0ab | 11010 | 2007-07-01 | 2007-07-02 → 2008-06-30 |
| 9 | 8816a89d53cf | 11012 | 2008-07-01 | 2008-07-01 → 2009-07-01 |
| 10 | bd7fbaff1290 | 11017 | 2009-07-01 | 2009-07-01 → 2010-07-01 |
| 11 | 8458f2f80a73 | 11020 | 2010-07-01 | 2010-07-01 → 2011-07-01 |
| 12 | 4a6a152aa59d | 11022 | 2011-07-01 | 2011-07-01 → 2012-06-29 |
| 13 | 5f1d463efdc7 | 11025 | 2012-07-01 | 2012-07-02 → 2013-07-01 |
| 14 | e1116ee0c679 | 11027 | 2013-07-01 | 2013-07-01 → 2014-07-01 |
| 15 | a019a502c7c8 | 11032 | 2014-07-01 | 2014-07-01 → 2015-07-01 |
| 16 | 83ab731f636e | 11035 | 2015-07-01 | 2015-07-01 → 2016-06-30 |
| 17 | e059093fe1c3 | 11038 | 2016-07-01 | 2016-07-01 → 2017-06-30 |
| 18 | c5f7516a3cde | 11040 | 2017-07-01 | 2017-07-03 → 2018-06-29 |
| 19 | eea8f8f59c82 | 11044 | 2018-07-01 | 2018-07-02 → 2019-07-01 |
| 20 | d0ec85215e98 | 11047 | 2019-07-01 | 2019-07-01 → 2020-06-30 |
| 21 | 9bb4aa28e08c | 11050 | 2020-07-01 | 2020-07-01 → 2021-07-01 |
| 22 | 2c8462031286 | 11052 | 2021-07-01 | 2021-07-01 → 2022-07-01 |
| 23 | dfb841c97729 | 11055 | 2022-07-01 | 2022-07-01 → 2023-06-30 |
| 24 | 2252881a69b3 | 11058 | 2023-07-01 | 2023-07-03 → 2024-06-28 |
| 25 | 267d6af413e2 | 11060 | 2024-07-01 | 2024-07-01 → 2025-07-01 |
| 26 | 17cfd2367e62 | 11065 | 2025-07-01 | 2025-07-01 → 2026-07-01 |
Appendix A2 Registration record
What this record does and does not establish. Every window in this study is historical: the data existed before the study began, so this is sequential sealing on past windows, not pre-registration in the clinical-trial sense, and no procedure could make it so. What the platform does enforce is order, each step's specification was frozen and hashed before that step was scored, and the walk cannot advance past a step that was never run or close one with a result registered for a different window. The two timestamp columns below are the evidence: read them together and each seal precedes its own run, and each run precedes the next seal. A study whose seals all post-date its runs would show it here. Wall-clock spacing between seals varies with the author's schedule and queue latency; the ordering, not the tempo, is the claim.
“A COMPARATIVE study: The safe zone vs Every scored member, walked on the same registered out-of-sample windows. The safe zone: S&P 500, evaluated, and run out-of-sample from the anchor: anything the design estimates from history, where it estimates at all, is re-estimated at each anchor from pre-anchor data only, and the walk advances through registered out-of-sample windows; its disposition is the realized forward path versus the benchmark. Every scored member: S&P 500, evaluated, and run out-of-sample from the anchor: anything the design estimates from history, where it estimates at all, is re-estimated at each anchor from pre-anchor data only, and the walk advances through registered out-of-sample windows; its disposition is the realized forward path versus the benchmark. The arms differ in: Score Select, mode: zone → all; Score Select, zone: safe →, . The contrast under test: whether The safe zone generates better risk-adjusted returns than Every scored member over the identical out-of-sample windows.”
The same hypothesis was registered independently at every step, hashed before each step's out-of-sample window was scored:
| # | Anchor | Registered at (UTC) | Run completed (UTC) |
|---|---|---|---|
| 1 | 2000-07-01 | 2026-09-22 06:45:22 | 2026-09-22 07:45:25 |
| 2 | 2001-07-01 | 2026-09-22 07:45:25 | 2026-09-22 07:50:38 |
| 3 | 2002-07-01 | 2026-09-22 07:50:38 | 2026-09-22 07:55:02 |
| 4 | 2003-07-01 | 2026-09-22 07:55:03 | 2026-09-22 08:00:15 |
| 5 | 2004-07-01 | 2026-09-22 08:00:15 | 2026-09-22 08:06:53 |
| 6 | 2005-07-01 | 2026-09-22 08:06:53 | 2026-09-22 08:12:43 |
| 7 | 2006-07-01 | 2026-09-22 08:12:43 | 2026-09-22 08:19:21 |
| 8 | 2007-07-01 | 2026-09-22 08:19:21 | 2026-09-22 08:25:22 |
| 9 | 2008-07-01 | 2026-09-22 08:25:22 | 2026-09-22 08:32:23 |
| 10 | 2009-07-01 | 2026-09-22 08:32:23 | 2026-09-22 08:40:37 |
| 11 | 2010-07-01 | 2026-09-22 08:40:37 | 2026-09-22 08:47:26 |
| 12 | 2011-07-01 | 2026-09-22 08:47:26 | 2026-09-22 08:53:27 |
| 13 | 2012-07-01 | 2026-09-22 08:53:27 | 2026-09-22 09:00:42 |
| 14 | 2013-07-01 | 2026-09-22 09:00:42 | 2026-09-22 09:07:09 |
| 15 | 2014-07-01 | 2026-09-22 09:07:09 | 2026-09-22 09:14:00 |
| 16 | 2015-07-01 | 2026-09-22 09:14:00 | 2026-09-22 09:20:51 |
| 17 | 2016-07-01 | 2026-09-22 09:20:51 | 2026-09-22 09:27:52 |
| 18 | 2017-07-01 | 2026-09-22 09:27:53 | 2026-09-22 09:34:18 |
| 19 | 2018-07-01 | 2026-09-22 09:34:18 | 2026-09-22 09:40:34 |
| 20 | 2019-07-01 | 2026-09-22 09:40:34 | 2026-09-22 09:45:59 |
| 21 | 2020-07-01 | 2026-09-22 09:46:00 | 2026-09-22 09:51:49 |
| 22 | 2021-07-01 | 2026-09-22 09:51:49 | 2026-09-22 09:57:18 |
| 23 | 2022-07-01 | 2026-09-22 09:57:18 | 2026-09-22 10:02:45 |
| 24 | 2023-07-01 | 2026-09-22 10:02:45 | 2026-09-22 10:08:12 |
| 25 | 2024-07-01 | 2026-09-22 10:08:12 | 2026-09-22 10:13:31 |
| 26 | 2025-07-01 | 2026-09-22 10:13:31 | 2026-09-22 10:19:01 |
Appendix B Per-step diagnostics
Realized in the projection tables below is the risk engine scoring its own forecast: the buy-and-hold return of the segment that followed each rebalance, on the same gross basis the cone was projected on. It is deliberately not the charged, calendar-window total return the study’s tables print, so the two will not reconcile line by line; the cone and its outcome share one basis, which is what a calibration test requires. Each row names its segment’s span so a boundary session is visible.
Names held is the union across the window: the count of distinct instruments the book touched between the window’s first and last session, not the number it held at one time. A book that rotates monthly touches more names than it holds.
What each step's run actually did beyond its return: capital allocation across lanes and regimes, the portfolio book's rebalancing and cost drag, and how positions were sized. Harvested from the frozen run reports, present where the circuit produced them. Cost drag is the gap between the step's return before and after its trading costs, in percentage points of the step's starting capital, so on a book that trades every session and compounds it can exceed the step's own net return.
Open the full per-step grid (26 steps: every rebalance, capital routing and sizing, per window)
Step 1 · 2000-07-03 → 2001-06-29
The safe zone
Portfolio book, rebalanced hold · 103 names held · selection: anchor · 3.9% in cash · cost drag 0.204% · 4 names dropped at load (107 selected, 103 held across the window), weights renormalised onto the rest
Every scored member
Portfolio book, rebalanced hold · 218 names held · selection: anchor · 2.3% in cash · cost drag 0.226% · 5 names dropped at load (223 selected, 218 held across the window), weights renormalised onto the rest
Step 2 · 2001-07-02 → 2002-07-01
The safe zone
Portfolio book, rebalanced hold · 108 names held · selection: anchor · 2.8% in cash · cost drag 0.196% · 3 names dropped at load (111 selected, 108 held across the window), weights renormalised onto the rest
Every scored member
Portfolio book, rebalanced hold · 227 names held · selection: anchor · 1.8% in cash · cost drag 0.2% · 4 names dropped at load (231 selected, 227 held across the window), weights renormalised onto the rest
Step 3 · 2002-07-01 → 2003-07-01
The safe zone
Portfolio book, rebalanced hold · 97 names held · selection: anchor · 1.0% in cash · cost drag 0.206% · 1 name dropped at load (98 selected, 97 held across the window), weights renormalised onto the rest
Every scored member
Portfolio book, rebalanced hold · 232 names held · selection: anchor · 2.6% in cash · cost drag 0.207% · 6 names dropped at load (238 selected, 232 held across the window), weights renormalised onto the rest
Step 4 · 2003-07-01 → 2004-06-30
The safe zone
Portfolio book, rebalanced hold · 93 names held · selection: anchor · 4.3% in cash · cost drag 0.252% · 4 names dropped at load (97 selected, 93 held across the window), weights renormalised onto the rest
Every scored member
Portfolio book, rebalanced hold · 241 names held · selection: anchor · 2.9% in cash · cost drag 0.262% · 7 names dropped at load (248 selected, 241 held across the window), weights renormalised onto the rest
Step 5 · 2004-07-01 → 2005-07-01
The safe zone
Portfolio book, rebalanced hold · 119 names held · selection: anchor · 2.5% in cash · cost drag 0.221% · 3 names dropped at load (122 selected, 119 held across the window), weights renormalised onto the rest
Every scored member
Portfolio book, rebalanced hold · 263 names held · selection: anchor · 1.9% in cash · cost drag 0.232% · 5 names dropped at load (268 selected, 263 held across the window), weights renormalised onto the rest
Step 6 · 2005-07-01 → 2006-06-30
The safe zone
Portfolio book, rebalanced hold · 135 names held · selection: anchor · 2.2% in cash · cost drag 0.227% · 3 names dropped at load (138 selected, 135 held across the window), weights renormalised onto the rest
Every scored member
Portfolio book, rebalanced hold · 267 names held · selection: anchor · 2.2% in cash · cost drag 0.228% · 6 names dropped at load (273 selected, 267 held across the window), weights renormalised onto the rest
Step 7 · 2006-07-03 → 2007-06-29
The safe zone
Portfolio book, rebalanced hold · 151 names held · selection: anchor · 1.3% in cash · cost drag 0.236% · 2 names dropped at load (153 selected, 151 held across the window), weights renormalised onto the rest
Every scored member
Portfolio book, rebalanced hold · 285 names held · selection: anchor · 2.5% in cash · cost drag 0.241% · 7 names dropped at load (292 selected, 285 held across the window), weights renormalised onto the rest
Step 8 · 2007-07-02 → 2008-06-30
The safe zone
Portfolio book, rebalanced hold · 151 names held · selection: anchor · 1.3% in cash · cost drag 0.178% · 2 names dropped at load (153 selected, 151 held across the window), weights renormalised onto the rest
Every scored member
Portfolio book, rebalanced hold · 298 names held · selection: anchor · 1.3% in cash · cost drag 0.178% · 4 names dropped at load (302 selected, 298 held across the window), weights renormalised onto the rest
Step 9 · 2008-07-01 → 2009-07-01
The safe zone
Portfolio book, rebalanced hold · 145 names held · selection: anchor · 2.1% in cash · cost drag 0.157% · 3 names dropped at load (148 selected, 145 held across the window), weights renormalised onto the rest
Every scored member
Portfolio book, rebalanced hold · 312 names held · selection: anchor · 1.6% in cash · cost drag 0.151% · 5 names dropped at load (317 selected, 312 held across the window), weights renormalised onto the rest
Step 10 · 2009-07-01 → 2010-07-01
The safe zone
Portfolio book, rebalanced hold · 142 names held · selection: anchor · 1.4% in cash · cost drag 0.24% · 2 names dropped at load (144 selected, 142 held across the window), weights renormalised onto the rest
Every scored member
Portfolio book, rebalanced hold · 330 names held · selection: anchor · 0.9% in cash · cost drag 0.246% · 3 names dropped at load (333 selected, 330 held across the window), weights renormalised onto the rest
Step 11 · 2010-07-01 → 2011-07-01
The safe zone
Portfolio book, rebalanced hold · 147 names held · selection: anchor · 2.0% in cash · cost drag 0.277% · 3 names dropped at load (150 selected, 147 held across the window), weights renormalised onto the rest
Every scored member
Portfolio book, rebalanced hold · 343 names held · selection: anchor · 0.9% in cash · cost drag 0.278% · 3 names dropped at load (346 selected, 343 held across the window), weights renormalised onto the rest
Step 12 · 2011-07-01 → 2012-06-29
The safe zone
Portfolio book, rebalanced hold · 170 names held · selection: anchor · 1.2% in cash · cost drag 0.2% · 2 names dropped at load (172 selected, 170 held across the window), weights renormalised onto the rest
Every scored member
Portfolio book, rebalanced hold · 347 names held · selection: anchor · 0.9% in cash · cost drag 0.199% · 3 names dropped at load (350 selected, 347 held across the window), weights renormalised onto the rest
Step 13 · 2012-07-02 → 2013-07-01
The safe zone
Portfolio book, rebalanced hold · 159 names held · selection: anchor · 0.6% in cash · cost drag 0.244% · 1 name dropped at load (160 selected, 159 held across the window), weights renormalised onto the rest
Every scored member
Portfolio book, rebalanced hold · 359 names held · selection: anchor · 0.3% in cash · cost drag 0.252% · 1 name dropped at load (360 selected, 359 held across the window), weights renormalised onto the rest
Step 14 · 2013-07-01 → 2014-07-01
The safe zone
Portfolio book, rebalanced hold · 172 names held · selection: anchor · 0.6% in cash · cost drag 0.252% · 1 name dropped at load (173 selected, 172 held across the window), weights renormalised onto the rest
Every scored member
Portfolio book, rebalanced hold · 368 names held · selection: anchor · 0.3% in cash · cost drag 0.253% · 1 name dropped at load (369 selected, 368 held across the window), weights renormalised onto the rest
Step 15 · 2014-07-01 → 2015-07-01
The safe zone
Portfolio book, rebalanced hold · 199 names held · selection: anchor · 1.0% in cash · cost drag 0.219% · 2 names dropped at load (201 selected, 199 held across the window), weights renormalised onto the rest
Every scored member
Portfolio book, rebalanced hold · 374 names held · selection: anchor · 0.5% in cash · cost drag 0.214% · 2 names dropped at load (376 selected, 374 held across the window), weights renormalised onto the rest
Step 16 · 2015-07-01 → 2016-06-30
The safe zone
Portfolio book, rebalanced hold · 193 names held · selection: anchor · 0.5% in cash · cost drag 0.204% · 1 name dropped at load (194 selected, 193 held across the window), weights renormalised onto the rest
Every scored member
Portfolio book, rebalanced hold · 385 names held · selection: anchor · 0.5% in cash · cost drag 0.207% · 2 names dropped at load (387 selected, 385 held across the window), weights renormalised onto the rest
Step 17 · 2016-07-01 → 2017-06-30
The safe zone
Portfolio book, rebalanced hold · 187 names held · selection: anchor · 0.5% in cash · cost drag 0.229% · 1 name dropped at load (188 selected, 187 held across the window), weights renormalised onto the rest
Every scored member
Portfolio book, rebalanced hold · 406 names held · selection: anchor · 0.5% in cash · cost drag 0.228% · 2 names dropped at load (408 selected, 406 held across the window), weights renormalised onto the rest
Step 18 · 2017-07-03 → 2018-06-29
The safe zone
Portfolio book, rebalanced hold · 189 names held · selection: anchor · 0.5% in cash · cost drag 0.232% · 1 name dropped at load (190 selected, 189 held across the window), weights renormalised onto the rest
Every scored member
Portfolio book, rebalanced hold · 410 names held · selection: anchor · 0.2% in cash · cost drag 0.224% · 1 name dropped at load (411 selected, 410 held across the window), weights renormalised onto the rest
Step 19 · 2018-07-02 → 2019-07-01
The safe zone
Portfolio book, rebalanced hold · 194 names held · selection: anchor · 0.0% in cash · cost drag 0.217%
Every scored member
Portfolio book, rebalanced hold · 417 names held · selection: anchor · 0.0% in cash · cost drag 0.217%
Step 20 · 2019-07-01 → 2020-06-30
The safe zone
Portfolio book, rebalanced hold · 186 names held · selection: anchor · 0.0% in cash · cost drag 0.217%
Every scored member
Portfolio book, rebalanced hold · 423 names held · selection: anchor · 0.0% in cash · cost drag 0.192%
Step 21 · 2020-07-01 → 2021-07-01
The safe zone
Portfolio book, rebalanced hold · 170 names held · selection: anchor · 0.0% in cash · cost drag 0.286%
Every scored member
Portfolio book, rebalanced hold · 429 names held · selection: anchor · 0.2% in cash · cost drag 0.301% · 1 name dropped at load (430 selected, 429 held across the window), weights renormalised onto the rest
Step 22 · 2021-07-01 → 2022-07-01
The safe zone
Portfolio book, rebalanced hold · 207 names held · selection: anchor · 0.0% in cash · cost drag 0.176%
Every scored member
Portfolio book, rebalanced hold · 430 names held · selection: anchor · 0.0% in cash · cost drag 0.185%
Step 23 · 2022-07-01 → 2023-06-30
The safe zone
Portfolio book, rebalanced hold · 207 names held · selection: anchor · 0.5% in cash · cost drag 0.242% · 1 name dropped at load (208 selected, 207 held across the window), weights renormalised onto the rest
Every scored member
Portfolio book, rebalanced hold · 430 names held · selection: anchor · 0.5% in cash · cost drag 0.231% · 2 names dropped at load (432 selected, 430 held across the window), weights renormalised onto the rest
Step 24 · 2023-07-03 → 2024-06-28
The safe zone
Portfolio book, rebalanced hold · 231 names held · selection: anchor · 0.0% in cash · cost drag 0.226%
Every scored member
Portfolio book, rebalanced hold · 432 names held · selection: anchor · 0.0% in cash · cost drag 0.221%
Step 25 · 2024-07-01 → 2025-07-01
The safe zone
Portfolio book, rebalanced hold · 221 names held · selection: anchor · 0.0% in cash · cost drag 0.216%
Every scored member
Portfolio book, rebalanced hold · 433 names held · selection: anchor · 0.2% in cash · cost drag 0.224% · 1 name dropped at load (434 selected, 433 held across the window), weights renormalised onto the rest
Step 26 · 2025-07-01 → 2026-07-01
The safe zone
Portfolio book, rebalanced hold · 227 names held · selection: anchor · 0.4% in cash · cost drag 0.244% · 1 name dropped at load (228 selected, 227 held across the window), weights renormalised onto the rest
Every scored member
Portfolio book, rebalanced hold · 431 names held · selection: anchor · 0.5% in cash · cost drag 0.245% · 2 names dropped at load (433 selected, 431 held across the window), weights renormalised onto the rest