

Which tech companies spend more on building than their business brings in? Every S&P 500 tech company, checked each April since 2000
Before the dot-com crash, the telecom companies building the internet's networks spent more on buildings and equipment than their businesses brought in, and borrowed or sold shares to pay the difference. Our thirty-year study of the tech industry found that their spending passed their own cash in 2000, and within two years they had cut it in half. Today's AI giants spend a similar share of their sales, but so far they pay for it from their own cash.
This paper checks every tech company in the S&P 500, every April since the dot-com peak: is it stepping up its spending, and is that spending more than its business brings in? As the crash unfolded, ten, then eleven of about seventy companies did both. For the last twenty years it has never been more than three, and this April it is three: Sandisk, Lumentum and Oracle. Microsoft, Alphabet and Meta still pay their own way, and Amazon is close to the edge.
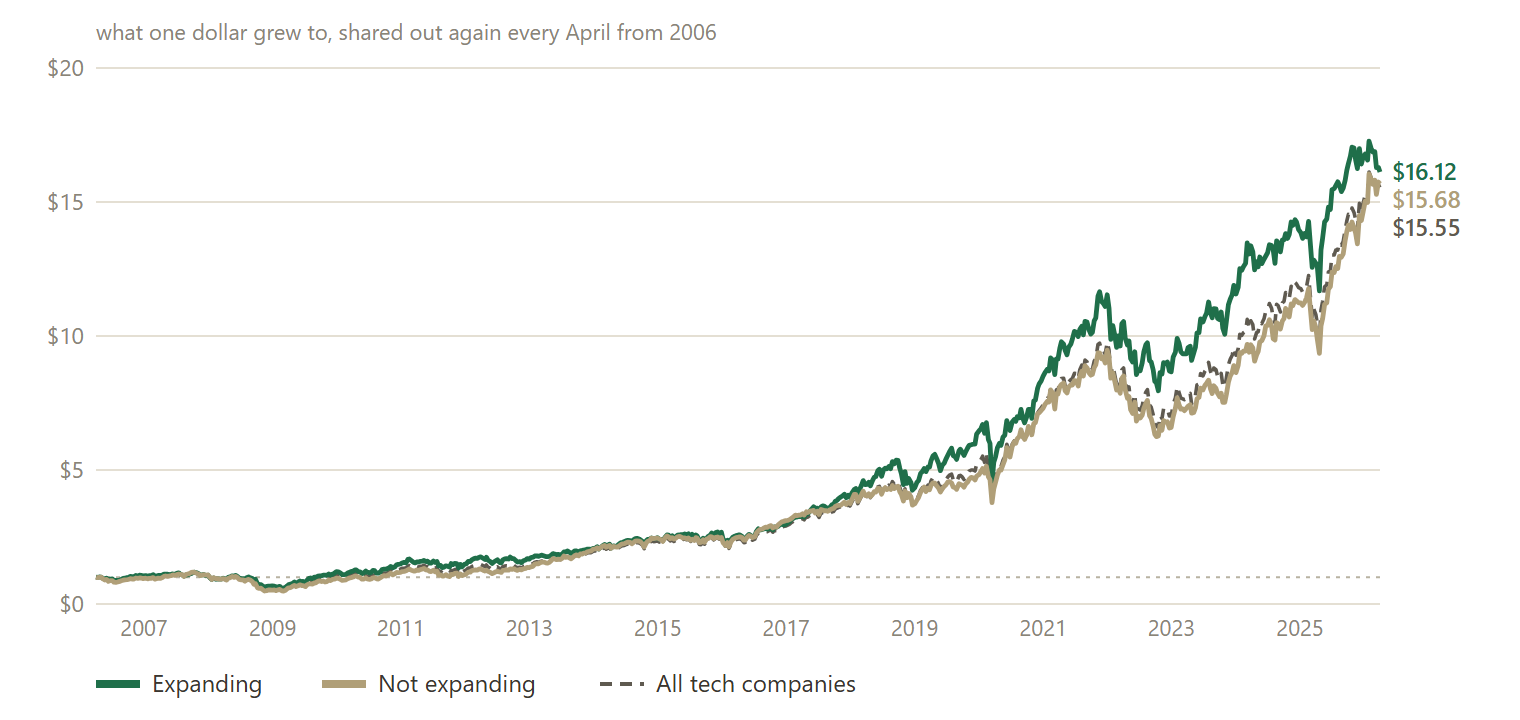
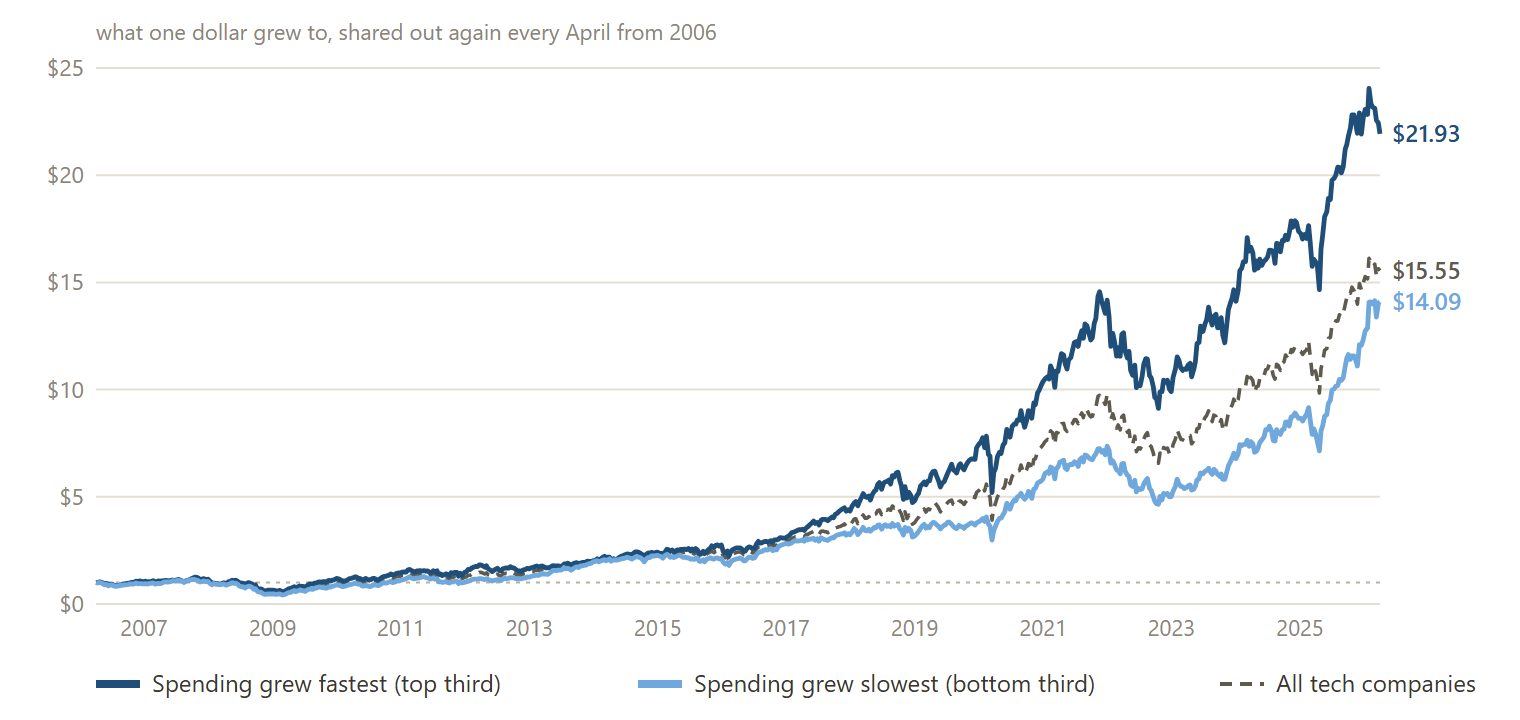
Spending more did not hurt shareholders. The companies stepping up their spending did as well as the others, and the fastest spenders did better than the slowest. The usual worry about the AI giants is how much they spend. This check watches who pays.
Why we did this
Our thirty-year study of the tech industry followed what the biggest US tech companies spent on buildings, equipment and data centres. Today's four AI giants, Microsoft, Alphabet, Meta and Amazon, put about 22 cents of every sales dollar into building, close to the telecom companies' 24 cents at the same stage of the dot-com boom. The telecom companies borrowed to build; so far the AI giants pay from their own cash.
The study added up whole groups, but an investor owns single companies. So this paper asks the question company by company: who spends more on building than its business brings in, and did it matter for the shareholders? We also tested a worry in today's news, that the AI giants are raising their spending too fast. We expected that in this industry fast-rising spending goes with growth.
How we checked
Two numbers from each company's annual report are enough: what it spent on buildings and equipment, and the cash its business brought in. If the spending is smaller, the company pays for its growth itself, and we call it self-funded. If it is larger, the rest came from loans, new shares or savings. Apple in 2001 is an example: its business brought in 185 million dollars and it spent 232 million, so it was not self-funded.
We count a company when it is also expanding: spending more on buildings and equipment than the year before, and a bigger share of its sales, as the telecom companies did. Intel spends more than its cash, but it cut its spending this year, so it is not counted.
Every April we used only the reports each company had filed by then, so the check sees what an investor could have seen. The check leaves out power companies and the companies that rent out towers and data-centre space, which borrow to build every year whatever the business is doing.
To see what it meant for shareholders, each April we put the same amount into every company of a group and held it for a year. The returns start in 2006: before that our price data misses too many of the companies that disappeared in the crash.
Before reading any result we wrote down eight tests, most of them a group against all the tech companies. After reading them we added the two pairs in Figures 2 and 3, each group against its opposite, and they agree with the eight. Every test is in the full record, and every detail in the methodology.
Who spent more than their business brought in
Figure 1 shows the count every April. In the two years after the dot-com peak it rose to ten, then eleven companies, among them WorldCom and Nortel, which failed, and Apple, Verizon and Comcast, which came through. Annual reports come out months after the year they describe, so the count trails share prices by about a year.
It fell back after the crash and has stayed low, usually one company a year. This April it is three (Table 1): Sandisk, whose business brought in almost no cash last year; Lumentum; and Oracle, which tripled its spending to build data centres for its cloud business. Of the AI giants, Amazon comes closest, spending 94 cents for every dollar its business brings in; Meta, Alphabet and Microsoft spend well below their cash.
Two things could make the AI giants look safer than they are. Some of their newest reports are months old, and equipment they lease or computing power they rent is not counted. Both would move them closer to the edge.
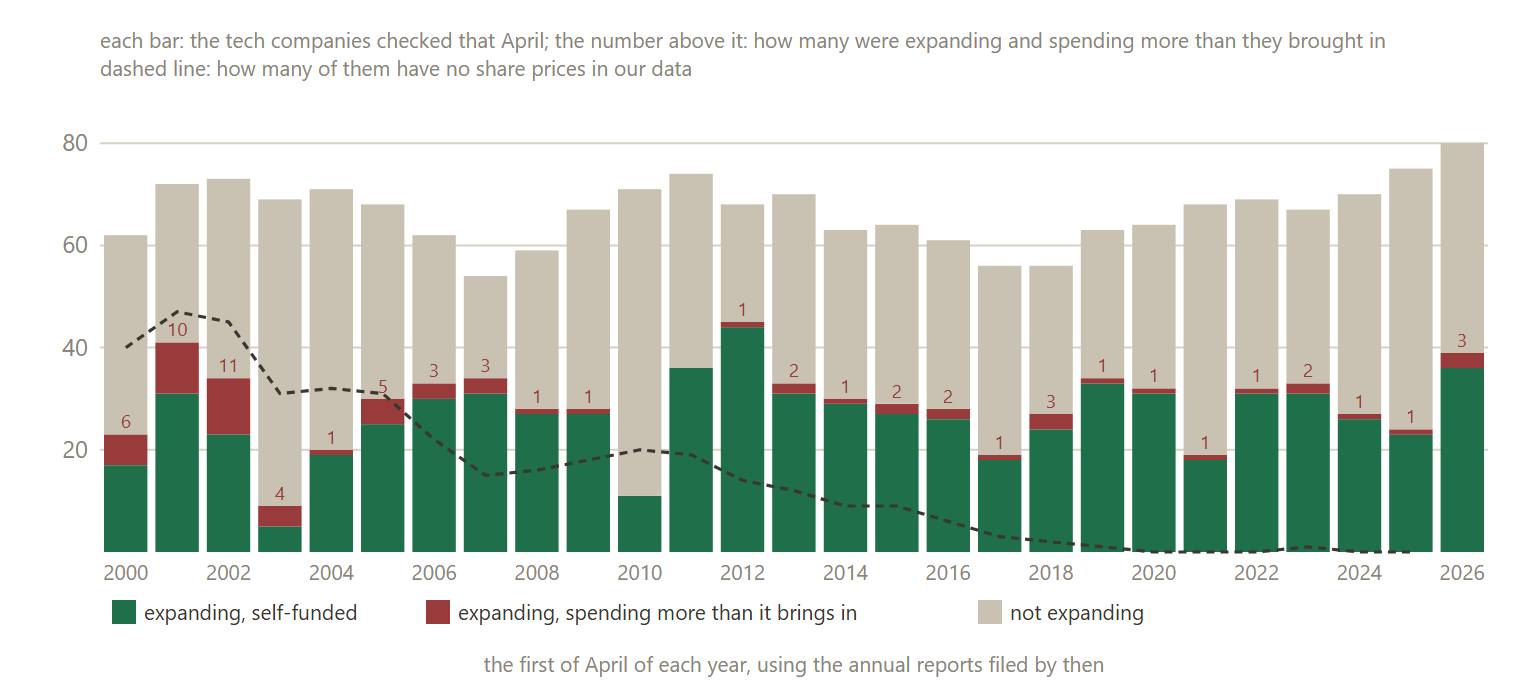
Table 1. This April: what each company spends on buildings and equipment for every dollar of cash its business brings in. The three companies expanding beyond that cash, the four biggest AI spenders, Micron and Nvidia, which sell them chips, and Intel, which spends more than its cash but is not expanding.
| Company | Business | Annual report filed | Spends per dollar brought in | Spending change on the year | Where it stands |
|---|---|---|---|---|---|
| Sandisk | chips and computers | Aug 2025 | 2.43 dollars | +23% | spending more than it brings in |
| Lumentum | network and data-centre equipment | Aug 2025 | 1.83 dollars | +74% | spending more than it brings in |
| Oracle | business software | Jun 2025 | 1.02 dollars | +209% | spending more than it brings in |
| Amazon | internet platforms | Feb 2026 | 94 cents | +59% | expanding, self-funded |
| Micron Technology | chips and computers | Oct 2025 | 90 cents | +89% | expanding, self-funded |
| Meta Platforms | internet platforms | Jan 2026 | 60 cents | +87% | expanding, self-funded |
| Alphabet | internet platforms | Feb 2026 | 56 cents | +74% | expanding, self-funded |
| Microsoft | business software | Jul 2025 | 47 cents | +45% | expanding, self-funded |
| Nvidia | chips and computers | Feb 2026 | 6 cents | +87% | expanding, self-funded |
| Intel | chips and computers | Jan 2026 | 1.51 dollars | -39% | not expanding |
1 Methodology, in detail (click to open)
1 Methodology
Who is checked. A company is checked in an April if it was in the S&P 500 that day and belongs to one of the thirty-year study's five tech groups, except the five that rent out towers and data-centre space (American Tower, Crown Castle, SBA Communications, Equinix and Digital Realty). A company that changed its legal form counts once (Google and Alphabet, for example). The old AT&T, bought in 2005, has no share prices but is in the counts.
The figures. Capital spending is the entry in the cash flow statement called purchases of property, plant and equipment; the cash the business brought in is the cash from operations. Every figure is the one first reported, including the ones we read by hand from the original reports. A company whose report lacks a figure is left out that April, and counted as left out. A company whose business lost cash counts as not self-funded. Expanding means capital spending rose on the year, and faster than sales.
Timing. Each April uses the latest annual report a company had filed by then, as long as the year it covers ended within the last fifteen months. A company whose financial year ends within days of the first of April is left out that April. This April, Microsoft's latest report ends in June 2025 and Oracle's in May 2025, so up to ten months of their newest spending is not in these figures.
The return tests. Each April the same amount goes into each company of a group, held for a year with dividends reinvested, paying 0.1 percent to buy and 0.1 percent to sell. Seven tests were written down and dated before the first one ran: the self-funded expanding companies against all the tech companies; the expanding companies spending more than their business brings in against all the tech companies, and against the self-funded ones; all the tech companies without them; the companies not expanding; and the fastest-growing spenders, whole and split by who pays. An eighth, holding every company spending more than its business brings in even alone, was added after the seven ran and before any result was read. The two pairs, expanding against not expanding and the fastest third against the slowest, were added on 23 September 2026, after the first eight results had been read, with the same rules, companies and years.
The fastest and slowest spenders are the top and bottom thirds of the companies ranked each April by how much their capital spending grew over the year, ties broken by ticker. A group needs ten companies to be held, or three for the companies spending more than they bring in; in a year with fewer, that test skips the year. The test on this page skipped 2000, 2003 and 2004, when fewer than ten expanding companies had share prices. The fastest third is held in two of the tests, run two days apart; the dividend records of Amphenol and Lam Research were updated in between, so it ends at 21.92 dollars in one and 21.93 in the other.
Share prices. Our price data does not carry companies that no longer trade. Before 2006 over 40 percent of the companies checked each April have no prices; we picked 2006 from this price record, as the first April when about two in three have them. From 2007 about three in four have prices and from 2017 nearly all. The companies without prices are left out of both sides of every test, and not evenly: in 2006 about half the expanding companies had no prices against a fifth of the others, and in 2010 it went the other way. The counts include every company, priced or not.
The results in numbers, from 2006. A dollar in all the tech companies grew to 15.55. In the eight tests written down first, the self-funded expanding companies and the companies not expanding each ended within 13 cents of it, and the fastest third reached 21.92; the tests that needed three or more companies spending beyond their cash, with share prices, could read only one April. In the two pairs, the expanding companies fell 53 percent from their 2007 high to the low of November 2008, the others 64; the fastest and slowest thirds earned about the same in an average year, 19.8 percent against 18.9, the fastest third did better in eleven of the twenty years and lost 29 percent over the year from April 2008 against the slowest third's 44. In the last year the companies not expanding gained 52 percent against 27, led by Western Digital, Seagate, Lam Research and KLA. All the tech companies can end below both groups because companies move between the two every April and the groups change size.
Company by company. From 2006 a company was counted 28 times in all, some companies more than once. Of those, 23 have share prices: in 12 the company did better over the next year than the self-funded expanding companies of its own kind, in 11 worse, and the middle case was about two points ahead. The five without prices, Gateway, CA twice, Sprint and Yahoo, were all later taken over by other companies.
The Sharpe ratio on the card is the average daily return divided by how much the daily returns swung, scaled to a year, with no deduction for the interest cash would have earned. Every group is compared with its opposite and with all the tech companies bought the same way, not with the S&P 500 index fund, which puts more money into the biggest companies and holds companies our tests cannot price.
Changes after the rules were written. April 2026 can only be a count, because its year is not over. A second reading of the figures after the tests ran changed three companies in 2003 and 2005, before the returns start; the counts here use the corrected figures.
2 Results
2.1 Headline
Sections 2.2 to 3, the full record: every year, every test, and how each one was run (click to open)
Table 2. Every April from 2000 to 2012: the expanding companies spending more than their business brought in
| April | Companies checked | Expanding | Spending more than they bring in | Which ones | and | No share prices |
|---|---|---|---|---|---|---|
| 2000 | 62 | 23 | 6 | CPQ LU S SFA SLR old AT&T | 40 | |
| 2001 | 72 | 41 | 10 | ANDW AV CMCSK CNXT GLW JBL NT VZ | old AT&T WCOM | 47 |
| 2002 | 73 | 34 | 11 | AAPL AWE CMCSK GLW MU NVLS Q S SBL | VIAV VTSS | 45 |
| 2003 | 69 | 9 | 4 | AMD NTAP Q SBL | 31 | |
| 2004 | 71 | 20 | 1 | NVDA | 32 | |
| 2005 | 68 | 30 | 5 | ADCT AMD ANDW MXIM SLR | 31 | |
| 2006 | 62 | 33 | 3 | AMCC CA GTW | 22 | |
| 2007 | 54 | 34 | 3 | AMD CA SANM | 15 | |
| 2008 | 59 | 28 | 1 | MU | 16 | |
| 2009 | 67 | 28 | 1 | NVDA | 18 | |
| 2010 | 71 | 11 | 0 | 20 | ||
| 2011 | 74 | 36 | 0 | 19 | ||
| 2012 | 68 | 45 | 1 | MU | 14 |
Table 3. Every April from 2013 to 2026: the expanding companies spending more than their business brought in
| April | Companies checked | Expanding | Spending more than they bring in | Which ones | and | No share prices |
|---|---|---|---|---|---|---|
| 2013 | 70 | 33 | 2 | AMZN S | 12 | |
| 2014 | 63 | 30 | 1 | AMZN | 9 | |
| 2015 | 64 | 29 | 2 | AMZN NFLX | 9 | |
| 2016 | 61 | 28 | 2 | NFLX YHOO | 6 | |
| 2017 | 56 | 19 | 1 | MU | 3 | |
| 2018 | 56 | 27 | 3 | AMD AMZN NFLX | 2 | |
| 2019 | 63 | 34 | 1 | AMD | 1 | |
| 2020 | 64 | 32 | 1 | NFLX | 0 | |
| 2021 | 68 | 19 | 1 | TMUS | 0 | |
| 2022 | 69 | 32 | 1 | AMZN | 0 | |
| 2023 | 67 | 33 | 2 | DISH INTC | 1 | |
| 2024 | 70 | 27 | 1 | INTC | 0 | |
| 2025 | 75 | 24 | 1 | SMCI | 0 | |
| 2026 | 80 | 39 | 3 | LITE ORCL SNDK |
2.2 Per-step results
| # | Out-of-sample window | Expanding SR | Not expanding SR |
|---|---|---|---|
| 1 | excluded: refused, no history | , | , |
| 2 | 2001-04-02 → 2002-04-01 | 0.31 | 0.42 |
| 3 | 2002-04-01 → 2003-04-01 | -0.77 | -0.78 |
| 4 | excluded: refused, no history | , | , |
| 5 | excluded: refused, no history | , | , |
| 6 | 2005-04-01 → 2006-03-31 | 1.83 | 1.46 |
| 7 | 2006-04-03 → 2007-03-30 | 0.41 | -0.24 |
| 8 | 2007-04-02 → 2008-03-31 | -0.43 | -0.00 |
| 9 | 2008-04-01 → 2009-04-01 | -0.44 | -0.74 |
| 10 | 2009-04-01 → 2010-04-01 | 2.34 | 2.35 |
| 11 | 2010-04-01 → 2011-04-01 | 1.21 | 1.25 |
| 12 | 2011-04-01 → 2012-03-30 | 0.58 | 0.24 |
| 13 | 2012-04-02 → 2013-04-01 | 0.17 | 1.17 |
| 14 | 2013-04-01 → 2014-04-01 | 1.73 | 2.39 |
| 15 | 2014-04-01 → 2015-04-01 | 0.76 | 0.76 |
| 16 | 2015-04-01 → 2016-03-31 | 0.36 | 0.30 |
| 17 | 2016-04-01 → 2017-03-31 | 1.61 | 2.12 |
| 18 | 2017-04-03 → 2018-03-29 | 1.78 | 1.12 |
| 19 | 2018-04-02 → 2019-04-01 | 0.97 | 0.66 |
| 20 | 2019-04-01 → 2020-03-31 | 0.10 | -0.02 |
| 21 | 2020-04-01 → 2021-04-01 | 2.46 | 2.64 |
| 22 | 2021-04-01 → 2022-04-01 | 0.56 | 0.28 |
| 23 | 2022-04-01 → 2023-03-31 | -0.05 | -0.19 |
| 24 | 2023-04-03 → 2024-03-28 | 1.80 | 1.60 |
| 25 | 2024-04-01 → 2025-04-01 | -0.17 | 0.43 |
| 26 | 2025-04-01 → 2026-04-01 | 1.03 | 1.64 |
2.2b Every test, in numbers
Every test this paper registered, two rows each, the paper’s own test first.
| Walk | Windows | Span | Growth | CAGR | Worst drawdown |
|---|---|---|---|---|---|
| Expanding, against not expanding (this paper) | 20 | 2006-04-03 → 2026-04-01 | +1512.2% | +14.9% | -53.0% |
| Not expanding, against expanding (this paper) | 20 | 2006-04-03 → 2026-04-01 | +1468.1% | +14.8% | -64.4% |
| Expanding, spending more than they bring in, three or more held, against the self-funded | 1 | 2018-04-02 → 2019-04-01 | +79.6% | +79.9% | -43.0% |
| Expanding, self-funded, against those spending more than they bring in | 1 | 2018-04-02 → 2019-04-01 | +13.6% | +13.7% | -22.7% |
| Spending more than they bring in, one company in most years (not a portfolio), against the self-funded | 18 | 2006-04-03 → 2026-04-01 | +216.3% | +5.9% | -88.5% |
| Expanding, self-funded, against each company spending more than it brings in | 18 | 2006-04-03 → 2026-04-01 | +968.9% | +12.6% | -51.1% |
| Expanding, spending more than they bring in, three or more held, against all tech companies | 1 | 2018-04-02 → 2019-04-01 | +79.6% | +79.9% | -43.0% |
| All tech companies, against those spending more than they bring in | 1 | 2018-04-02 → 2019-04-01 | +16.5% | +16.5% | -23.1% |
| Expanding, self-funded, against all tech companies | 20 | 2006-04-03 → 2026-04-01 | +1449.1% | +14.7% | -51.1% |
| All tech companies, against the expanding self-funded | 20 | 2006-04-03 → 2026-04-01 | +1454.7% | +14.7% | -58.3% |
| All tech companies except those spending more than they bring in, against all | 20 | 2006-04-03 → 2026-04-01 | +1424.2% | +14.6% | -57.3% |
| All tech companies, against all except those spending more than they bring in | 20 | 2006-04-03 → 2026-04-01 | +1454.7% | +14.7% | -58.3% |
| Fastest third of spenders, against all tech companies | 20 | 2006-04-03 → 2026-04-01 | +2091.8% | +16.7% | -58.7% |
| All tech companies, against the fastest third | 20 | 2006-04-03 → 2026-04-01 | +1454.7% | +14.7% | -58.3% |
| Fastest third, spending more than they bring in, against the fastest third self-funded | 1 | 2018-04-02 → 2019-04-01 | +79.6% | +79.9% | -43.0% |
| Fastest third, self-funded, against the fastest third spending more than they bring in | 1 | 2018-04-02 → 2019-04-01 | +10.8% | +10.8% | -23.4% |
| Fastest third of spenders, against the slowest third | 20 | 2006-04-03 → 2026-04-01 | +2093.4% | +16.7% | -58.7% |
| Slowest third of spenders, against the fastest third | 20 | 2006-04-03 → 2026-04-01 | +1309.1% | +14.1% | -66.0% |
| Not expanding, against all tech companies | 20 | 2006-04-03 → 2026-04-01 | +1467.6% | +14.8% | -64.4% |
| All tech companies, against those not expanding | 20 | 2006-04-03 → 2026-04-01 | +1454.7% | +14.7% | -58.3% |
Every row above is that walk from 2006-04-01 on, the stretch this paper reads, rebased and recomputed over those windows. The pooled Sharpe is left out here because the compile pooled it over the whole registered walk, earlier windows included; the platform's own tables below carry it.
Growth and CAGR above are each walk over its own windows, so they are not comparable across walks with different window counts: a walk that excluded a window did not live through it. The figure rebases every line on the session all of them share.
2.3 Search accounting
This paper's search is a declared family: the paper's ten tests, counted at N = 10 evaluated books. Every member is either a registered walk with its own hypothesis and frozen record, or a derived average computed from those frozen records; every member is reported, in the family matrix table and the robustness figure, and none was selected away. The count is declared by the author rather than derived from one project's ledger, because the members are sibling registered studies; the declaration names them and is frozen in this artifact. What the source strategy's author searched before publishing is not knowable from here and is not counted. The registered per-step record below still guarantees each window's hypothesis was hashed and registered before that window was scored.
2.4 The comparison
Both arms trade the same registered windows, so their returns can be PAIRED: inside each window the two return series are inner-joined date by date and the difference rExpanding − rNot expanding is the object under test. Because this is ONE pre-declared contrast, frozen at registration before any window was scored, the paired statistic needs no multiple-testing deflation; the arm-level records carry the declared family count of §2.3 as their search accounting, and this contrast, registered per window before scoring, is not multiplied by it.
| # | Window | Paired bars | Expanding | Not expanding | Δ | Leader |
|---|---|---|---|---|---|---|
| 2 | 2001-04-03 → 2002-04-01 | 246 | +4.4% | +8.9% | -4.5 pp | Not expanding |
| 3 | 2002-04-02 → 2003-04-01 | 253 | -40.6% | -31.8% | -8.8 pp | Not expanding |
| 6 | 2005-04-04 → 2006-03-31 | 252 | +34.4% | +23.0% | +11.5 pp | Expanding |
| 7 | 2006-04-04 → 2007-03-30 | 249 | +5.8% | -5.3% | +11.1 pp | Expanding |
| 8 | 2007-04-03 → 2008-03-31 | 250 | -10.8% | -2.7% | -8.1 pp | Not expanding |
| 9 | 2008-04-02 → 2009-04-01 | 253 | -26.4% | -37.3% | +10.9 pp | Expanding |
| 10 | 2009-04-02 → 2010-04-01 | 252 | +75.8% | +72.0% | +3.8 pp | Expanding |
| 11 | 2010-04-05 → 2011-04-01 | 253 | +29.2% | +28.6% | +0.5 pp | Expanding |
| 12 | 2011-04-04 → 2012-03-30 | 251 | +12.4% | +2.8% | +9.7 pp | Expanding |
| 13 | 2012-04-03 → 2013-04-01 | 248 | +1.5% | +19.2% | -17.8 pp | Not expanding |
| 14 | 2013-04-02 → 2014-04-01 | 253 | +24.7% | +41.3% | -16.6 pp | Not expanding |
| 15 | 2014-04-02 → 2015-04-01 | 252 | +11.1% | +10.5% | +0.6 pp | Expanding |
| 16 | 2015-04-02 → 2016-03-31 | 251 | +5.5% | +3.9% | +1.6 pp | Expanding |
| 17 | 2016-04-04 → 2017-03-31 | 252 | +27.2% | +34.1% | -6.9 pp | Not expanding |
| 18 | 2017-04-04 → 2018-03-29 | 249 | +31.4% | +17.3% | +14.1 pp | Expanding |
| 19 | 2018-04-03 → 2019-04-01 | 251 | +21.3% | +12.2% | +9.1 pp | Expanding |
| 20 | 2019-04-02 → 2020-03-31 | 252 | -3.1% | -4.8% | +1.8 pp | Expanding |
| 21 | 2020-04-02 → 2021-04-01 | 252 | +84.7% | +91.4% | -6.7 pp | Not expanding |
| 22 | 2021-04-05 → 2022-04-01 | 253 | +10.8% | +3.7% | +7.1 pp | Expanding |
| 23 | 2022-04-04 → 2023-03-31 | 250 | -5.9% | -9.0% | +3.1 pp | Expanding |
| 24 | 2023-04-04 → 2024-03-28 | 248 | +37.0% | +27.9% | +9.1 pp | Expanding |
| 25 | 2024-04-02 → 2025-04-01 | 251 | -4.8% | +6.9% | -11.7 pp | Not expanding |
| 26 | 2025-04-02 → 2026-04-01 | 251 | +26.9% | +52.1% | -25.2 pp | Not expanding |
Paired Sharpe of the difference track: -0.00 · block bootstrap (2000 paths, block 10, seed 1234): P(Expanding beats Not expanding) = 49.8%.
Window win-rate. Expanding led 14 of 23 windows (60.9%), Not expanding led 9, yet the mean window gap runs the other way: -0.54 pp toward Not expanding. Expanding wins more often and smaller; Not expanding wins less often and larger. The count and the mean answer different questions, and neither settles the comparison by itself. Widest single window: 2025 at -25.2 pp.
| Period | Windows | Expanding | Not expanding | Mean gap | Expanding led |
|---|---|---|---|---|---|
| All windows | 23 | +15.32% | +15.86% | -0.54 pp | 14/23 |
| Before 2006 | 3 | -0.60% | +0.02% | -0.62 pp | 1/3 |
| 2006 onward | 20 | +17.71% | +18.23% | -0.52 pp | 13/20 |
Incomplete walk. 26 steps were registered and 23 produced a scored window. No run was recorded for step 1 (anchor 2000-04-01), step 4 (anchor 2003-04-01), step 5 (anchor 2004-04-01). That window is absent from this table and from every average on this page, the comparison covers 23 of 26 registered periods, not all of them.
3 The circuit
The strategy is a circuit of platform primitives, frozen when the study is registered. Below is the circuit as wired on the canvas, the objective it encodes and how the search runs through it, followed by the mathematics each primitive actually computes, the same formulas the execution engine runs. The complete parameterisation is preserved in the study ledger (Appendix A).
The sentence below is the registration record, generated when the circuit was registered and printed verbatim; the authored description of the design is Section 1.
A COMPARATIVE study: Expanding vs Not expanding, walked on the same registered out-of-sample windows. Expanding: S&P 500, bought equal weight at the anchor close and held a year, and run out-of-sample from the anchor: anything the design estimates from history, where it estimates at all, is re-estimated at each anchor from pre-anchor data only, and the walk advances through registered out-of-sample windows; its disposition is the realized forward path versus the benchmark. Not expanding: S&P 500, bought equal weight at the anchor close and held a year, and run out-of-sample from the anchor: anything the design estimates from history, where it estimates at all, is re-estimated at each anchor from pre-anchor data only, and the walk advances through registered out-of-sample windows; its disposition is the realized forward path versus the benchmark. The arms differ in: Capex line book (PIT), book: builders → rest. The contrast under test: whether Expanding generates better risk-adjusted returns than Not expanding over the identical out-of-sample windows.
Two building blocks were written for this study, the way a user writes one on the desktop: one sorts the companies each April by the two questions, the other holds a group for a year. They read a table built from our thirty-year study's figures and the SEC's filing dates. The S&P 500 membership comes with the platform.
Envelopes show counts, ratios, dates, and the parameters the author chose. Full price and per-name data series are not republished: the underlying market data is licensed to QuanterLab. Point figures quoted in the prose, a named holding's return over a stated span, are summary facts derived from public market prices, not redistributed series.
The objective and the search
Expanding
| Universe | S&P 500 index constituents. |
|---|---|
| Validation & out-of-sample | held forward test (every wired name bought equal weight at the anchor close and held to the end of the one-year window, dividends reinvested on the ex-date, 10.0 basis points one way at entry and at exit, every name's own return reported). |
| Other components | Study: Capex line book (PIT), Hold the book a year. |
Not expanding
The specification is identical to Expanding's table above, row for row; the one registered difference between the arms is itemized below.
What differs between the arms, one difference; the comparison is clean:
- paramCapex line book (PIT), book: builders → rest
Everything else is held identical, so an out-of-sample gap between the arms is attributable to this one change.
Cost elements are wired into the circuit, the realised drag is reported per step in Appendix B.
Show the mathematics, 2 primitives, formulas and parity notes
3.1 Universe
The starting set of tickers, resolved point-in-time from the index change-log, so names delisted or removed later still compete on the dates they traded.
Before any math, you need a list of stocks. An index preset (S&P 500, Nasdaq-100, Dow 30) is reconstructed as it stood ON your anchor date by replaying the historical add/drop change-log backwards, so a 2018 backtest sees the 2018 membership, not today's winners.
Start from today's constituents and un-apply every membership change after the anchor t:
\mathcal{U}(t) = \mathcal{U}_{\text{now}} \;\ominus\; \{\text{adds after } t\} \;\oplus\; \{\text{drops after } t\}3.2 Portfolio Forward Autopsy
The post-mortem, where the forward test’s return actually came from.
Runs after the Portfolio Forward Test and dissects its realized path: per-rebalance contributions, winners and losers, exposure and cash periods, and how the realized route compares to what the risk cones projected. It computes nothing new about the future, it explains the past the book just lived.
Depth I–IV: headline attribution, per-segment breakdown, per-name contributions, and the calibration ledger (projected cone vs realized, segment by segment). In a study, this is the node that fills the appendices.
4 Discussion
4.1 Findings
Stepping up spending did not hurt shareholders. The expanding companies did as well as the others (Figure 2), ahead for most of the way until the companies that had held their spending back, disk-drive and chip-equipment makers such as Western Digital and Seagate, caught up in the last year.
The fastest spenders did better than the slowest, and pulled away in the second half (Figure 3).
Company by company, the few that spent beyond their cash did about as well as the self-funded ones.
4.2 Interpretation
Across the whole US market, companies that invest the most have tended to earn less afterwards, one of the best-known findings in finance (Titman, Wei and Xie, 2004; Fama and French, 2015). Among the largest tech companies it went the other way. The fastest spenders were often the fastest growers too, and our reading is that in this industry fast-rising spending has mostly been what growth requires.
What to watch is who pays. The telecom companies ran past their own cash before their spending collapsed. The AI giants still pay their own way; if they join the three companies counted this April, the count will be the highest since the crash.
Every step of this check is saved on QuanterLab, where anyone can open it, change a rule and run it again as the new reports come in.
4.3 Limitations
The returns include only companies with share prices, and spending is what each company reports, without leases or rented computing power.
The fastest spenders were often the fastest growers by sales, and this test cannot tell which of the two did the work.
References
- Gelman, A., & Loken, E. (2013). The garden of forking paths: Why multiple comparisons can be a problem, even when there is no “fishing expedition.” Working paper, Columbia University.
- Harvey, C. R., Liu, Y., & Zhu, H. (2016). … and the Cross-Section of Expected Returns. Review of Financial Studies, 29(1), 5–68. doi:10.1093/rfs/hhv059
- Lo, A. W. (2002). The Statistics of Sharpe Ratios. Financial Analysts Journal, 58(4), 36–52. doi:10.2469/faj.v58.n4.2453
- Girgin, Serhat (2026), Thirty Years of the Technology Industry, From Dot-Com to ChatGPT: Its Strong Stories and Their Relation to Capital Expenditure, SSRN, https://ssrn.com/abstract=7507181, doi:10.2139/ssrn.7507181: the study this paper checks company by company, with its groups, its stories and the figures published with it.
- Titman, Wei and Xie (2004), Capital investments and stock returns, Journal of Financial and Quantitative Analysis: across the US market, companies that sharply increased their capital investment earned lower returns in the years after.
- Fama and French (2015), A five-factor asset pricing model, Journal of Financial Economics: across the US market, companies whose assets grew fastest earned less than those whose assets grew slowest, the investment factor of the model.
Appendix A Reproducibility in QuanterLab
Each step is backed by a frozen run report. The study is re-derivable from the ledger below.
| # | Commit | Report | Anchor | OOS window |
|---|---|---|---|---|
| 1 | 2c712323695c | 11147 | 2000-04-01 | , |
| 2 | 2c572d4564ba | 11149 | 2001-04-01 | 2001-04-02 → 2002-04-01 |
| 3 | 871a2264b001 | 11151 | 2002-04-01 | 2002-04-01 → 2003-04-01 |
| 4 | 343cd1f5ac89 | 11153 | 2003-04-01 | , |
| 5 | 40eb7103a3a4 | 11155 | 2004-04-01 | , |
| 6 | 843fdbe02273 | 11157 | 2005-04-01 | 2005-04-01 → 2006-03-31 |
| 7 | b19fc6bc0473 | 11159 | 2006-04-01 | 2006-04-03 → 2007-03-30 |
| 8 | f34b1b7b50c8 | 11161 | 2007-04-01 | 2007-04-02 → 2008-03-31 |
| 9 | e619f153abe0 | 11163 | 2008-04-01 | 2008-04-01 → 2009-04-01 |
| 10 | 692cb071861c | 11165 | 2009-04-01 | 2009-04-01 → 2010-04-01 |
| 11 | 087c97ec327c | 11167 | 2010-04-01 | 2010-04-01 → 2011-04-01 |
| 12 | 2e8b2e44fdb6 | 11169 | 2011-04-01 | 2011-04-01 → 2012-03-30 |
| 13 | 371223af4fce | 11171 | 2012-04-01 | 2012-04-02 → 2013-04-01 |
| 14 | 002f5d7e4031 | 11173 | 2013-04-01 | 2013-04-01 → 2014-04-01 |
| 15 | 3c36da036f5b | 11175 | 2014-04-01 | 2014-04-01 → 2015-04-01 |
| 16 | 526742bf8cd4 | 11177 | 2015-04-01 | 2015-04-01 → 2016-03-31 |
| 17 | 4058cb7db215 | 11179 | 2016-04-01 | 2016-04-01 → 2017-03-31 |
| 18 | 5258d0785b3e | 11181 | 2017-04-01 | 2017-04-03 → 2018-03-29 |
| 19 | 3209ae593fb3 | 11183 | 2018-04-01 | 2018-04-02 → 2019-04-01 |
| 20 | 7cc40a250898 | 11185 | 2019-04-01 | 2019-04-01 → 2020-03-31 |
| 21 | 99e211cfc291 | 11187 | 2020-04-01 | 2020-04-01 → 2021-04-01 |
| 22 | 9a99debcedfe | 11189 | 2021-04-01 | 2021-04-01 → 2022-04-01 |
| 23 | 2e345986a591 | 11191 | 2022-04-01 | 2022-04-01 → 2023-03-31 |
| 24 | 8e005ebece98 | 11193 | 2023-04-01 | 2023-04-03 → 2024-03-28 |
| 25 | b6a6d21dcfd0 | 11195 | 2024-04-01 | 2024-04-01 → 2025-04-01 |
| 26 | 5b4cc6c8a3eb | 11197 | 2025-04-01 | 2025-04-01 → 2026-04-01 |
Appendix A2 Registration record
What this record does and does not establish. Every window in this study is historical: the data existed before the study began, so this is sequential registration on past windows, not pre-registration in the clinical-trial sense, and no procedure could make it so. What the platform does enforce is order, each step's specification was frozen and hashed before that step was scored, and the walk cannot advance past a step that was never run or close one with a result registered for a different window. The two timestamp columns below are the evidence: read them together and each registration precedes its own run, and each run precedes the next registration. A study whose registrations all post-date its runs would show it here. Wall-clock spacing between registrations varies with the author's schedule and queue latency; the ordering, not the tempo, is the claim.
“A COMPARATIVE study: Expanding vs Not expanding, walked on the same registered out-of-sample windows. Expanding: S&P 500, bought equal weight at the anchor close and held a year, and run out-of-sample from the anchor: anything the design estimates from history, where it estimates at all, is re-estimated at each anchor from pre-anchor data only, and the walk advances through registered out-of-sample windows; its disposition is the realized forward path versus the benchmark. Not expanding: S&P 500, bought equal weight at the anchor close and held a year, and run out-of-sample from the anchor: anything the design estimates from history, where it estimates at all, is re-estimated at each anchor from pre-anchor data only, and the walk advances through registered out-of-sample windows; its disposition is the realized forward path versus the benchmark. The arms differ in: Capex line book (PIT), book: builders → rest. The contrast under test: whether Expanding generates better risk-adjusted returns than Not expanding over the identical out-of-sample windows.”
The same hypothesis was registered independently at every step, hashed before each step's out-of-sample window was scored:
| # | Anchor | Registered at (UTC) | Run completed (UTC) |
|---|---|---|---|
| 1 | 2000-04-01 | 2026-09-23 12:32:19 | 2026-09-23 12:32:43 |
| 2 | 2001-04-01 | 2026-09-23 12:32:43 | 2026-09-23 12:32:55 |
| 3 | 2002-04-01 | 2026-09-23 12:32:55 | 2026-09-23 12:33:07 |
| 4 | 2003-04-01 | 2026-09-23 12:33:07 | 2026-09-23 12:33:19 |
| 5 | 2004-04-01 | 2026-09-23 12:33:19 | 2026-09-23 12:33:31 |
| 6 | 2005-04-01 | 2026-09-23 12:33:31 | 2026-09-23 12:33:43 |
| 7 | 2006-04-01 | 2026-09-23 12:33:43 | 2026-09-23 12:33:55 |
| 8 | 2007-04-01 | 2026-09-23 12:33:55 | 2026-09-23 12:34:08 |
| 9 | 2008-04-01 | 2026-09-23 12:34:08 | 2026-09-23 12:34:20 |
| 10 | 2009-04-01 | 2026-09-23 12:34:20 | 2026-09-23 12:34:32 |
| 11 | 2010-04-01 | 2026-09-23 12:34:32 | 2026-09-23 12:34:44 |
| 12 | 2011-04-01 | 2026-09-23 12:34:44 | 2026-09-23 12:34:56 |
| 13 | 2012-04-01 | 2026-09-23 12:34:56 | 2026-09-23 12:35:08 |
| 14 | 2013-04-01 | 2026-09-23 12:35:08 | 2026-09-23 12:35:20 |
| 15 | 2014-04-01 | 2026-09-23 12:35:20 | 2026-09-23 12:35:32 |
| 16 | 2015-04-01 | 2026-09-23 12:35:32 | 2026-09-23 12:35:45 |
| 17 | 2016-04-01 | 2026-09-23 12:35:45 | 2026-09-23 12:35:57 |
| 18 | 2017-04-01 | 2026-09-23 12:35:57 | 2026-09-23 12:36:09 |
| 19 | 2018-04-01 | 2026-09-23 12:36:09 | 2026-09-23 12:36:21 |
| 20 | 2019-04-01 | 2026-09-23 12:36:21 | 2026-09-23 12:36:33 |
| 21 | 2020-04-01 | 2026-09-23 12:36:33 | 2026-09-23 12:36:45 |
| 22 | 2021-04-01 | 2026-09-23 12:36:45 | 2026-09-23 12:36:57 |
| 23 | 2022-04-01 | 2026-09-23 12:36:57 | 2026-09-23 12:37:09 |
| 24 | 2023-04-01 | 2026-09-23 12:37:09 | 2026-09-23 12:37:21 |
| 25 | 2024-04-01 | 2026-09-23 12:37:22 | 2026-09-23 12:37:34 |
| 26 | 2025-04-01 | 2026-09-23 12:37:34 | 2026-09-23 12:37:46 |
Appendix B Per-step diagnostics
Realized in the projection tables below is the risk engine scoring its own forecast: the buy-and-hold return of the segment that followed each rebalance, on the same gross basis the cone was projected on. It is deliberately not the charged, calendar-window total return the study’s tables print, so the two will not reconcile line by line; the cone and its outcome share one basis, which is what a calibration test requires. Each row names its segment’s span so a boundary session is visible.
Names held is the union across the window: the count of distinct instruments the book touched between the window’s first and last session, not the number it held at one time. A book that rotates monthly touches more names than it holds.
What each step's run actually did beyond its return: capital allocation across lanes and regimes, the portfolio book's rebalancing and cost drag, and how positions were sized. Harvested from the frozen run reports, present where the circuit produced them. Cost drag is the gap between the step's return before and after its trading costs, in percentage points of the step's starting capital, so on a book that trades every session and compounds it can exceed the step's own net return.
Open the full per-step grid (26 steps: every rebalance, capital routing and sizing, per window)
Step 2 · 2001-04-02 → 2002-04-01
Expanding
Portfolio book, rebalanced hold · 15 names held · selection: anchor · cost drag 0.209% · 25 names dropped at load for want of prices (40 selected, 15 held), weights renormalised onto the rest
Not expanding
Portfolio book, rebalanced hold · 10 names held · selection: anchor · cost drag 0.218% · 21 names dropped at load for want of prices (31 selected, 10 held), weights renormalised onto the rest
Step 3 · 2002-04-01 → 2003-04-01
Expanding
Portfolio book, rebalanced hold · 15 names held · selection: anchor · cost drag 0.119% · 19 names dropped at load for want of prices (34 selected, 15 held), weights renormalised onto the rest
Not expanding
Portfolio book, rebalanced hold · 13 names held · selection: anchor · cost drag 0.136% · 25 names dropped at load for want of prices (38 selected, 13 held), weights renormalised onto the rest
Step 6 · 2005-04-01 → 2006-03-31
Expanding
Portfolio book, rebalanced hold · 18 names held · selection: anchor · cost drag 0.269% · 13 names dropped at load for want of prices (31 selected, 18 held), weights renormalised onto the rest
Not expanding
Portfolio book, rebalanced hold · 19 names held · selection: anchor · cost drag 0.246% · 17 names dropped at load for want of prices (36 selected, 19 held), weights renormalised onto the rest
Step 7 · 2006-04-03 → 2007-03-30
Expanding
Portfolio book, rebalanced hold · 17 names held · selection: anchor · cost drag 0.212% · 16 names dropped at load for want of prices (33 selected, 17 held), weights renormalised onto the rest
Not expanding
Portfolio book, rebalanced hold · 23 names held · selection: anchor · cost drag 0.189% · 6 names dropped at load for want of prices (29 selected, 23 held), weights renormalised onto the rest
Step 8 · 2007-04-02 → 2008-03-31
Expanding
Portfolio book, rebalanced hold · 25 names held · selection: anchor · cost drag 0.179% · 9 names dropped at load for want of prices (34 selected, 25 held), weights renormalised onto the rest
Not expanding
Portfolio book, rebalanced hold · 14 names held · selection: anchor · cost drag 0.195% · 6 names dropped at load for want of prices (20 selected, 14 held), weights renormalised onto the rest
Step 9 · 2008-04-01 → 2009-04-01
Expanding
Portfolio book, rebalanced hold · 22 names held · selection: anchor · cost drag 0.147% · 6 names dropped at load for want of prices (28 selected, 22 held), weights renormalised onto the rest
Not expanding
Portfolio book, rebalanced hold · 21 names held · selection: anchor · cost drag 0.125% · 10 names dropped at load for want of prices (31 selected, 21 held), weights renormalised onto the rest
Step 10 · 2009-04-01 → 2010-04-01
Expanding
Portfolio book, rebalanced hold · 19 names held · selection: anchor · cost drag 0.352% · 9 names dropped at load for want of prices (28 selected, 19 held), weights renormalised onto the rest
Not expanding
Portfolio book, rebalanced hold · 30 names held · selection: anchor · cost drag 0.344% · 9 names dropped at load for want of prices (39 selected, 30 held), weights renormalised onto the rest
Step 11 · 2010-04-01 → 2011-04-01
Expanding
Portfolio book, rebalanced hold · 10 names held · selection: anchor · cost drag 0.258% · 1 name dropped at load for want of prices (11 selected, 10 held), weights renormalised onto the rest
Not expanding
Portfolio book, rebalanced hold · 41 names held · selection: anchor · cost drag 0.257% · 19 names dropped at load for want of prices (60 selected, 41 held), weights renormalised onto the rest
Step 12 · 2011-04-01 → 2012-03-30
Expanding
Portfolio book, rebalanced hold · 22 names held · selection: anchor · cost drag 0.225% · 13 names dropped at load for want of prices (35 selected, 22 held), weights renormalised onto the rest
Not expanding
Portfolio book, rebalanced hold · 32 names held · selection: anchor · cost drag 0.206% · 6 names dropped at load for want of prices (38 selected, 32 held), weights renormalised onto the rest
Step 13 · 2012-04-02 → 2013-04-01
Expanding
Portfolio book, rebalanced hold · 37 names held · selection: anchor · cost drag 0.203% · 8 names dropped at load for want of prices (45 selected, 37 held), weights renormalised onto the rest
Not expanding
Portfolio book, rebalanced hold · 16 names held · selection: anchor · cost drag 0.239% · 6 names dropped at load for want of prices (22 selected, 16 held), weights renormalised onto the rest
Step 14 · 2013-04-01 → 2014-04-01
Expanding
Portfolio book, rebalanced hold · 26 names held · selection: anchor · cost drag 0.249% · 6 names dropped at load for want of prices (32 selected, 26 held), weights renormalised onto the rest
Not expanding
Portfolio book, rebalanced hold · 31 names held · selection: anchor · cost drag 0.283% · 6 names dropped at load for want of prices (37 selected, 31 held), weights renormalised onto the rest
Step 15 · 2014-04-01 → 2015-04-01
Expanding
Portfolio book, rebalanced hold · 27 names held · selection: anchor · cost drag 0.222% · 3 names dropped at load for want of prices (30 selected, 27 held), weights renormalised onto the rest
Not expanding
Portfolio book, rebalanced hold · 26 names held · selection: anchor · cost drag 0.221% · 6 names dropped at load for want of prices (32 selected, 26 held), weights renormalised onto the rest
Step 16 · 2015-04-01 → 2016-03-31
Expanding
Portfolio book, rebalanced hold · 25 names held · selection: anchor · cost drag 0.211% · 4 names dropped at load for want of prices (29 selected, 25 held), weights renormalised onto the rest
Not expanding
Portfolio book, rebalanced hold · 29 names held · selection: anchor · cost drag 0.208% · 5 names dropped at load for want of prices (34 selected, 29 held), weights renormalised onto the rest
Step 17 · 2016-04-01 → 2017-03-31
Expanding
Portfolio book, rebalanced hold · 25 names held · selection: anchor · cost drag 0.255% · 3 names dropped at load for want of prices (28 selected, 25 held), weights renormalised onto the rest
Not expanding
Portfolio book, rebalanced hold · 29 names held · selection: anchor · cost drag 0.268% · 3 names dropped at load for want of prices (32 selected, 29 held), weights renormalised onto the rest
Step 18 · 2017-04-03 → 2018-03-29
Expanding
Portfolio book, rebalanced hold · 19 names held · selection: anchor · cost drag 0.263%
Not expanding
Portfolio book, rebalanced hold · 34 names held · selection: anchor · cost drag 0.235% · 3 names dropped at load for want of prices (37 selected, 34 held), weights renormalised onto the rest
Step 19 · 2018-04-02 → 2019-04-01
Expanding
Portfolio book, rebalanced hold · 26 names held · selection: anchor · cost drag 0.243% · 1 name dropped at load for want of prices (27 selected, 26 held), weights renormalised onto the rest
Not expanding
Portfolio book, rebalanced hold · 28 names held · selection: anchor · cost drag 0.225% · 1 name dropped at load for want of prices (29 selected, 28 held), weights renormalised onto the rest
Step 20 · 2019-04-01 → 2020-03-31
Expanding
Portfolio book, rebalanced hold · 33 names held · selection: anchor · cost drag 0.194% · 1 name dropped at load for want of prices (34 selected, 33 held), weights renormalised onto the rest
Not expanding
Portfolio book, rebalanced hold · 29 names held · selection: anchor · cost drag 0.19%
Step 21 · 2020-04-01 → 2021-04-01
Expanding
Portfolio book, rebalanced hold · 32 names held · selection: anchor · cost drag 0.37%
Not expanding
Portfolio book, rebalanced hold · 32 names held · selection: anchor · cost drag 0.383%
Step 22 · 2021-04-01 → 2022-04-01
Expanding
Portfolio book, rebalanced hold · 19 names held · selection: anchor · cost drag 0.222%
Not expanding
Portfolio book, rebalanced hold · 49 names held · selection: anchor · cost drag 0.207%
Step 23 · 2022-04-01 → 2023-03-31
Expanding
Portfolio book, rebalanced hold · 32 names held · selection: anchor · cost drag 0.188%
Not expanding
Portfolio book, rebalanced hold · 37 names held · selection: anchor · cost drag 0.182%
Step 24 · 2023-04-03 → 2024-03-28
Expanding
Portfolio book, rebalanced hold · 33 names held · selection: anchor · cost drag 0.274%
Not expanding
Portfolio book, rebalanced hold · 33 names held · selection: anchor · cost drag 0.256% · 1 name dropped at load for want of prices (34 selected, 33 held), weights renormalised onto the rest
Step 25 · 2024-04-01 → 2025-04-01
Expanding
Portfolio book, rebalanced hold · 27 names held · selection: anchor · cost drag 0.191%
Not expanding
Portfolio book, rebalanced hold · 43 names held · selection: anchor · cost drag 0.214%
Step 26 · 2025-04-01 → 2026-04-01
Expanding
Portfolio book, rebalanced hold · 24 names held · selection: anchor · cost drag 0.254%
Not expanding
Portfolio book, rebalanced hold · 51 names held · selection: anchor · cost drag 0.304%