

What the broker takes: Betting Against Beta, approximately, the institution’s machine against the retail hand across twenty sealed windows of the S&P 500
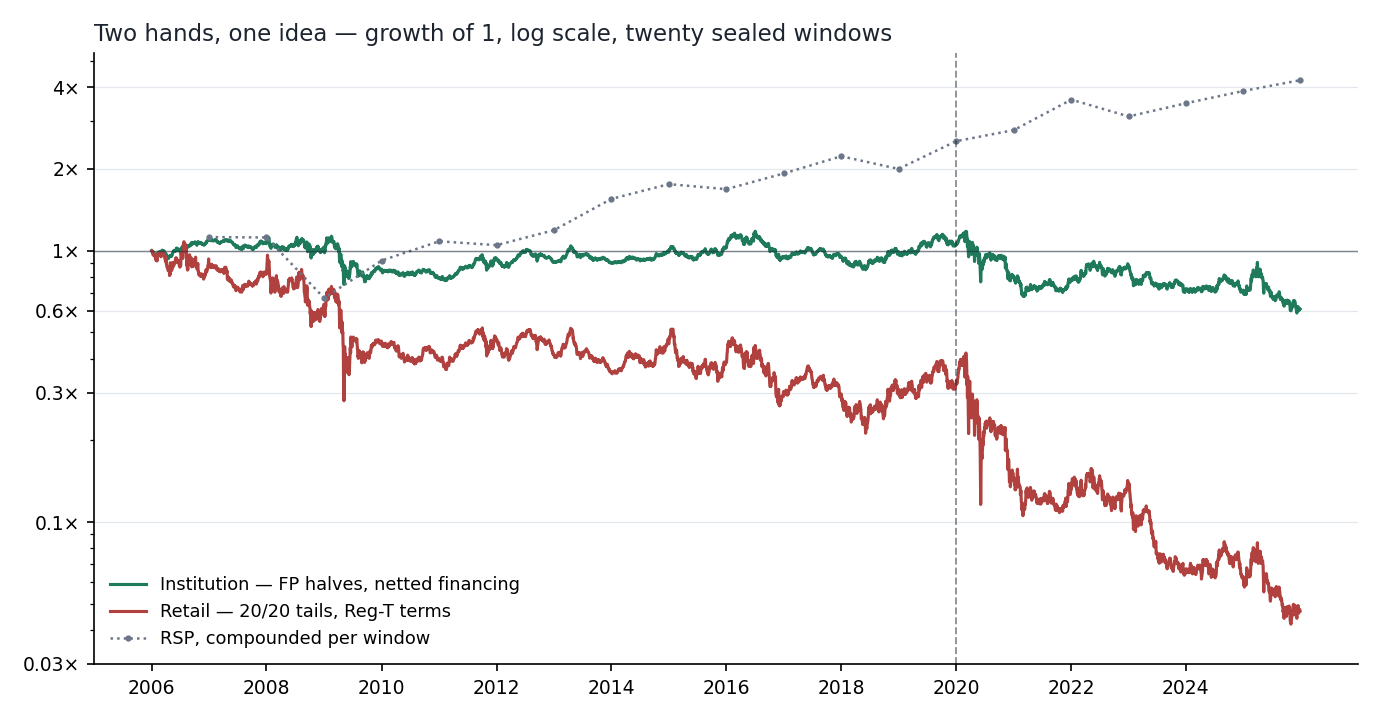
Build the celebrated low-beta trade two ways and make them race for twenty sealed years. Arm A is our closest approximation of the machine Frazzini and Pedersen published: the entire below-median half of the S&P 500 held long, the entire above-median half held short, both legs rank-weighted toward the extremes and levered to a market beta of zero, financed at institutional terms, measured carrying cost, four points in twenty years. Arm B is the same idea as a person with a phone and a brokerage account can actually hold it: the twenty most extreme betas a side, margin at retail spreads, borrow fees on every short. Say it plainly before the numbers: this is an APPROXIMATION, not a replication, six disclosed deviations from the published construction, each with its reason and its direction of bias, open this paper. A beta-neutral book's proper benchmark is not the stock market it was built not to resemble; it is cash, zero, at this platform's zero risk-free convention. Against that benchmark: on price returns the institution's book lost 38.9% over twenty years; credit the dividend carry its yield-heavy long leg earns, bounded arithmetic at the measured leg scales, stated in the discussion, and twenty years of the machine land between −7% and +4%. Approximately zero, judged against the benchmark it was engineered to match. (The equal-weight index made +324.8% over the same years, not this book's benchmark, but the alternative every reader actually faced.) The retail version lost 95.3%, dividends move it to roughly −86%, with almost three-quarters of its starting capital consumed by financing and borrow costs alone, and even that flatters it: at the measured 2.41× gross, this book exceeds what a Regulation-T account may even open (deviation six). Across 5,011 paired days the gap between the two hands prices at 11.9 points a year of CAGR, the pairing statistic, not a success statistic; both books lost money. The record supports one sentence without qualification: whatever remains of this anomaly on the most liquid five hundred stocks, none of it is reachable by a retail investor.
What this is not, six disclosed deviations from Frazzini–Pedersen (2014)
Read this before the results, because the results are only as good as these admissions. ONE, Universe. The paper builds on the full CRSP tape: NYSE, AMEX and NASDAQ, thousands of names, micro-caps included, and its own size-sorted tables put the largest Betting-Against-Beta premium in the smallest stocks. We run the point-in-time S&P 500, because it is the only universe this platform can hold survivorship-clean with verifiable historical membership; it is also, not incidentally, the only slice a retail reader can inspect name by name. Direction of bias: against our institutional arm, we are testing the machine where the literature itself says its fuel is thinnest. TWO, Returns. The platform computes price returns; a beta-neutral book is structurally long dividend yield, so this omission bleeds both arms and we CREDIT it in the headline as bounded arithmetic at the measured leg scales rather than bury it. THREE, Cadence. Quarterly point-in-time re-selection, not the paper's monthly, so that a 500-name universe re-screens fully and honestly within compute budgets rather than approximately at speed. Bias small, direction unclear. FOUR, Estimator. A 252-day OLS beta against SPY with the paper's own 0.4 shrink toward one, instead of their split correlation-and-volatility windows; published work finds estimator variants second-order for this trade. Within-leg weighting is a linear taper toward the extremes, at a median split, the same shape as the paper's rank weights. FIVE, Financing. The paper finances at the risk-free rate by assumption. We charge explicit terms on both arms, institutional netting at 50 basis points over plus 25 of borrow (measured cost across twenty years: four points), and the retail arm's 350-plus-150 unnetted terms, which are not a deviation at all: they are the experiment. SIX, Regulation T. The retail book's beta-neutral scales imply 2.41× gross exposure, and Regulation T caps an initial margin book at 2×: a real retail account could not even OPEN this book, it would be forced to deleverage toward 2×, changing the trade rather than merely taxing it. (Portfolio margin escapes the cap, but its minimums, typically around $125,000, are not 'a person with a phone'.) We ran the unconstrained 2.41× at the best published retail tier anyway, which means the direction of this bias FAVORS the retail arm: the −95.3% printed here is the OPTIMISTIC rendering, and a Reg-T-compliant version is strictly worse. Everything else, the sealed windows, the point-in-time membership, the frozen reports, the leg-level decomposition, is the platform's standard record and is inspectable on the canvas.
1 Methodology
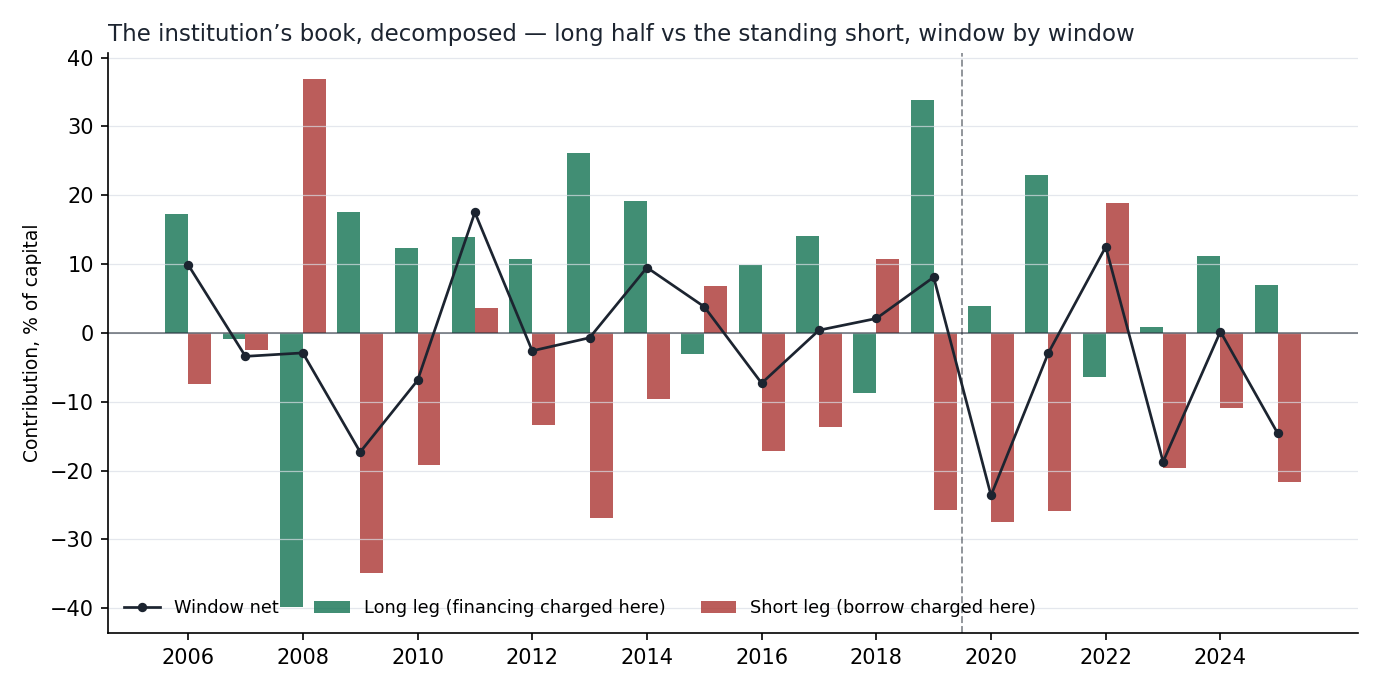
Two arms, two declared fields apart, sealed at registration. Both arms select from point-in-time S&P 500 membership, estimate each name's market beta as of the anchor (252 trading days of daily returns against SPY, ordinary least squares, Vasicek-shrunk 0.4 toward one, the same shrink weight Frazzini–Pedersen use), rank the cross-section, and build a long/short book with both legs scaled by 1/β to an ex-ante market beta of zero, rank-tapered toward the extremes. Arm A splits at the MEDIAN of whatever the era's universe resolves, 344 names held in 2006 growing to 504 by 2025, the faithful reading of the published construction on this universe, and pays institutional financing: short proceeds net against the margin loan, a 50 basis-point spread on any residual borrowing, 25 basis points of general-collateral short borrow. Arm B holds the twenty most extreme betas a side, the concentrated book a small account builds when it cannot hold five hundred positions, and pays retail terms: no netting of short proceeds (Regulation-T treatment), a 350 basis-point margin spread at the BEST published retail tier, 150 basis points of borrow. Both arms re-select point-in-time quarterly inside one-year out-of-sample windows, twenty sealed windows walking 2006–2025, each registered before it ran. The benchmark is RSP, the equal-weight S&P 500; Sharpe ratios use a zero risk-free rate, platform convention, disclosed. Every window reports the book's LONG leg and SHORT leg separately, daily P&L split by position sign, financing charged to the long leg, borrow to the short, so the reader can see what each half of the trade did on its own, and the self-audit flag on that decomposition reconciles in all forty arm-windows.
Transaction costs are not modelled in this study; all results are gross of costs.
2 Results
2.1 Headline
| Book | Total return | Per year | Volatility | Sharpe | Worst drawdown | Mean window |
|---|---|---|---|---|---|---|
| Benchmark (reference) | +325.6% | 7.51% | 20.7% | 0.46 | -61.6% | +9.09% |
| The institution: Frazzini-Pedersen halves at institutional financing | -39.0% | -2.44% | 16.3% | -0.07 | -50.1% | -1.85% |
| The retail hand: 20/20 extreme tails at retail financing | -95.3% | -14.18% | 38.2% | -0.21 | -96.1% | -11.76% |
Volatility, Sharpe and worst drawdown are computed on each book's own stitched daily series over the identical trading days that Figure 1 draws, so the panel and the figure are the same arithmetic. Sharpe carries no cash hurdle. Mean window is the arithmetic average of the one-year window returns, each from its first close after the opening trade, and does not compound to the total beside it: the difference is volatility drag, plus that opening charge where the walk pays one.
2.2 Per-step results
| # | Out-of-sample window | The institution: Frazzini-Pedersen halves at institutional financing SR | The retail hand: 20/20 extreme tails at retail financing SR |
|---|---|---|---|
| 1 | 2006-01-03 → 2006-12-29 | 1.22 | -0.15 |
| 2 | 2007-01-03 → 2007-12-31 | -0.47 | -0.44 |
| 3 | 2008-01-02 → 2008-12-31 | -0.04 | -0.35 |
| 4 | 2009-01-02 → 2009-12-31 | -0.46 | -0.13 |
| 5 | 2010-01-04 → 2010-12-31 | -0.87 | -0.81 |
| 6 | 2011-01-03 → 2011-12-30 | 1.40 | 0.80 |
| 7 | 2012-01-03 → 2012-12-31 | -0.28 | -0.67 |
| 8 | 2013-01-02 → 2013-12-31 | -0.06 | -0.94 |
| 9 | 2014-01-02 → 2014-12-31 | 1.46 | 1.45 |
| 10 | 2015-01-02 → 2015-12-31 | 0.44 | -0.51 |
| 11 | 2016-01-04 → 2016-12-30 | -0.46 | -0.53 |
| 12 | 2017-01-03 → 2017-12-29 | 0.09 | 0.05 |
| 13 | 2018-01-02 → 2018-12-31 | 0.23 | 0.19 |
| 14 | 2019-01-02 → 2019-12-31 | 0.66 | 0.40 |
| 15 | 2020-01-02 → 2020-12-31 | -0.64 | -0.45 |
| 16 | 2021-01-04 → 2021-12-31 | -0.11 | -0.12 |
| 17 | 2022-01-03 → 2022-12-30 | 0.75 | 0.30 |
| 18 | 2023-01-03 → 2023-12-29 | -1.29 | -1.96 |
| 19 | 2024-01-02 → 2024-12-31 | 0.09 | 0.02 |
| 20 | 2025-01-02 → 2025-12-31 | -0.50 | -0.43 |
2.3 Search accounting
No search record exists for this design. It was not promoted from a recorded evolving search, so the number of alternatives tried before it, on paper, in another tool, or in the author's head, is unknown. Unknown is a different fact from one: a study with no lineage is not a strategy with one trial, it is a strategy with an unrecorded number of them. Accordingly no count of alternatives tried is claimed, and nothing in this paper is corrected for a search that was never recorded; the number that stands is the raw out-of-sample result plus this disclosure. The registered per-step record below (§4) still guarantees each window's hypothesis was hashed and registered before that window was scored.
2.4 The comparison
Both arms trade the same registered windows, so their returns can be PAIRED: inside each window the two return series are inner-joined date by date and the difference rThe institution: Frazzini-Pedersen halves at institutional financing − rThe retail hand: 20/20 extreme tails at retail financing is the object under test. Because this is ONE pre-declared contrast, frozen at registration before any window was scored, the paired statistic needs no multiple-testing deflation, and the per-arm pooled numbers above are likewise uncorrected, because this design has no recorded search to correct against (§2.3). The paired contrast carries that gap differently from the arm levels: it was declared before each window ran and it is scored on the difference, so no window could be read first and scored after. What the timestamps cannot speak to is how this contrast came to be the declared one, which is the limit §2.3 states.
In the table: Arm A = The institution: Frazzini-Pedersen halves at institutional financing · Arm B = The retail hand: 20/20 extreme tails at retail financing.
| # | Window | Paired bars | Arm A | Arm B | Δ | Leader |
|---|---|---|---|---|---|---|
| 1 | 2006-01-04 → 2006-12-29 | 250 | +9.9% | -11.6% | +21.5 pp | Arm A |
| 2 | 2007-01-04 → 2007-12-31 | 250 | -3.4% | -7.4% | +4.0 pp | Arm A |
| 3 | 2008-01-03 → 2008-12-31 | 252 | -2.9% | -22.6% | +19.7 pp | Arm A |
| 4 | 2009-01-05 → 2009-12-31 | 251 | -17.3% | -27.3% | +9.9 pp | Arm A |
| 5 | 2010-01-05 → 2010-12-31 | 251 | -6.9% | -13.4% | +6.6 pp | Arm A |
| 6 | 2011-01-04 → 2011-12-30 | 251 | +17.5% | +17.2% | +0.3 pp | Arm A |
| 7 | 2012-01-04 → 2012-12-31 | 249 | -2.6% | -11.6% | +9.0 pp | Arm A |
| 8 | 2013-01-03 → 2013-12-31 | 251 | -0.7% | -13.4% | +12.7 pp | Arm A |
| 9 | 2014-01-03 → 2014-12-31 | 251 | +9.5% | +26.6% | -17.1 pp | Arm B |
| 10 | 2015-01-05 → 2015-12-31 | 251 | +3.8% | -14.8% | +18.6 pp | Arm A |
| 11 | 2016-01-05 → 2016-12-30 | 251 | -7.3% | -22.6% | +15.3 pp | Arm A |
| 12 | 2017-01-04 → 2017-12-29 | 250 | +0.4% | -0.9% | +1.3 pp | Arm A |
| 13 | 2018-01-03 → 2018-12-31 | 250 | +2.1% | +0.6% | +1.5 pp | Arm A |
| 14 | 2019-01-03 → 2019-12-31 | 251 | +8.1% | +7.8% | +0.3 pp | Arm A |
| 15 | 2020-01-03 → 2020-12-31 | 252 | -23.6% | -54.5% | +31.0 pp | Arm A |
| 16 | 2021-01-05 → 2021-12-31 | 251 | -2.9% | -9.3% | +6.3 pp | Arm A |
| 17 | 2022-01-04 → 2022-12-30 | 250 | +12.5% | +4.0% | +8.5 pp | Arm A |
| 18 | 2023-01-04 → 2023-12-29 | 249 | -18.7% | -52.3% | +33.5 pp | Arm A |
| 19 | 2024-01-03 → 2024-12-31 | 251 | +0.2% | -4.6% | +4.8 pp | Arm A |
| 20 | 2025-01-03 → 2025-12-31 | 249 | -14.6% | -25.2% | +10.6 pp | Arm A |
Paired Sharpe of the difference track: 0.28 · block bootstrap (2000 paths, block 10, seed 1234): P(The institution: Frazzini-Pedersen halves at institutional financing beats The retail hand: 20/20 extreme tails at retail financing) = 92.2%.
Window win-rate. The institution: Frazzini-Pedersen halves at institutional financing led 19 of 20 windows (95.0%), The retail hand: 20/20 extreme tails at retail financing led 1, and the mean window gap of +9.90 pp points the same way. Widest single window: 2023 at +33.5 pp.
| Period | Windows | The institution: Frazzini-Pedersen halves at institutional financing | The retail hand: 20/20 extreme tails at retail financing | Mean gap | The institution: Frazzini-Pedersen halves at institutional financing led |
|---|---|---|---|---|---|
| All windows | 20 | -1.85% | -11.76% | +9.90 pp | 19/20 |
| Before 2020 | 14 | +0.72% | -6.67% | +7.39 pp | 13/14 |
| 2020 onward | 6 | -7.86% | -23.64% | +15.78 pp | 6/6 |
3 The circuit
The strategy is a circuit of platform primitives, frozen when the study is registered. Below is the circuit as wired on the canvas, the objective it encodes and how the search runs through it, followed by the mathematics each primitive actually computes, the same formulas the execution engine runs. The complete parameterisation is preserved in the study ledger (Appendix A).
The sentence below is the registration record, generated when the circuit was registered and printed verbatim; the authored description of the design is Section 1.
A COMPARATIVE study, The institution: Frazzini-Pedersen halves at institutional financing vs The retail hand: 20/20 extreme tails at retail financing, walked on the same registered out-of-sample windows. The institution: Frazzini-Pedersen halves at institutional financing: S&P 500, selected by statistical / factor criteria, rebalanced quarterly across the selected basket, and run out-of-sample from the anchor, whatever the design estimates from history is re-estimated at each anchor from pre-anchor data only, and the walk advances through registered out-of-sample windows; its disposition is the realized forward path versus the benchmark. The retail hand: 20/20 extreme tails at retail financing: S&P 500, selected by statistical / factor criteria, rebalanced quarterly across the selected basket, and run out-of-sample from the anchor, whatever the design estimates from history is re-estimated at each anchor from pre-anchor data only, and the walk advances through registered out-of-sample windows; its disposition is the realized forward path versus the benchmark. The arms differ in: 2 places, Long / Short, leg_mode: half → fixed; Portfolio Forward Test, financing_profile: institutional → retail. NOTE: with more than one difference, an out-of-sample gap cannot be attributed to any single change. The contrast under test: whether The institution: Frazzini-Pedersen halves at institutional financing generates better risk-adjusted returns than The retail hand: 20/20 extreme tails at retail financing over the identical out-of-sample windows.
Envelopes show counts, ratios, dates, and the parameters the author chose. Full price and per-name data series are not republished: the underlying market data is licensed to QuanterLab. Point figures quoted in the prose, a named holding's return over a stated span, are summary facts derived from public market prices, not redistributed series.
The objective and the search
The institution: Frazzini-Pedersen halves at institutional financing
| Universe | S&P 500 index constituents. |
|---|---|
| Selection | metric across Market beta (β) → long the bottom 20 and short the top 20 by Market beta (β), rank-tapered toward the extremes, each leg levered by 1/β to an ex-ante market-neutral book. |
| Validation & out-of-sample | portfolio forward test (buy-and-hold book) (1y horizon from the anchor, quarterly rebalance). |
| Other components | Select: Long / Short. |
The retail hand: 20/20 extreme tails at retail financing
The specification is identical to The institution: Frazzini-Pedersen halves at institutional financing's table above, row for row; the one registered difference between the arms is itemized below.
What differs between the arms, 2 differences; more than one thing changes at once:
- paramLong / Short, leg_mode: half → fixed
- paramPortfolio Forward Test, financing_profile: institutional → retail
Reader's note. With 2 settings changed at once across 2 nodes, an out-of-sample gap between the arms cannot be attributed to any single change, the arms are compared as whole packages, and any causal reading of one ingredient is unsupported by this design.
No transaction-cost elements are wired into this circuit; results are gross of costs.
Show the mathematics, 6 primitives, formulas and parity notes
3.1 Universe
The starting set of tickers, resolved point-in-time from the index change-log, so names delisted or removed later still compete on the dates they traded.
Before any math, you need a list of stocks. An index preset (S&P 500, Nasdaq-100, Dow 30) is reconstructed as it stood ON your anchor date by replaying the historical add/drop change-log backwards, so a 2018 backtest sees the 2018 membership, not today's winners.
Start from today's constituents and un-apply every membership change after the anchor t:
\mathcal{U}(t) = \mathcal{U}_{\text{now}} \;\ominus\; \{\text{adds after } t\} \;\oplus\; \{\text{drops after } t\}3.2 Price Loader
Bulk OHLCV fetch for the whole universe, point-in-time, no future bars.
Momentum, volatility, trend, every price-based metric needs history. This loads open/high/low/close/volume for all names in parallel, clipped so nothing after the anchor can leak in. The lookback window is derived automatically from the deepest metric you wired.
It loads exactly enough history for the hungriest downstream metric plus a warm-up buffer:
W = \max_k(\text{lookback}_k) + \text{buffer}, \qquad \text{bars} \le \text{anchor } t3.3 Filter Beta
CAPM market beta, how hard this stock moves when the market moves.
Regress the stock’s daily returns on the market proxy’s over a trailing window. The slope is beta: 2.0 doubles the market’s move, 0.5 halves it, negative moves against it. One caution the estimate itself cannot give you: beta is measured AGAINST the index, so when one factor dominates index variance, a high beta is a high loading on that factor, whatever it happens to be that decade.
\hat\beta_i = \frac{\operatorname{Cov}(r_i, r_m)}{\operatorname{Var}(r_m)}\beta^{shrunk}_i = w\cdot 1 + (1-w)\,\hat\beta_iThe metric attaches to each stock for Composite Σ / Top-N ranking, “keep lowest” builds the defensive book, “keep highest” the aggressive one. The serial gate is OFF by default: this filter measures and ranks; it drops nothing unless you arm the gate.
3.4 Long Short Select
Both ends of the ranking in one book, long one tail, short the other.
The academic long-minus-short spread as a tradable book: long N names at one end of the ranking, short N at the other, `long_side` choosing which end is long (lowest = the Betting-Against-Beta reading of a beta ranking). Default legs are equal-weighted and the book runs at 100% of capital, no leverage. The Frazzini–Pedersen construction turns on two knobs: rank weighting tapers each leg toward its extreme, and β-neutral levers the low-beta leg up and scales the high-beta leg down so the book’s ex-ante market beta is zero, which is precisely where financing terms start to matter.
w_i \;=\; \frac{N + 1 - k_i}{\sum_{j=1}^{N} j}, \qquad k_i = \text{rank from the extreme, } 1..N\text{long scale} = \frac{1}{\beta_L}, \quad \text{short scale} = \frac{1}{\beta_H}, \qquad \beta_{\text{leg}} = \sum_i w_i \beta_iA β-neutral book’s gross exposure is 1/β_L + 1/β_H ≈ 2.2× of capital, the excess is borrowed. The Portfolio Forward Test charges that loan per its financing profile (institutional nets short proceeds against the borrowing; retail cannot), plus short borrow on the short leg. The construction is the same either way; the financing terms decide what survives.
3.5 Portfolio Backtest
Replay the portfolio forward, rebalanced, point-in-time.
Holds the basket and rebalances on schedule, re-selecting and re-optimizing point-in-time at each rebalance (so it only ever uses information available then), and reports the equity curve, Sharpe, drawdown and trade stats, optionally net of cost and risk overlays.
E_t = E_{t-1}\big(1 + \mathbf w_{t}^{\top}\mathbf r_t - \text{costs}_t\big)\text{DD}_t = \frac{E_t}{\max_{\tau\le t}E_\tau} - 1, \qquad \text{MaxDD} = \min_t \text{DD}_t\text{charge}_t \;=\; \text{loan}_t \cdot \frac{\text{spread}}{252}, \qquad \text{loan}_t = \begin{cases}\max(0,\,-\text{cash}_t) & \text{institutional (netted)}\\ \max(0,\,\text{long MV}_t - E_t) & \text{retail (no netting)}\end{cases}3.6 Portfolio Forward Autopsy
The post-mortem, where the forward test’s return actually came from.
Runs after the Portfolio Forward Test and dissects its realized path: per-rebalance contributions, winners and losers, exposure and cash periods, and how the realized route compares to what the risk cones projected. It computes nothing new about the future, it explains the past the book just lived.
Depth I–IV: headline attribution, per-segment breakdown, per-name contributions, and the calibration ledger (projected cone vs realized, segment by segment). In a study, this is the node that fills the appendices.
4 Projection calibration
Not applicable to this study: the Monte Carlo projection model scores long-only books and does not score levered long/short books, so no rebalance in this walk carries a cone or a VaR verdict. No calibration claim is made anywhere in this paper.
5 Discussion
5.1 Findings
1, The headline, with dividends counted, against the right benchmark. A book built to a market beta of zero is benchmarked against cash, zero at this platform's convention, not against the equity index it was engineered not to resemble. Price returns first, because that is what the platform computes: the institution's approximation lost 38.9% over twenty years (−2.5%/yr); the retail hand lost 95.3% (−14.3%/yr); for context, not comparison, the equal-weight index made +324.8% (+7.5%/yr). (Units, once, for the whole paper: 'points' means percentage points of starting capital, and leg or cost contributions are SUMMED across windows, not compounded, the compounded book return is always stated separately.) But a beta-neutral book is long the yield-heavy half of the market at 1.32× and short the near-zero-yield half at 0.78× (measured average scales), so omitting dividends bleeds it by construction, roughly 2.1 to 2.7 points a year at stated yield assumptions. Credited, the institution's twenty years land between −7% and +4%: approximately zero, four points of measured carrying cost included. The same credit at the retail book's scales (1.80× long on ~3%-yielding staples tails) is worth ~5 to 6 points a year and still only moves it from −95.3% to roughly −86%. Zero for the institution; ruin for the retail hand.
2, The approximation tracks the thing it approximates, which is what makes the zero credible. Window by window, Arm A wears the published factor's fingerprint: destroyed in the 2009 junk rally (−17.3%), strong in 2011 (+17.5%) and 2014 (+9.5%), defensive when the market fell in 2018 (+2.1% against −10.2%) and 2015 (+3.8% against −4.2%), −23.6% in 2020, the year the live institutional factor itself printed near −25% (AQR Data Library, Betting Against Beta USA monthly series, calendar-2020 compounded), and positive in 2022 (+12.5%), the one recent year the regime reversed, with the SHORT leg contributing +18.9. A broken implementation does not reproduce the factor's good years, bad years and hedge years in the right places for twenty years.
3, Financing is free at the top and fatal at the bottom. The institutional arm's margin financing cost 0.03 points TOTAL across twenty years, netting short proceeds against the borrowing makes a beta-neutral book nearly self-financing, exactly the property the published construction assumes, plus 4.0 points of general-collateral borrow. The retail arm, denied netting, paid 54.2 points of margin financing plus 18.2 points of borrow: 72 points of starting capital summed across the twenty windows (charged year by year on an equity base those same charges were shrinking, summed, not compounded), on carrying costs alone, before a single selection decision had a chance to be right or wrong. The rates used are the BEST published retail tier; a mainstream brokerage schedule is worse. This is not an implementation detail of the trade. For a retail hand, it IS the trade.
4, The short leg is the structural bleed, for both hands. Decomposed over twenty years, summed window contributions, per the units note in finding 1, the institution's long leg made +162 points while its short leg lost −199, which reconciles: +162 − 199 = −37 summed, against −38.9% compounded. The retail book's tails did far worse on both sides, long +28, short −263, a summed −235 that compounds to −95.3% because each year's loss fell on an already-shrunken base. The short half of this trade is a standing short of whatever has been driving index variance, financials into 2009, the semiconductor-and-platform complex after 2019 (the companion paper's composition ledger names the names), and holding that short for two decades is what the celebrated backtests quietly require. The one year it pays is the crash: in 2008 Arm A's short leg made +36.8 while its long leg lost −39.7, the hedge doing precisely what it was built for. Twenty years of insurance premium, one payout.
5, Concentration is its own tax, before financing, measured inside this study's own sealed record. Compare the two long legs alone: the institution's diversified low half earned +162 summed points; the retail book's twenty-name low-beta tail earned +28. The short sides: −199 for the half, −263 for the tail. Same ranking, same dates, same direction, same financing charged to the other meter, the tail is just twenty stocks doing what twenty stocks do, on both sides of the book at once. Because the two arms of this study differ in construction AND financing, the decomposition needed a third measurement, and we ran one: the IDENTICAL halves book walked over the same twenty windows with the financing profile as the only declared variable, a supporting run, registered and sealed the same way, made after the two arms above and reported here rather than separately. Single-variable, it gives the clean split: the proper construction at retail terms lost 60.8% against the institution's 38.9%, so retail financing alone costs about 2 points a year of CAGR on the proper book, charged in every one of the twenty windows, never once absent. Subtract that from the 11.9-point institution-versus-retail gap and roughly 10 points a year remain as the price of CONCENTRATION: the twenty-name tails, not the financing terms, do most of the damage to the retail rendering. The broker takes his cut; the twenty-stock book does the dying.
6, The gap between the hands is priced, and it is not noise. Across 5,011 paired out-of-sample days the institution beats the retail implementation by 11.9 points a year of CAGR, wins the block-bootstrap pairing with 92.2% probability (paired Sharpe +0.28), and does it while holding the SAME signal on the SAME dates. Everything separating the two curves is construction and financing, the parts of the published trade that papers assume and accounts must rent. Novy-Marx & Velikov (2022) argued the premium's paper form leans on exactly those parts; this record prices the lean at retail: about twelve points a year.
7, Era honesty, same boundary as the companion paper. Before 2020 the institution's approximation was the thin, positive thing the large-cap literature describes: +5.3% on price returns over fourteen years, roughly +2 points a year once dividends are credited, a modest carry trade that cleared its costs at institutional terms and nothing more. From 2020 the six windows that broke the companion study's naive books broke this one too: −42% for the era even at the full construction, because beta-neutral or not, the short half was the index's engine. The era cut is the same composition-anchored 2020 boundary, disclosed as interpretation; the sealed object is the twenty-window walk.
5.2 Interpretation
Why publish an approximation at all? Because the gap between a published factor and a holdable portfolio is exactly where retail money gets hurt, and measuring that gap requires building both ends honestly and saying loudly which end is which. The five deviations ledgered at the top of this paper are not apologies; four of them are the platform's honesty constraints (a survivorship-clean universe we can actually verify point-in-time, price returns we bound rather than invent, a re-selection cadence we can compute without sampling shortcuts, a beta estimator whose every input is inspectable), and the fifth, financing, is the experiment itself. Each one is stated with its direction of bias, and the two that bias against the institution arm (universe and dividends) are QUANTIFIED: the small-cap slice we exclude is where Frazzini–Pedersen's own size tables put the largest premium, and the dividend carry we cannot compound is credited into the headline as a bound. A reader who wants to attack this paper should start from its own ledger, we got there first, on purpose.
The dividend arithmetic, in full, because without it the record is attackable and with it the conclusion sharpens. The institution's book runs, on measured averages, 1.32× long and 0.78× short. Assume the low-beta half yields 2.4–2.8% a year (staples, utilities, the pantry half of the index) and the high-beta half 1.2–1.4%: the foregone net carry is 1.32×yield_L minus 0.78×yield_H, between 2.1 and 2.7 points a year. Compounded across the twenty years, that moves −38.9% to the range −7% to +4%. The retail tails run 1.80× long on a twenty-name staples book yielding 3.0–3.5% against 0.61× short on near-zero yielders: 5.0 to 6.0 points a year of credit, and −95.3% still only becomes roughly −86%, because no carry survives a 72-point financing bill on a shrinking equity base. These are stated-assumption bounds on the sealed price-return record, not computed total returns; the assumptions and the arithmetic are reproducible from the window table and the measured scales printed in every report.
What should a reader take from a twenty-year zero at the BEST terms? Not that Frazzini–Pedersen were wrong: their factor, on their universe, with small caps and total returns and institutional funding, is not what we tested, the ledger says so first. What this record tests is the version of the idea that survives contact with the most liquid five hundred stocks and honest accounting: it earned, approximately, its dividend carry, a real but thin edge that only exists at financing terms no retail account is offered, on a book no retail account can hold, with a short leg no retail investor should want. If there is an edge somewhere in betting against beta today, it lives below this universe's market-cap floor, inside institutional financing, behind monthly rebalancing machinery, three doors, none of which open from a phone. It is a sad arithmetic and we would rather publish it than sell its opposite: measuring where the edges are NOT reachable is most of what honest retail research is for.
The record's one unqualified positive belongs to the naive reader's defense: every mechanism here behaved as designed. The hedge paid in the crash year, the financing charged what the profile said it would, the legs reconciled to the book in all forty arm-windows, and the approximation reproduced the published factor's good and bad years in the right places. When a construction this honest lands on zero, the zero is information.
No search record exists for this study: the design was not promoted from a recorded evolving search, so the number of alternatives tried before it is UNKNOWN, which is a different fact from one. No count of alternatives tried is claimed, and nothing is corrected for a search that was never recorded; the number that stands is the raw out-of-sample result plus this disclosure. The out-of-sample windows are historical.
The broker’s arithmetic, why the retail version cannot work
Walk the retail book through one year at its measured shape: 1.80× long, 0.61× short, gross around 2.4×, which, deviation six notes, already exceeds the 2× a Regulation-T account may open; hold the thought that everything following is the OPTIMISTIC case. The long leg's excess over equity is borrowed at a margin spread, 350 basis points at the best published retail tier, several hundred more at mainstream brokers, and short proceeds do not net against the loan the way a prime-brokerage account nets them. That asymmetry alone charged this book 54 points of starting capital across twenty years, against the institutional arm's 0.03. Add 150 basis points of borrow on a short leg that must be held continuously, 18 more points, and the retail implementation has spent nearly three-quarters of its capital on plumbing before its first good or bad selection. The trade the literature defends converts a risk-adjusted edge into raw return through cheap leverage; priced at retail, the converter consumes the edge and then the principal. This is why the landing sentence of this paper is not about the anomaly. It is about the reader: if an edge remains, it is not reachable from where you are standing.
5.3 Limitations
This paper approximates Frazzini–Pedersen (2014); it does not replicate it, and the six deviations are ledgered with reasons at the top. In brief, with directions: (1) UNIVERSE, point-in-time S&P 500 only, because it is the only universe this platform can hold survivorship-clean with verifiable membership; the published construction spans the full CRSP tape including the small and micro caps where its own size-sorted tables locate the largest premium. Bias: against Arm A, materially. (2) RETURNS, price returns platform-wide; the dividend carry a beta-neutral book earns is credited as a stated-assumption BOUND in the headline and discussion, not compounded daily. Bias: against both arms, quantified. (3) CADENCE, quarterly point-in-time re-selection versus monthly in the paper, an honest-compute choice; direction small and unclear. (4) ESTIMATOR, 252-day OLS beta against SPY, Vasicek-shrunk 0.4, versus the paper's split correlation/volatility windows; Novy-Marx & Velikov find estimator variants second-order. Within-leg weights are a linear rank taper toward the extremes, which at a median split is the published rank weighting's shape. (5) FINANCING, the published construction assumes financing at the risk-free rate; our institutional profile charges explicit netted terms (measured cost: four points in twenty years), and the retail profile is the experiment. (6) REGULATION T, the retail book's 2.41× measured gross exceeds the 2× a Reg-T account may open; it runs unconstrained here, so the printed retail outcome is the optimistic bound and a compliant, force-deleveraged version is strictly worse. Additional honesty notes: Sharpe ratios use a zero risk-free rate throughout; the risk-cone calibration ledger that accompanies long-only studies is absent here because the projection model does not score levered long/short books, no calibration claim is made; books occasionally held fewer names than targeted when a selected name lacked a usable entry bar, disclosed per window; the 2020 era boundary is interpretation, anchored to index composition in the companion selection-content paper, while the sealed object is the twenty-window walk itself; and finding 5's financing-only split comes from a third sealed walk made to support this paper, outside the two-arm registration above and labelled as such wherever it appears.
References
- Gelman, A., & Loken, E. (2013). The garden of forking paths: Why multiple comparisons can be a problem, even when there is no “fishing expedition.” Working paper, Columbia University.
- Harvey, C. R., Liu, Y., & Zhu, H. (2016). … and the Cross-Section of Expected Returns. Review of Financial Studies, 29(1), 5–68. doi:10.1093/rfs/hhv059
- Lo, A. W. (2002). The Statistics of Sharpe Ratios. Financial Analysts Journal, 58(4), 36–52. doi:10.2469/faj.v58.n4.2453
- Frazzini, A., & Pedersen, L. H. (2014). Betting Against Beta. Journal of Financial Economics, 111(1), 1–25.
- Novy-Marx, R., & Velikov, M. (2022). Betting Against Betting Against Beta. Journal of Financial Economics, 143(1), 80–106.
- Black, F. (1972). Capital Market Equilibrium with Restricted Borrowing. Journal of Business, 45(3), 444–455.
- Asness, C., Frazzini, A., Gormsen, N. J., & Pedersen, L. H. (2020). Betting Against Correlation: Testing Theories of the Low-Risk Effect. Journal of Financial Economics, 135(3), 629–652.
- Vasicek, O. A. (1973). A Note on Using Cross-Sectional Information in Bayesian Estimation of Security Betas. Journal of Finance, 28(5), 1233–1239.
- CRSP US Stock Databases, universe definition underlying Frazzini–Pedersen (2014); NYSE/AMEX/NASDAQ, all capitalizations.
- Published retail margin rate schedules of major U.S. brokers (2024–2025), vs. overnight benchmark rates, the 350bps 'best retail tier' spread used in Arm B.
- AQR Capital Management, Data Library, Betting Against Beta: Equity Factors, USA, monthly (accessed 2026). Calendar-2020 compounded return of the USA BAB series, cited in finding 2.
- QuanterLab (2026). Your beta is holding something different than it was, the companion selection-content study; composition ledger and era boundary.
Appendix A Reproducibility in QuanterLab
Each step is backed by a frozen run report. The study is re-derivable from the ledger below.
| # | Commit | Report | Anchor | OOS window |
|---|---|---|---|---|
| 1 | ff74f535a2a9 | 633 | 2006-01-01 | 2006-01-03 → 2006-12-29 |
| 2 | d2870523b587 | 634 | 2007-01-01 | 2007-01-03 → 2007-12-31 |
| 3 | 7ade42bfb42b | 635 | 2008-01-01 | 2008-01-02 → 2008-12-31 |
| 4 | 43e28755c3f2 | 636 | 2009-01-01 | 2009-01-02 → 2009-12-31 |
| 5 | f692c8391339 | 637 | 2010-01-01 | 2010-01-04 → 2010-12-31 |
| 6 | 561b54eb9c88 | 638 | 2011-01-01 | 2011-01-03 → 2011-12-30 |
| 7 | ac9119844d25 | 639 | 2012-01-01 | 2012-01-03 → 2012-12-31 |
| 8 | 0fe32ed6f8f2 | 640 | 2013-01-01 | 2013-01-02 → 2013-12-31 |
| 9 | f196ed684ae1 | 641 | 2014-01-01 | 2014-01-02 → 2014-12-31 |
| 10 | 34a3cded70b3 | 642 | 2015-01-01 | 2015-01-02 → 2015-12-31 |
| 11 | e0bec307e70e | 643 | 2016-01-01 | 2016-01-04 → 2016-12-30 |
| 12 | 4dae8b9b0296 | 644 | 2017-01-01 | 2017-01-03 → 2017-12-29 |
| 13 | fc3355e7a4b0 | 645 | 2018-01-01 | 2018-01-02 → 2018-12-31 |
| 14 | 2e194900f882 | 646 | 2019-01-01 | 2019-01-02 → 2019-12-31 |
| 15 | 90a241ca94bb | 647 | 2020-01-01 | 2020-01-02 → 2020-12-31 |
| 16 | 86b38173f204 | 648 | 2021-01-01 | 2021-01-04 → 2021-12-31 |
| 17 | 2eb44e86375b | 649 | 2022-01-01 | 2022-01-03 → 2022-12-30 |
| 18 | e42ff6f9e534 | 650 | 2023-01-01 | 2023-01-03 → 2023-12-29 |
| 19 | 598e46b0ffae | 651 | 2024-01-01 | 2024-01-02 → 2024-12-31 |
| 20 | d4b98f2cc621 | 652 | 2025-01-01 | 2025-01-02 → 2025-12-31 |
Appendix A2 Registration record
What this record does and does not establish. Every window in this study is historical: the data existed before the study began, so this is sequential registration on past windows, not pre-registration in the clinical-trial sense, and no procedure could make it so. What the platform does enforce is order, each step's specification was frozen and hashed before that step was scored, and the walk cannot advance past a step that was never run or close one with a result registered for a different window. The two timestamp columns below are the evidence: read them together and each registration precedes its own run, and each run precedes the next registration. A study whose registrations all post-date its runs would show it here. Wall-clock spacing between registrations varies with the author's schedule and queue latency; the ordering, not the tempo, is the claim.
“A COMPARATIVE study, The institution: Frazzini-Pedersen halves at institutional financing vs The retail hand: 20/20 extreme tails at retail financing, walked on the same registered out-of-sample windows. The institution: Frazzini-Pedersen halves at institutional financing: S&P 500, selected by statistical / factor criteria, rebalanced quarterly across the selected basket, and run out-of-sample from the anchor, whatever the design estimates from history is re-estimated at each anchor from pre-anchor data only, and the walk advances through registered out-of-sample windows; its disposition is the realized forward path versus the benchmark. The retail hand: 20/20 extreme tails at retail financing: S&P 500, selected by statistical / factor criteria, rebalanced quarterly across the selected basket, and run out-of-sample from the anchor, whatever the design estimates from history is re-estimated at each anchor from pre-anchor data only, and the walk advances through registered out-of-sample windows; its disposition is the realized forward path versus the benchmark. The arms differ in: 2 places, Long / Short, leg_mode: half → fixed; Portfolio Forward Test, financing_profile: institutional → retail. NOTE: with more than one difference, an out-of-sample gap cannot be attributed to any single change. The contrast under test: whether The institution: Frazzini-Pedersen halves at institutional financing generates better risk-adjusted returns than The retail hand: 20/20 extreme tails at retail financing over the identical out-of-sample windows.”
The same hypothesis was registered independently at every step, hashed before each step's out-of-sample window was scored:
| # | Anchor | Registered at (UTC) | Run completed (UTC) |
|---|---|---|---|
| 1 | 2006-01-01 | 2026-08-08 12:53:05 | 2026-08-08 12:54:01 |
| 2 | 2007-01-01 | 2026-08-08 12:54:06 | 2026-08-08 12:56:07 |
| 3 | 2008-01-01 | 2026-08-08 12:56:12 | 2026-08-08 12:57:53 |
| 4 | 2009-01-01 | 2026-08-08 12:57:58 | 2026-08-08 13:00:19 |
| 5 | 2010-01-01 | 2026-08-08 13:00:24 | 2026-08-08 13:02:04 |
| 6 | 2011-01-01 | 2026-08-08 13:02:10 | 2026-08-08 13:04:10 |
| 7 | 2012-01-01 | 2026-08-08 13:04:15 | 2026-08-08 13:05:55 |
| 8 | 2013-01-01 | 2026-08-08 13:06:01 | 2026-08-08 13:08:01 |
| 9 | 2014-01-01 | 2026-08-08 13:08:06 | 2026-08-08 13:09:47 |
| 10 | 2015-01-01 | 2026-08-08 13:09:52 | 2026-08-08 13:10:52 |
| 11 | 2016-01-01 | 2026-08-08 13:10:57 | 2026-08-08 13:12:38 |
| 12 | 2017-01-01 | 2026-08-08 13:12:43 | 2026-08-08 13:14:43 |
| 13 | 2018-01-01 | 2026-08-08 13:14:48 | 2026-08-08 13:16:29 |
| 14 | 2019-01-01 | 2026-08-08 13:16:34 | 2026-08-08 13:18:15 |
| 15 | 2020-01-01 | 2026-08-08 13:18:20 | 2026-08-08 13:20:00 |
| 16 | 2021-01-01 | 2026-08-08 13:20:05 | 2026-08-08 13:22:06 |
| 17 | 2022-01-01 | 2026-08-08 13:22:11 | 2026-08-08 13:23:51 |
| 18 | 2023-01-01 | 2026-08-08 13:23:56 | 2026-08-08 13:25:37 |
| 19 | 2024-01-01 | 2026-08-08 13:25:42 | 2026-08-08 13:27:22 |
| 20 | 2025-01-01 | 2026-08-08 13:27:28 | 2026-08-08 13:29:28 |
Appendix B Per-step diagnostics
Realized in the projection tables below is the risk engine scoring its own forecast: the buy-and-hold return of the segment that followed each rebalance, on the same gross basis the cone was projected on. It is deliberately not the charged, calendar-window total return the study’s tables print, so the two will not reconcile line by line; the cone and its outcome share one basis, which is what a calibration test requires. Each row names its segment’s span so a boundary session is visible.
Names held is the union across the window: the count of distinct instruments the book touched between the window’s first and last session, not the number it held at one time. A book that rotates monthly touches more names than it holds.
What each step's run actually did beyond its return: capital allocation across lanes and regimes, the portfolio book's rebalancing and cost drag, and how positions were sized. Harvested from the frozen run reports, present where the circuit produced them. Cost drag is the gap between the step's return before and after its trading costs, in percentage points of the step's starting capital, so on a book that trades every session and compounds it can exceed the step's own net return.
Open the full per-step grid (20 steps: every rebalance, capital routing and sizing, per window)
Step 1 · 2006-01-03 → 2006-12-29
The institution: Frazzini-Pedersen halves at institutional financing
Portfolio book, rebalanced quarterly · 5 constructions · 356 names held · selection: reselect · 0.0% in cash · 2 names dropped at load (358 selected, 356 held across the window), weights renormalised onto the rest
The retail hand: 20/20 extreme tails at retail financing
Portfolio book, rebalanced quarterly · 5 constructions · 71 names held · selection: reselect · 0.0% in cash · 2 names dropped at load (73 selected, 71 held across the window), weights renormalised onto the rest
Step 2 · 2007-01-03 → 2007-12-31
The institution: Frazzini-Pedersen halves at institutional financing
Portfolio book, rebalanced quarterly · 5 constructions · 377 names held · selection: reselect · 0.0% in cash · 1 name dropped at load (378 selected, 377 held across the window), weights renormalised onto the rest
The retail hand: 20/20 extreme tails at retail financing
Portfolio book, rebalanced quarterly · 5 constructions · 80 names held · selection: reselect · 0.0% in cash
Step 3 · 2008-01-02 → 2008-12-31
The institution: Frazzini-Pedersen halves at institutional financing
Portfolio book, rebalanced quarterly · 4 constructions · 390 names held · selection: reselect · 0.0% in cash · 7 names dropped at load (397 selected, 390 held across the window), weights renormalised onto the rest
The retail hand: 20/20 extreme tails at retail financing
Portfolio book, rebalanced quarterly · 4 constructions · 68 names held · selection: reselect · 0.0% in cash · 5 names dropped at load (73 selected, 68 held across the window), weights renormalised onto the rest
Step 4 · 2009-01-02 → 2009-12-31
The institution: Frazzini-Pedersen halves at institutional financing
Portfolio book, rebalanced quarterly · 5 constructions · 402 names held · selection: reselect · 0.0% in cash · 2 names dropped at load (404 selected, 402 held across the window), weights renormalised onto the rest
The retail hand: 20/20 extreme tails at retail financing
Portfolio book, rebalanced quarterly · 5 constructions · 52 names held · selection: reselect · 0.0% in cash · 2 names dropped at load (54 selected, 52 held across the window), weights renormalised onto the rest
Step 5 · 2010-01-04 → 2010-12-31
The institution: Frazzini-Pedersen halves at institutional financing
Portfolio book, rebalanced quarterly · 5 constructions · 417 names held · selection: reselect · 0.0% in cash · 1 name dropped at load (418 selected, 417 held across the window), weights renormalised onto the rest
The retail hand: 20/20 extreme tails at retail financing
Portfolio book, rebalanced quarterly · 5 constructions · 76 names held · selection: reselect · 0.0% in cash · 1 name dropped at load (77 selected, 76 held across the window), weights renormalised onto the rest
Step 6 · 2011-01-03 → 2011-12-30
The institution: Frazzini-Pedersen halves at institutional financing
Portfolio book, rebalanced quarterly · 5 constructions · 423 names held · selection: reselect · 0.0% in cash · 1 name dropped at load (424 selected, 423 held across the window), weights renormalised onto the rest
The retail hand: 20/20 extreme tails at retail financing
Portfolio book, rebalanced quarterly · 5 constructions · 67 names held · selection: reselect · 0.0% in cash
Step 7 · 2012-01-03 → 2012-12-31
The institution: Frazzini-Pedersen halves at institutional financing
Portfolio book, rebalanced quarterly · 4 constructions · 436 names held · selection: reselect · 0.0% in cash · 1 name dropped at load (437 selected, 436 held across the window), weights renormalised onto the rest
The retail hand: 20/20 extreme tails at retail financing
Portfolio book, rebalanced quarterly · 4 constructions · 50 names held · selection: reselect · 0.0% in cash · 1 name dropped at load (51 selected, 50 held across the window), weights renormalised onto the rest
Step 8 · 2013-01-02 → 2013-12-31
The institution: Frazzini-Pedersen halves at institutional financing
Portfolio book, rebalanced quarterly · 5 constructions · 445 names held · selection: reselect · 0.0% in cash
The retail hand: 20/20 extreme tails at retail financing
Portfolio book, rebalanced quarterly · 5 constructions · 71 names held · selection: reselect · 0.0% in cash
Step 9 · 2014-01-02 → 2014-12-31
The institution: Frazzini-Pedersen halves at institutional financing
Portfolio book, rebalanced quarterly · 5 constructions · 453 names held · selection: reselect · 0.0% in cash
The retail hand: 20/20 extreme tails at retail financing
Portfolio book, rebalanced quarterly · 5 constructions · 72 names held · selection: reselect · 0.0% in cash
Step 10 · 2015-01-02 → 2015-12-31
The institution: Frazzini-Pedersen halves at institutional financing
Portfolio book, rebalanced quarterly · 5 constructions · 467 names held · selection: reselect · 0.0% in cash
The retail hand: 20/20 extreme tails at retail financing
Portfolio book, rebalanced quarterly · 5 constructions · 72 names held · selection: reselect · 0.0% in cash
Step 11 · 2016-01-04 → 2016-12-30
The institution: Frazzini-Pedersen halves at institutional financing
Portfolio book, rebalanced quarterly · 4 constructions · 492 names held · selection: reselect · 0.0% in cash · 1 name dropped at load (493 selected, 492 held across the window), weights renormalised onto the rest
The retail hand: 20/20 extreme tails at retail financing
Portfolio book, rebalanced quarterly · 4 constructions · 64 names held · selection: reselect · 0.0% in cash · 1 name dropped at load (65 selected, 64 held across the window), weights renormalised onto the rest
Step 12 · 2017-01-03 → 2017-12-29
The institution: Frazzini-Pedersen halves at institutional financing
Portfolio book, rebalanced quarterly · 5 constructions · 504 names held · selection: reselect · 0.0% in cash · 2 names dropped at load (506 selected, 504 held across the window), weights renormalised onto the rest
The retail hand: 20/20 extreme tails at retail financing
Portfolio book, rebalanced quarterly · 5 constructions · 75 names held · selection: reselect · 0.0% in cash
Step 13 · 2018-01-02 → 2018-12-31
The institution: Frazzini-Pedersen halves at institutional financing
Portfolio book, rebalanced quarterly · 5 constructions · 503 names held · selection: reselect · 0.0% in cash
The retail hand: 20/20 extreme tails at retail financing
Portfolio book, rebalanced quarterly · 5 constructions · 69 names held · selection: reselect · 0.0% in cash
Step 14 · 2019-01-02 → 2019-12-31
The institution: Frazzini-Pedersen halves at institutional financing
Portfolio book, rebalanced quarterly · 5 constructions · 511 names held · selection: reselect · 0.0% in cash
The retail hand: 20/20 extreme tails at retail financing
Portfolio book, rebalanced quarterly · 5 constructions · 54 names held · selection: reselect · 0.0% in cash
Step 15 · 2020-01-02 → 2020-12-31
The institution: Frazzini-Pedersen halves at institutional financing
Portfolio book, rebalanced quarterly · 4 constructions · 516 names held · selection: reselect · 0.0% in cash
The retail hand: 20/20 extreme tails at retail financing
Portfolio book, rebalanced quarterly · 4 constructions · 83 names held · selection: reselect · 0.0% in cash
Step 16 · 2021-01-04 → 2021-12-31
The institution: Frazzini-Pedersen halves at institutional financing
Portfolio book, rebalanced quarterly · 5 constructions · 518 names held · selection: reselect · 0.0% in cash · 1 name dropped at load (519 selected, 518 held across the window), weights renormalised onto the rest
The retail hand: 20/20 extreme tails at retail financing
Portfolio book, rebalanced quarterly · 5 constructions · 78 names held · selection: reselect · 0.0% in cash · 1 name dropped at load (79 selected, 78 held across the window), weights renormalised onto the rest
Step 17 · 2022-01-03 → 2022-12-30
The institution: Frazzini-Pedersen halves at institutional financing
Portfolio book, rebalanced quarterly · 5 constructions · 515 names held · selection: reselect · 0.0% in cash
The retail hand: 20/20 extreme tails at retail financing
Portfolio book, rebalanced quarterly · 5 constructions · 74 names held · selection: reselect · 0.0% in cash
Step 18 · 2023-01-03 → 2023-12-29
The institution: Frazzini-Pedersen halves at institutional financing
Portfolio book, rebalanced quarterly · 5 constructions · 508 names held · selection: reselect · 0.0% in cash · 3 names dropped at load (511 selected, 508 held across the window), weights renormalised onto the rest
The retail hand: 20/20 extreme tails at retail financing
Portfolio book, rebalanced quarterly · 5 constructions · 58 names held · selection: reselect · 0.0% in cash
Step 19 · 2024-01-02 → 2024-12-31
The institution: Frazzini-Pedersen halves at institutional financing
Portfolio book, rebalanced quarterly · 4 constructions · 516 names held · selection: reselect · 0.0% in cash
The retail hand: 20/20 extreme tails at retail financing
Portfolio book, rebalanced quarterly · 4 constructions · 69 names held · selection: reselect · 0.0% in cash
Step 20 · 2025-01-02 → 2025-12-31
The institution: Frazzini-Pedersen halves at institutional financing
Portfolio book, rebalanced quarterly · 5 constructions · 516 names held · selection: reselect · 0.0% in cash
The retail hand: 20/20 extreme tails at retail financing
Portfolio book, rebalanced quarterly · 5 constructions · 65 names held · selection: reselect · 0.0% in cash