

Two Kinds of Crash, Two Kinds of Protection: the 200-Day Line and Volatility Targeting, 2000 to 2025
Anyone who held stocks through 2008 or March 2020 has asked the same question: is there a simple rule that gets you out before the worst of it? Two answers are famous. The 200-day line sells when the price closes below its average of the last 200 trading days. Volatility targeting holds less of the fund when its daily moves grow larger than usual, and more when they calm down.
We tested both, and both together, on SPY from 2000 and on 13 other stock, bond and gold funds, with one setting for each rule, fixed before any test ran. We measured what protection means for a person who holds through a fall: how deep the fall was, how long it took to get back to where it started, and how much growth the rule gave up over the whole 26 years.
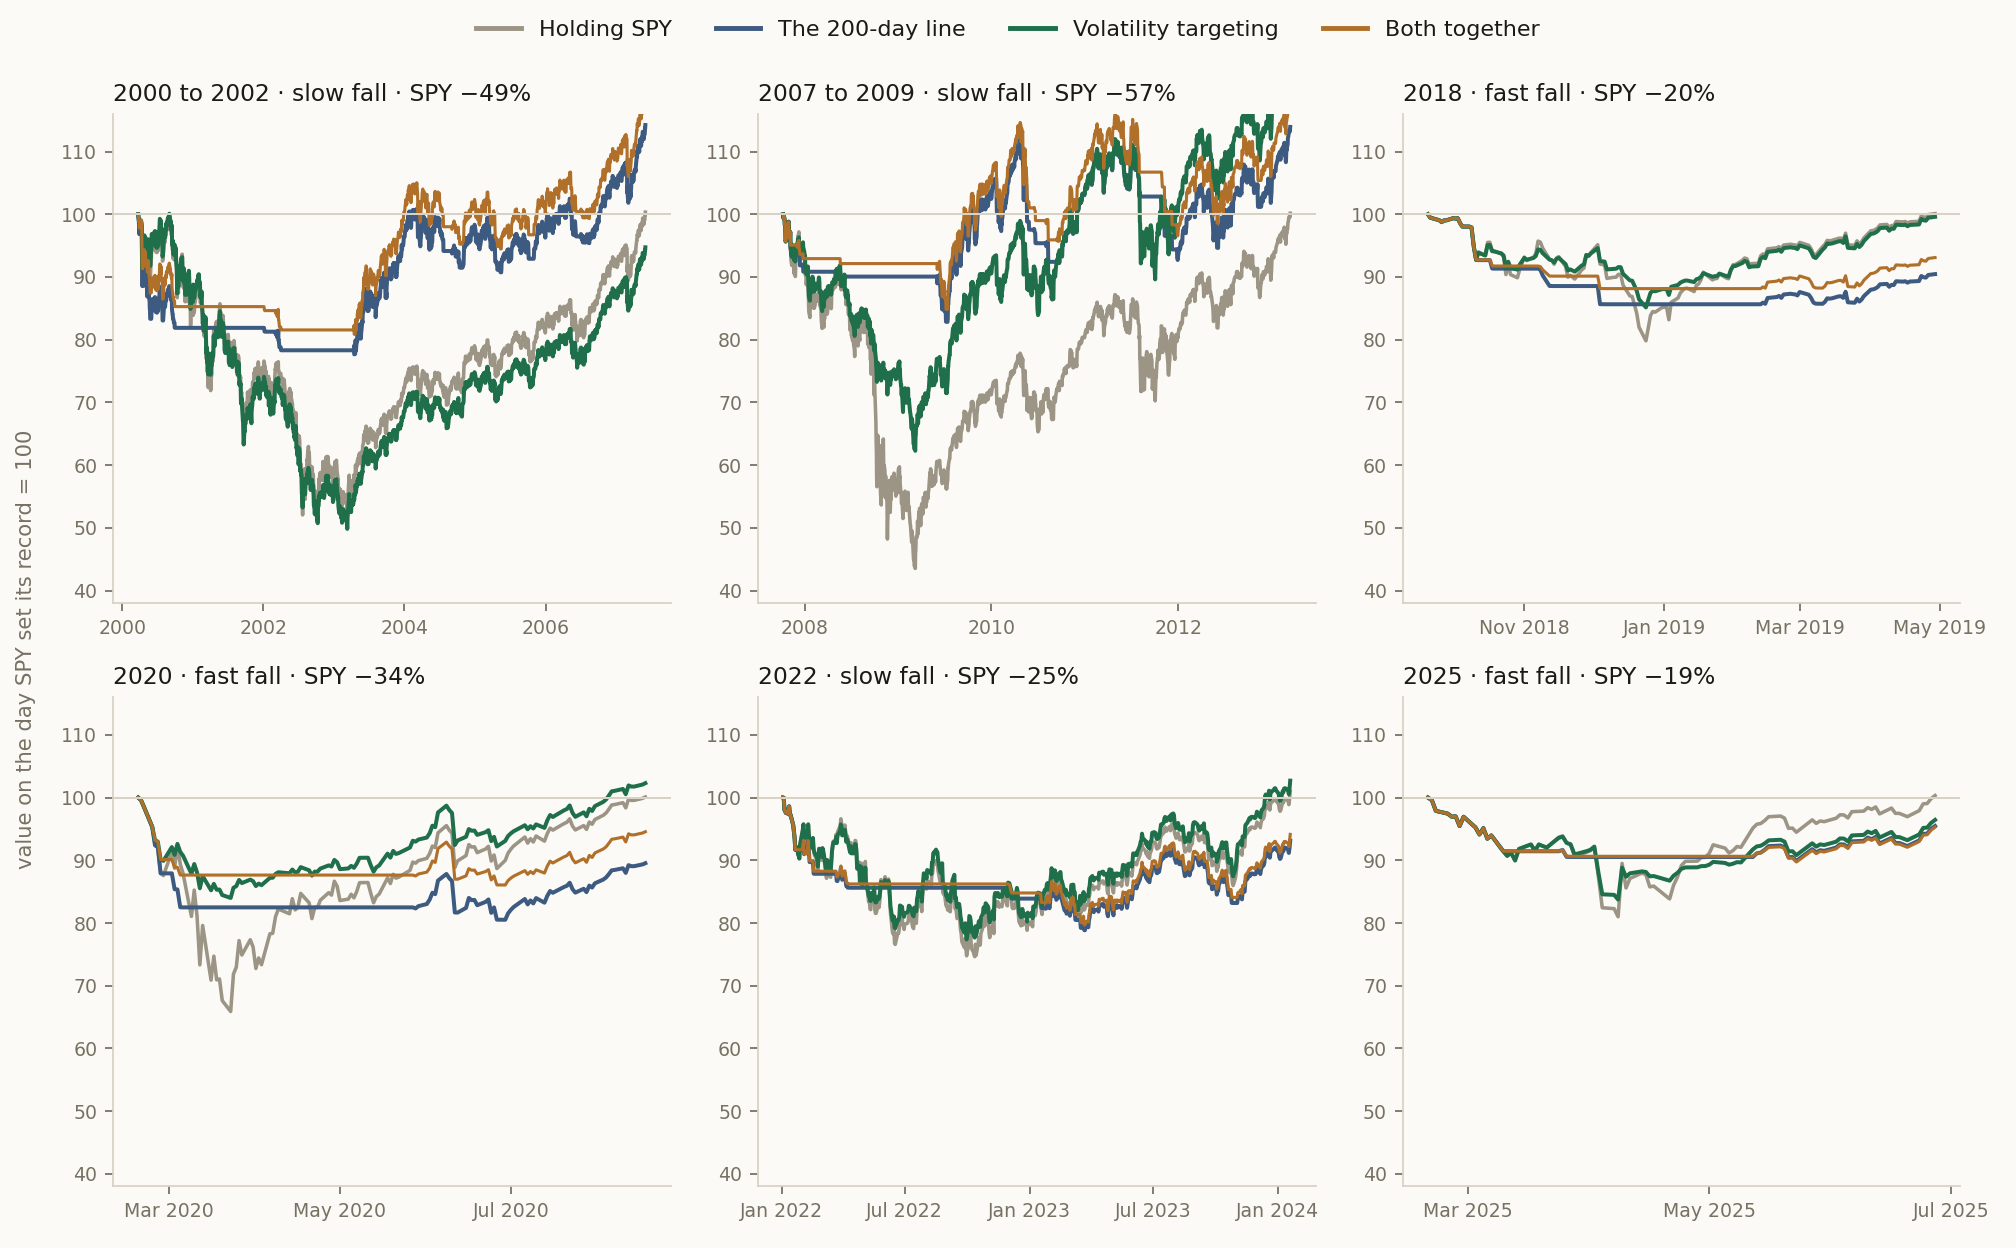
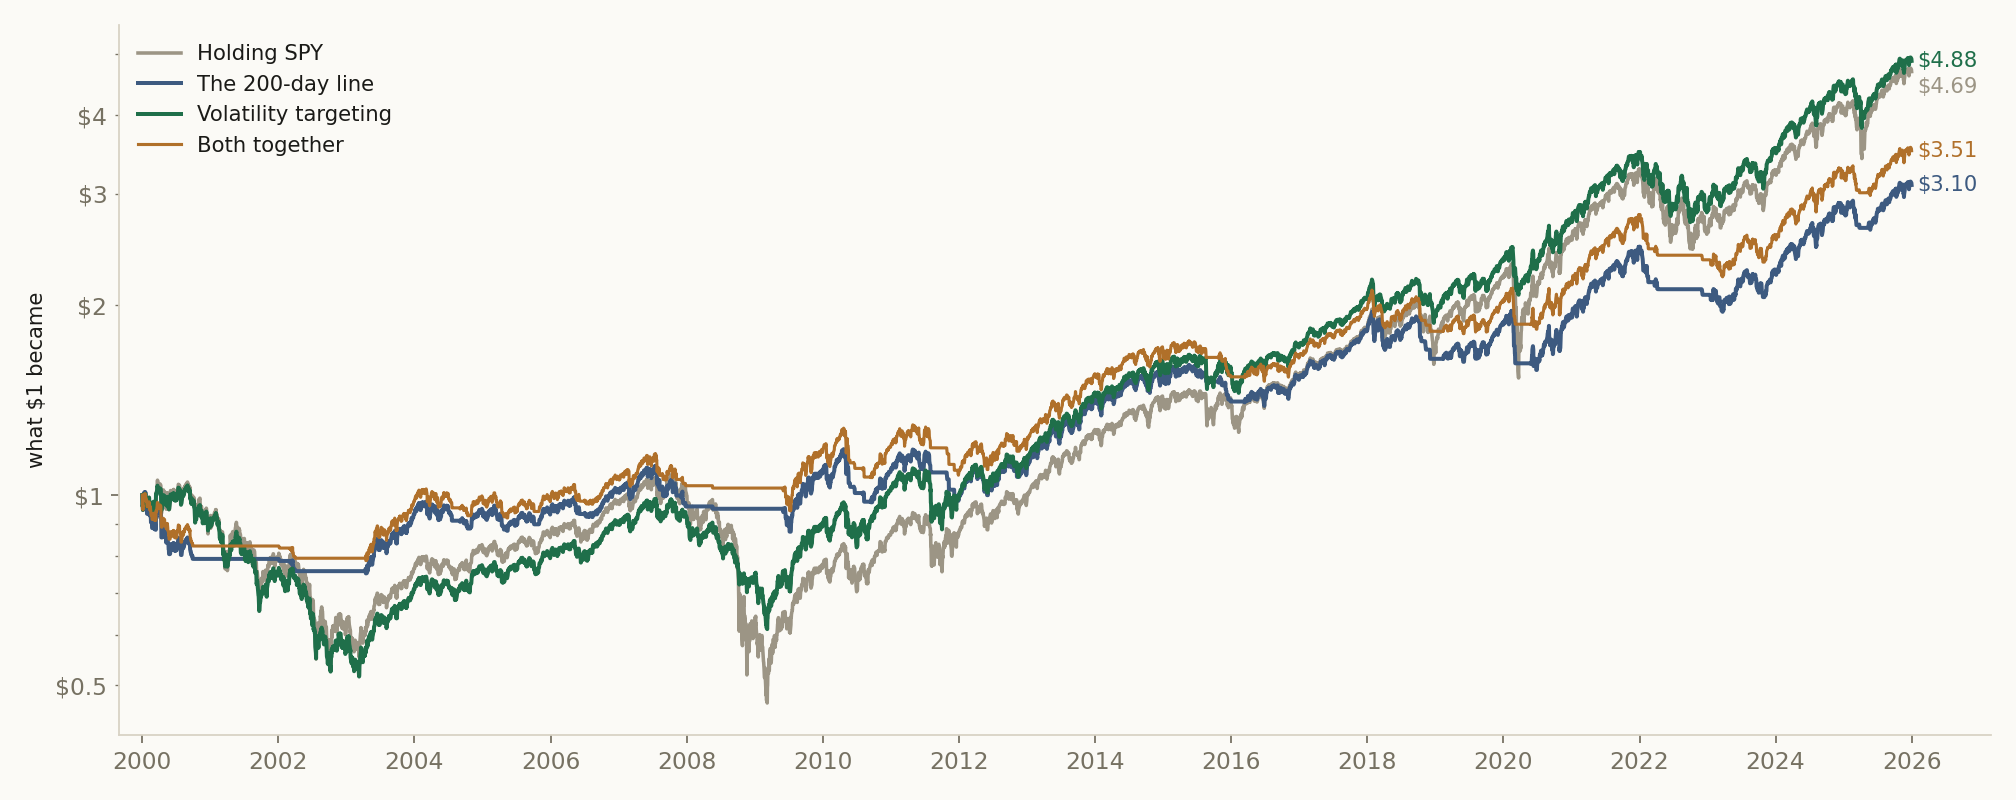
The two rules protect against different crashes. In the two great bear markets, 2000 to 2002 and 2007 to 2009, the 200-day line fell less than half as far as holding SPY and was back where it stood on SPY's record day years sooner. Volatility targeting helped in 2008 but not in 2000. In the fast crashes of 2018 and 2020, volatility targeting fell about as far as the line or less, and it was back months before it. Over the 26 years, before dividends, $1 in SPY became $4.69; with volatility targeting it became $4.88, with the 200-day line $3.10.
Why this one
Most investors who use the 200-day line think of it as crash protection. In this study it protected in the two great bear markets, 2000 to 2002 and 2007 to 2009. In a fast crash it sold when the fall was well under way and bought back after most of the rebound. Volatility targeting, the rule risk managers use to size a position by how much the market is moving, protected better in the fast crashes of 2018 and 2020.
In this paper protection has to do three things at once: make the fall smaller, make the way back shorter, and give up little growth over the years. A rule that sells after every dip shows a small worst fall, and it also misses the rises that make most of the long-run growth.
The 200-day line is the best known trend rule in investing. Chart readers watch it and financial news quotes it, and our earlier paper tested it against a Kalman filter. Volatility targeting is a professional's rule: fund managers use it to size positions, and index providers publish versions of the S&P 500 that hold less when the daily moves grow. We ran both on the same 14 funds and years as the Kalman paper, so the two papers can be read side by side.
One thing differs. The Kalman paper joined the platform's yearly tests end to end, and those leave out the first trading day of every year. This paper counts those days, so holding SPY matches SPY's own record, and each way of holding grows 0.3 to 0.4 points a year faster than on the yearly tests: holding SPY 6.1% a year here against 5.7% in the Kalman paper, the 200-day line 4.5% against 4.1%.
How the two rules work
The 200-day line watches the price. It holds the whole position while the fund closes above its average of the last 200 trading days, and it sells all of it at the first close below. It buys back at the first close above. So it acts only after the price has fallen far enough to cross that average.
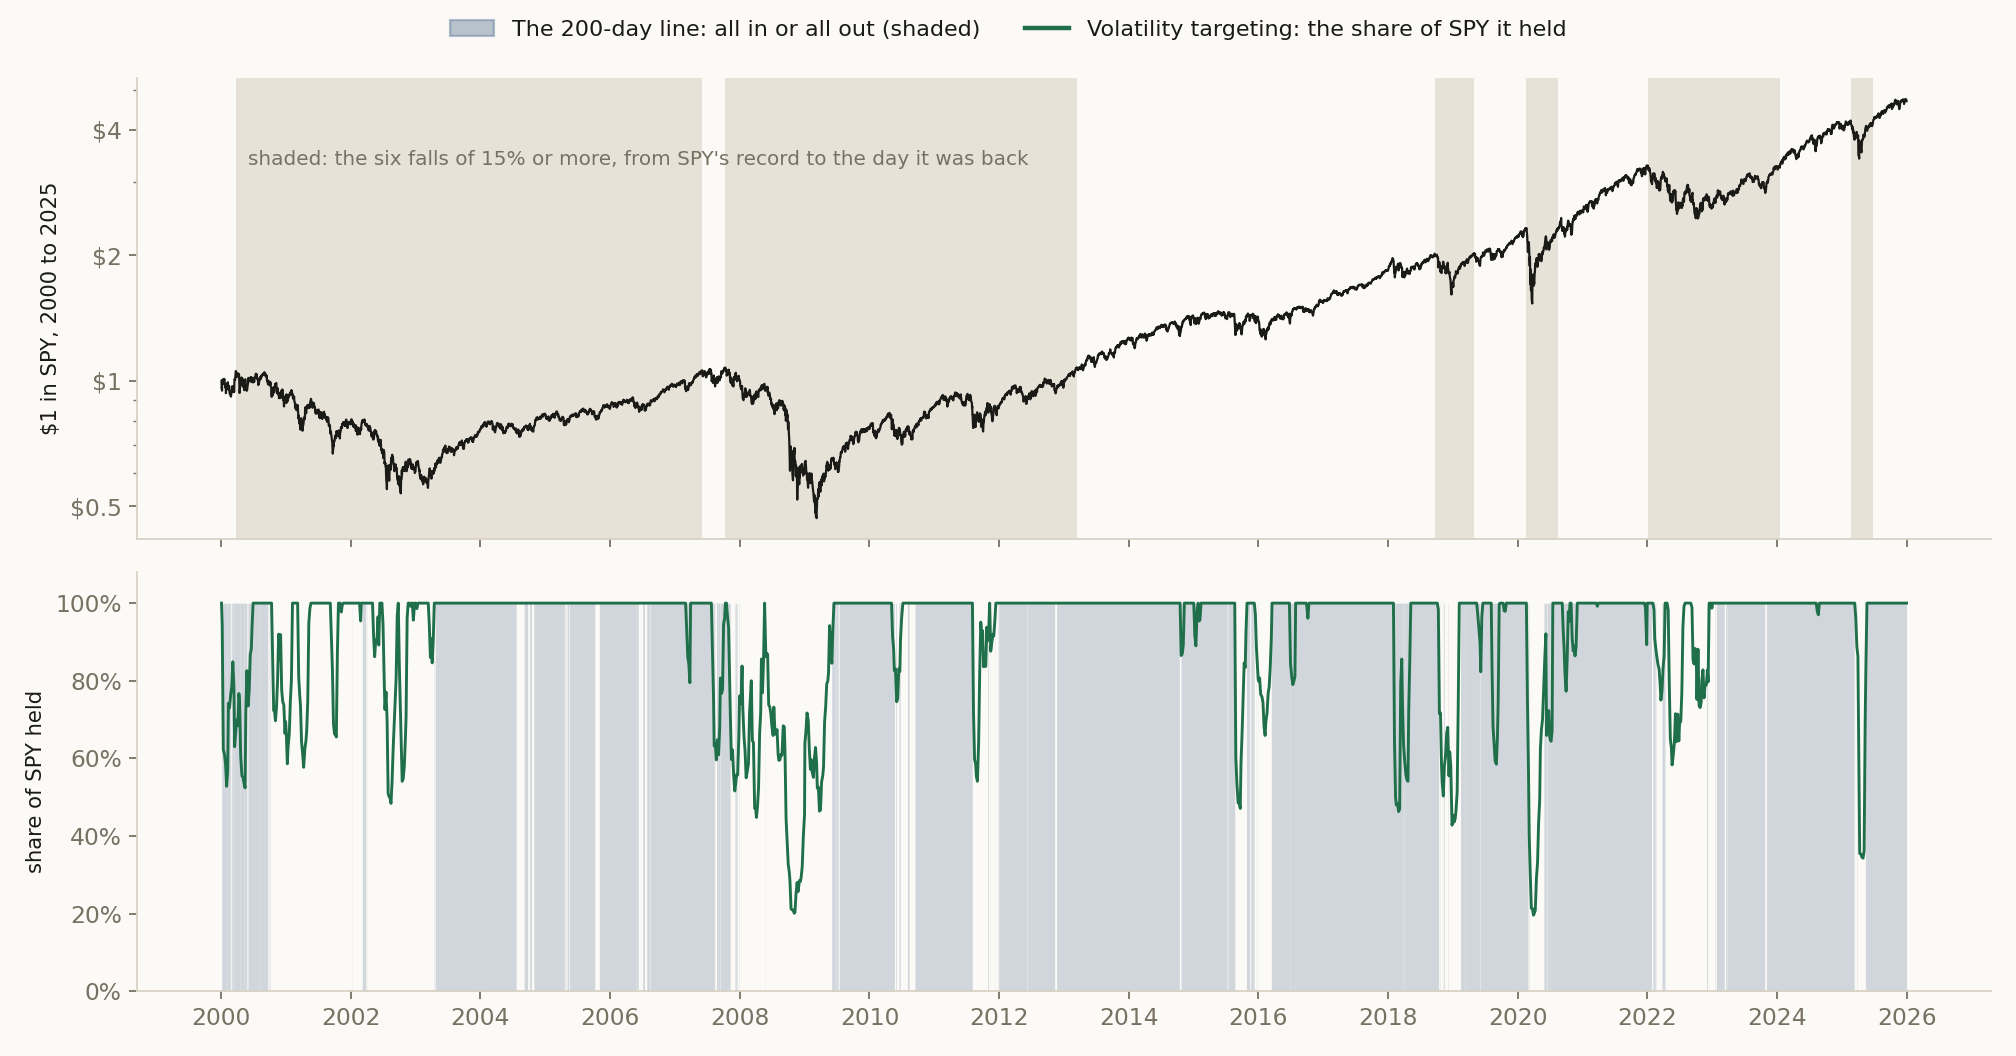
Volatility targeting watches the daily moves. At every close it compares how much the fund moved over the last 21 trading days, about a month, with how much it moved over the past five years. Then it holds the normal size of the moves divided by the recent size: if the daily moves have been twice as large as usual, it holds half the position. In this study it never holds more than the whole position, so in calm times it simply holds the fund. Over the 26 years it held 92% of SPY on average. It can act before the price has fallen far, because the daily moves often grow first. Three funds were younger than five years when their tests began: QQQ, long Treasuries and gold, with two to three and a half years of trading. For them the normal size is read from all the history they had.
Both together uses the 200-day line to decide whether to own the fund, and volatility targeting to decide how much of it to own. Every change of position, the small daily ones included, pays a trading cost.
Six falls
SPY fell 15% or more from a record close six times between 2000 and 2025. Three falls were slow: the dot-com bear market of 2000 to 2002, the financial crisis of 2007 to 2009 and the long slide of 2022. Three were fast and reached bottom within 100 days: late 2018, the Covid crash of 2020 and the tariff fall of spring 2025. The first table below has every number, each counted from the day SPY set its record.
In the two great bear markets the 200-day line protected best. In the financial crisis it fell 17% where holding fell 57%, and it was back where it started more than three years sooner. Volatility targeting cut that fall too, to 38%. In the dot-com bear market it did not help at all. That decline was slow, and its daily moves were not much larger than their five-year normal, so volatility targeting held most of SPY all the way down. When it did cut, it cut after a sharp drop and then held less in the sharp rebound that followed, as in April 2001 and October 2002. Down to SPY's low in October 2002 the savings and the misses cancelled out. It reached its own low in March 2003, a little below holding's, and it was back at its March 2000 value only in January 2011, after the next crash.
In the fast crashes of 2018 and 2020 it went the other way. In 2020 volatility targeting began to cut within a week of the record and held about a fifth of SPY at the bottom in late March. It fell 16% where holding fell 34%, and it was back at its old high about two weeks before holding. The 200-day line sold at the close of 27 February, with SPY already 12% below its record. It bought and sold twice more in the first week of March, then stayed out until 27 May, after SPY had won back most of its fall. The line was back at its old high five months after volatility targeting. In 2018 the two rules fell about as far, and volatility targeting was back seven months before the line; holding itself was back sooner than both.
Two falls did not follow this pattern. In 2025 the 200-day line fell less than volatility targeting, and both rules were back at their old highs later than holding. In 2022, a slow slide with only moderate daily moves, every way of holding SPY fell by a fifth to a quarter. The 200-day line sold and bought back seven times that year, and it was back later than holding.
Both together had the smallest fall in five of the six, and in the sixth it fell about as little as the line. After the fast crashes of 2018 and 2020, though, it was back months later than volatility targeting alone.
What each rule gave up
Over the whole 26 years, $1 held in SPY became $4.69. With volatility targeting it became $4.88: it kept all of holding's growth and a little more. With the 200-day line it became $3.10. The line was out of the market more than a quarter of the time, and it gave up 1.67 points of growth a year. Both together gave up most of what the line gave up.
Part of what the line gave up came in years when SPY moved sideways near its average. Then the line sold and bought back again and again, nearly always at a higher price than it sold: it sold 13 times in 2000 and 14 times from 2004 to 2006. From January 2004 to November 2006 SPY rose 22% and the line 4%. Counted from its own high of January 2000, which was above where it stood on SPY's record day in March, the line's longest wait for a new high lasted until November 2006, almost as long as holding's (Table 2).
So did anything beat simply holding SPY? On growth, volatility targeting did, by a small margin. On the size of the worst fall all three did, and on the headline's return for each unit of risk all three did too (Table 2).
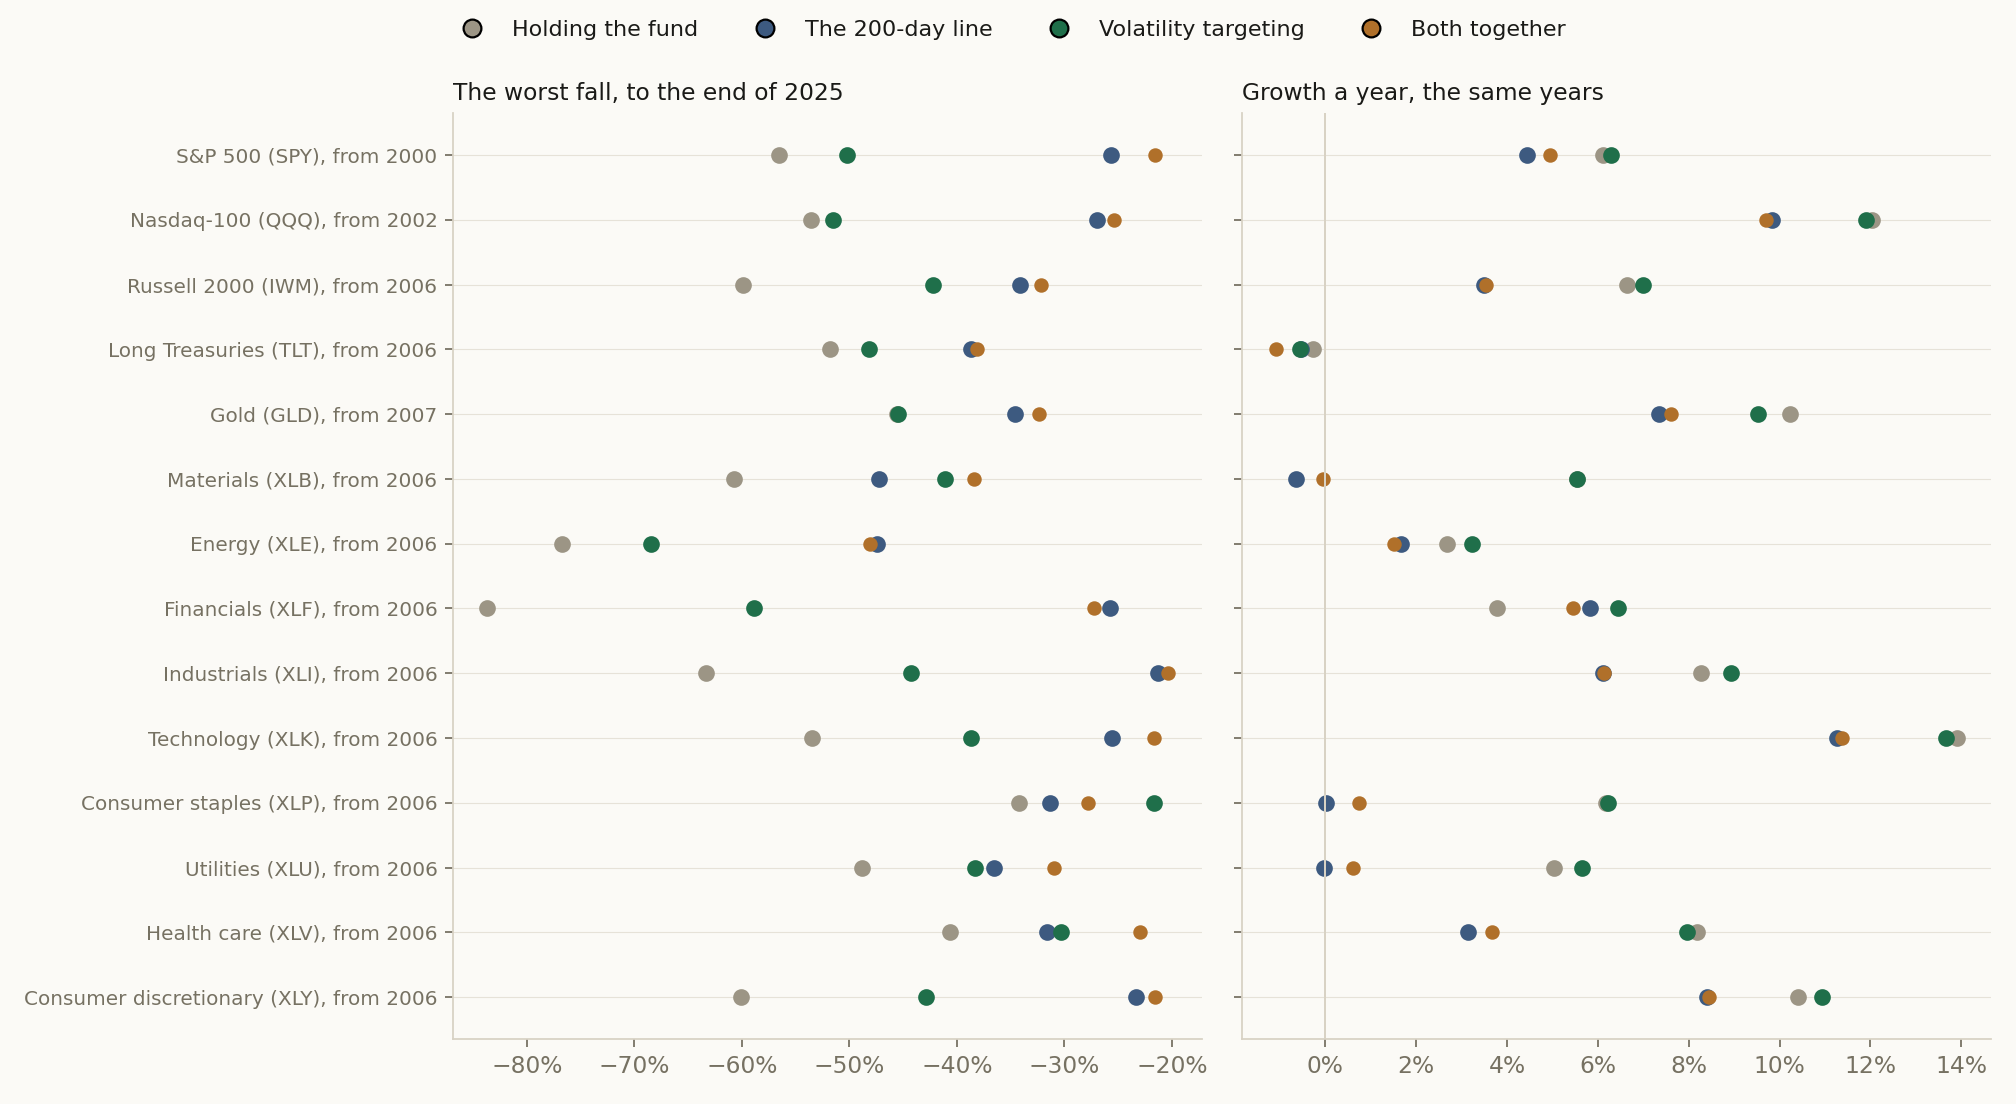
The 13 other funds show the same pattern. Volatility targeting made the worst fall smaller on all 14 funds, on gold by almost nothing, and grew at least as fast as holding on 9 of them; where it grew slower, the gap was less than a point a year. The 200-day line cut the worst fall on all 14, more than volatility targeting did on 11 of them, and it grew slower than holding on 13. The one exception is the financials fund, where being out of the 2008 bank collapse was worth more than everything the line missed.
1 Methodology, in detail (click to open)
1 Methodology
What we tested. Four ways of holding a fund. Holding it every day. The 200-day line: the whole position while the close is above its 200-day average, nothing while it is below. Volatility targeting: always in the fund, holding the normal size of its daily moves divided by the recent size, never more than the whole position. The recent size is the standard deviation of daily returns over the last 21 trading days; the normal size is the same over the past five years, or since the fund began when it is younger. Both together: the 200-day line decides whether to hold, volatility targeting how much.
Funds and years. SPY from 2000, the Nasdaq-100 fund QQQ from 2002, gold (GLD) from 2007, and from 2006 the Russell 2000 fund IWM, long Treasury bonds (TLT) and the nine sector funds of the S&P 500. These are the funds and years of our Kalman paper. All tests end on 31 December 2025.
How the tests ran. Each year was its own test, run forward from the first trading day of January to the last of December, with every setting fixed before any test ran and the same every year; the platform locked each year's test before it ran and keeps every result. Two comparisons per fund, volatility targeting against the 200-day line and both together against the 200-day line, make 28 tests; none was dropped. The 200-day line ran in both comparisons and came out the same to the cent each time. All 28 tests were locked the same way, each year before it ran, and every test also prints holding its fund beside its two rules. The record further down lists all 28 in numbers, under Every test, in numbers. The ledger in the appendix is this page's own test, volatility targeting against the 200-day line on SPY; each of the other 27 tests keeps a ledger of its own on the platform.
Prices and costs. Daily closing prices without dividends, from a licensed commercial data provider. A signal is read at the close and the position is held from that close. Every purchase and sale pays 0.02% of the amount traded, the small daily resizes of volatility targeting included. Cash earns nothing.
One continuous path. Each yearly test starts in cash and buys at the close of its first trading day, so the yearly tests joined end to end would miss the first trading day of every year, for every rule and for holding too. Our figures and tables carry each rule through those days with the share of the fund it held the day before, so holding SPY matches SPY's own record. The yearly results kept on the platform, which the headline and the record below use, leave those days out. That lowers growth by 0.3 to 0.4 points a year on SPY, deepens the worst falls of holding and volatility targeting by 1.5 points, and changes none of the comparisons in this paper. The Sharpe ratios in the SPY table are the platform's, read on those yearly records, so they match the headline. Our Kalman paper printed SPY on the yearly records too: holding 5.7% a year and the 200-day line 4.1%, against 6.1% and 4.5% here.
Measuring a fall. A fall is a drop of 15% or more from a record close of SPY. It lasts from the record close until SPY closes back at that level. It is fast when SPY's lowest close came within 100 calendar days of the record, slow otherwise. For each way of holding, the depth is the lowest value inside that span, measured from its own value on the record day, and the time back is the number of trading days from the record until it is back at that value again, counted after its lowest point. The longest wait for a new high in the SPY table is measured from each way of holding's own high to its next higher close, whenever that high was.
2 Results
2.1 Headline
Sections 2.2 to 3, the full record: every year, every test, and how each one was run (click to open)
The registration names the two groups compared The volatility target and The 200-day line; this paper calls them Volatility targeting and The 200-day line.
Table 1. The six falls of SPY: how far each fell, and how long until it was back. From the day SPY set its record close to the day it closed back at it: the deepest each way of holding fell below its own value on the record day, and the time from the record until it was back at that value. Fast: SPY reached bottom within 100 days of the record.
| Fall | Kind | Holding SPY | The 200-day line | Volatility targeting | Both together |
|---|---|---|---|---|---|
| 2000 to 2002 | slow | −49%, back in 7.2 years | −22%, back in 3.8 years | −50%, back in 10.8 years | −19%, back in 3.7 years |
| 2007 to 2009 | slow | −57%, back in 5.4 years | −17%, back in 2.0 years | −38%, back in 3.1 years | −15%, back in 23 months |
| 2018 | fast | −20%, back in 7 months | −14%, back in 16 months | −15%, back in 9 months | −12%, back in 16 months |
| 2020 | fast | −34%, back in 6 months | −20%, back in 11 months | −16%, back in 6 months | −14%, back in 9 months |
| 2022 | slow | −25%, back in 2.0 years | −21%, back in 2.2 years | −23%, back in 23 months | −20%, back in 2.2 years |
| 2025 | fast | −19%, back in 4 months | −10%, back in 6 months | −16%, back in 6 months | −10%, back in 6 months |
Table 2. SPY from January 2000 to December 2025. Prices without dividends, 0.02% a trade, cash earns nothing. Longest wait for a new high: from a high of that way of holding to its next higher close. Sharpe ratio: return for each unit of risk, on the platform's yearly records like the headline; on the continuous path the other columns follow, each is 0.02 to 0.03 higher, in the same order.
| Way of holding | $1 became | A year | Worst fall | Longest wait for a new high | Share of SPY held | Sharpe, as in the headline |
|---|---|---|---|---|---|---|
| Holding SPY | $4.69 | 6.12% | −56.5% | 7.2 years (2000 to 2007) | 100% | 0.38 |
| The 200-day line | $3.10 | 4.45% | −25.7% | 6.8 years (2000 to 2006) | 72% of the days | 0.42 |
| Volatility targeting | $4.88 | 6.28% | −50.2% | 10.3 years (2000 to 2011) | 92% on average | 0.46 |
| Both together | $3.51 | 4.95% | −21.6% | 4.0 years (2000 to 2004) | 70% on average | 0.48 |
Table 3. The 14 funds: growth a year. From the year shown to December 2025, counted as in the table for SPY.
| Fund | From | Holding | The 200-day line | Volatility targeting | Both together |
|---|---|---|---|---|---|
| S&P 500 (SPY) | 2000 | 6.1% | 4.5% | 6.3% | 5.0% |
| Nasdaq-100 (QQQ) | 2002 | 12.0% | 9.8% | 11.9% | 9.7% |
| Russell 2000 (IWM) | 2006 | 6.6% | 3.5% | 7.0% | 3.5% |
| Long Treasuries (TLT) | 2006 | −0.3% | −0.5% | −0.6% | −1.1% |
| Gold (GLD) | 2007 | 10.2% | 7.3% | 9.5% | 7.6% |
| Materials (XLB) | 2006 | 5.5% | −0.7% | 5.5% | −0.1% |
| Energy (XLE) | 2006 | 2.7% | 1.7% | 3.2% | 1.5% |
| Financials (XLF) | 2006 | 3.8% | 5.8% | 6.5% | 5.5% |
| Industrials (XLI) | 2006 | 8.3% | 6.1% | 8.9% | 6.1% |
| Technology (XLK) | 2006 | 13.9% | 11.3% | 13.7% | 11.4% |
| Consumer staples (XLP) | 2006 | 6.2% | 0.0% | 6.2% | 0.8% |
| Utilities (XLU) | 2006 | 5.0% | 0.0% | 5.7% | 0.6% |
| Health care (XLV) | 2006 | 8.2% | 3.1% | 8.0% | 3.7% |
| Consumer discretionary (XLY) | 2006 | 10.4% | 8.4% | 10.9% | 8.4% |
Table 4. The 14 funds: the worst fall. The deepest fall from a high, from the year shown to December 2025.
| Fund | From | Holding | The 200-day line | Volatility targeting | Both together |
|---|---|---|---|---|---|
| S&P 500 (SPY) | 2000 | −56.5% | −25.7% | −50.2% | −21.6% |
| Nasdaq-100 (QQQ) | 2002 | −53.6% | −27.0% | −51.5% | −25.4% |
| Russell 2000 (IWM) | 2006 | −59.9% | −34.1% | −42.2% | −32.2% |
| Long Treasuries (TLT) | 2006 | −51.8% | −38.7% | −48.2% | −38.1% |
| Gold (GLD) | 2007 | −45.6% | −34.6% | −45.5% | −32.4% |
| Materials (XLB) | 2006 | −60.7% | −47.2% | −41.1% | −38.4% |
| Energy (XLE) | 2006 | −76.7% | −47.4% | −68.4% | −48.1% |
| Financials (XLF) | 2006 | −83.7% | −25.8% | −58.9% | −27.2% |
| Industrials (XLI) | 2006 | −63.3% | −21.3% | −44.3% | −20.4% |
| Technology (XLK) | 2006 | −53.5% | −25.6% | −38.7% | −21.7% |
| Consumer staples (XLP) | 2006 | −34.2% | −31.3% | −21.7% | −27.8% |
| Utilities (XLU) | 2006 | −48.8% | −36.5% | −38.3% | −31.0% |
| Health care (XLV) | 2006 | −40.6% | −31.6% | −30.3% | −23.0% |
| Consumer discretionary (XLY) | 2006 | −60.1% | −23.3% | −42.9% | −21.6% |
2.2 Per-step results
| # | Out-of-sample window | Volatility targeting SR | The 200-day line SR |
|---|---|---|---|
| 1 | 2000-01-03 → 2000-12-29 | -0.44 | -1.18 |
| 2 | 2001-01-02 → 2001-12-31 | -0.85 | n/a |
| 3 | 2002-01-02 → 2002-12-31 | -1.23 | -1.55 |
| 4 | 2003-01-02 → 2003-12-31 | 1.31 | 1.89 |
| 5 | 2004-01-02 → 2004-12-31 | 0.80 | 0.21 |
| 6 | 2005-01-03 → 2005-12-30 | 0.39 | -0.09 |
| 7 | 2006-01-03 → 2006-12-29 | 1.18 | 0.88 |
| 8 | 2007-01-03 → 2007-12-31 | 0.27 | -0.34 |
| 9 | 2008-01-02 → 2008-12-31 | -1.25 | -1.03 |
| 10 | 2009-01-02 → 2009-12-31 | 0.97 | 1.08 |
| 11 | 2010-01-04 → 2010-12-31 | 0.76 | -0.01 |
| 12 | 2011-01-03 → 2011-12-30 | -0.08 | -0.96 |
| 13 | 2012-01-03 → 2012-12-31 | 0.94 | 0.83 |
| 14 | 2013-01-02 → 2013-12-31 | 2.22 | 2.22 |
| 15 | 2014-01-02 → 2014-12-31 | 1.04 | 0.96 |
| 16 | 2015-01-02 → 2015-12-31 | -0.07 | -0.88 |
| 17 | 2016-01-04 → 2016-12-30 | 0.88 | 0.89 |
| 18 | 2017-01-03 → 2017-12-29 | 2.58 | 2.58 |
| 19 | 2018-01-02 → 2018-12-31 | -0.42 | -0.76 |
| 20 | 2019-01-02 → 2019-12-31 | 1.85 | 1.21 |
| 21 | 2020-01-02 → 2020-12-31 | 0.93 | 0.26 |
| 22 | 2021-01-04 → 2021-12-31 | 2.00 | 2.02 |
| 23 | 2022-01-03 → 2022-12-30 | -0.90 | -2.46 |
| 24 | 2023-01-03 → 2023-12-29 | 1.77 | 0.82 |
| 25 | 2024-01-02 → 2024-12-31 | 1.77 | 1.78 |
| 26 | 2025-01-02 → 2025-12-31 | 0.84 | 1.00 |
2.2b Every test, in numbers
Every test this paper registered, two rows each, the paper’s own test first.
| Walk | Windows | Span | Growth | CAGR | Worst drawdown | Pooled Sharpe |
|---|---|---|---|---|---|---|
| SPY · volatility targeting (this paper, the one the platform opens) | 26 | 2000-01-03 → 2025-12-31 | +341.9% | +5.9% | -51.7% | 0.46 |
| SPY · the 200-day line (this paper, the one the platform opens) | 26 | 2000-01-03 → 2025-12-31 | +187.1% | +4.1% | -25.7% | 0.42 |
| TLT · volatility targeting | 20 | 2006-01-03 → 2025-12-31 | -9.0% | -0.5% | -47.3% | 0.03 |
| TLT · the 200-day line | 20 | 2006-01-03 → 2025-12-31 | -5.8% | -0.3% | -36.7% | 0.03 |
| QQQ · volatility targeting | 24 | 2002-01-02 → 2025-12-31 | +1212.3% | +11.3% | -51.5% | 0.66 |
| QQQ · the 200-day line | 24 | 2002-01-02 → 2025-12-31 | +836.2% | +9.8% | -25.9% | 0.70 |
| TLT · both together | 20 | 2006-01-03 → 2025-12-31 | -16.3% | -0.9% | -36.1% | -0.06 |
| TLT · the 200-day line, second run | 20 | 2006-01-03 → 2025-12-31 | -5.8% | -0.3% | -36.7% | 0.03 |
| QQQ · both together | 24 | 2002-01-02 → 2025-12-31 | +810.1% | +9.6% | -24.3% | 0.72 |
| QQQ · the 200-day line, second run | 24 | 2002-01-02 → 2025-12-31 | +836.2% | +9.8% | -25.9% | 0.70 |
| SPY · both together | 26 | 2000-01-03 → 2025-12-31 | +225.4% | +4.6% | -21.6% | 0.48 |
| SPY · the 200-day line, second run | 26 | 2000-01-03 → 2025-12-31 | +187.1% | +4.1% | -25.7% | 0.42 |
| XLB · volatility targeting | 20 | 2006-01-03 → 2025-12-31 | +178.8% | +5.3% | -41.7% | 0.37 |
| XLB · the 200-day line | 20 | 2006-01-03 → 2025-12-31 | -14.4% | -0.8% | -46.7% | 0.02 |
| GLD · volatility targeting | 19 | 2007-01-03 → 2025-12-31 | +382.0% | +8.6% | -48.2% | 0.62 |
| GLD · the 200-day line | 19 | 2007-01-03 → 2025-12-31 | +251.0% | +6.8% | -34.6% | 0.55 |
| IWM · volatility targeting | 20 | 2006-01-03 → 2025-12-31 | +266.5% | +6.7% | -42.3% | 0.43 |
| IWM · the 200-day line | 20 | 2006-01-03 → 2025-12-31 | +88.5% | +3.2% | -34.2% | 0.29 |
| XLB · both together | 20 | 2006-01-03 → 2025-12-31 | -3.8% | -0.2% | -38.0% | 0.06 |
| XLB · the 200-day line, second run | 20 | 2006-01-03 → 2025-12-31 | -14.4% | -0.8% | -46.7% | 0.02 |
| GLD · both together | 19 | 2007-01-03 → 2025-12-31 | +270.1% | +7.1% | -32.4% | 0.62 |
| GLD · the 200-day line, second run | 19 | 2007-01-03 → 2025-12-31 | +251.0% | +6.8% | -34.6% | 0.55 |
| IWM · both together | 20 | 2006-01-03 → 2025-12-31 | +89.9% | +3.3% | -32.2% | 0.30 |
| IWM · the 200-day line, second run | 20 | 2006-01-03 → 2025-12-31 | +88.5% | +3.2% | -34.2% | 0.29 |
| XLE · volatility targeting | 20 | 2006-01-03 → 2025-12-31 | +64.9% | +2.5% | -70.0% | 0.23 |
| XLE · the 200-day line | 20 | 2006-01-03 → 2025-12-31 | +37.2% | +1.6% | -45.5% | 0.18 |
| XLV · volatility targeting | 20 | 2006-01-03 → 2025-12-31 | +336.1% | +7.6% | -30.3% | 0.61 |
| XLV · the 200-day line | 20 | 2006-01-03 → 2025-12-31 | +78.0% | +2.9% | -31.8% | 0.32 |
| XLK · volatility targeting | 20 | 2006-01-03 → 2025-12-31 | +1137.5% | +13.4% | -38.6% | 0.80 |
| XLK · the 200-day line | 20 | 2006-01-03 → 2025-12-31 | +745.2% | +11.3% | -25.6% | 0.77 |
| XLE · both together | 20 | 2006-01-03 → 2025-12-31 | +33.0% | +1.4% | -46.2% | 0.17 |
| XLE · the 200-day line, second run | 20 | 2006-01-03 → 2025-12-31 | +37.2% | +1.6% | -45.5% | 0.18 |
| XLF · volatility targeting | 20 | 2006-01-03 → 2025-12-31 | +215.6% | +5.9% | -58.6% | 0.39 |
| XLF · the 200-day line | 20 | 2006-01-03 → 2025-12-31 | +182.2% | +5.3% | -26.5% | 0.45 |
| XLV · both together | 20 | 2006-01-03 → 2025-12-31 | +96.9% | +3.4% | -23.2% | 0.38 |
| XLV · the 200-day line, second run | 20 | 2006-01-03 → 2025-12-31 | +78.0% | +2.9% | -31.8% | 0.32 |
| XLK · both together | 20 | 2006-01-03 → 2025-12-31 | +758.8% | +11.4% | -20.1% | 0.82 |
| XLK · the 200-day line, second run | 20 | 2006-01-03 → 2025-12-31 | +745.2% | +11.3% | -25.6% | 0.77 |
| XLF · both together | 20 | 2006-01-03 → 2025-12-31 | +163.4% | +5.0% | -27.9% | 0.43 |
| XLF · the 200-day line, second run | 20 | 2006-01-03 → 2025-12-31 | +182.2% | +5.3% | -26.5% | 0.45 |
| XLY · volatility targeting | 20 | 2006-01-03 → 2025-12-31 | +653.8% | +10.6% | -43.4% | 0.69 |
| XLY · the 200-day line | 20 | 2006-01-03 → 2025-12-31 | +375.3% | +8.1% | -25.4% | 0.64 |
| XLP · volatility targeting | 20 | 2006-01-03 → 2025-12-31 | +237.7% | +6.3% | -21.2% | 0.59 |
| XLP · the 200-day line | 20 | 2006-01-03 → 2025-12-31 | +6.3% | +0.3% | -31.1% | 0.08 |
| XLI · volatility targeting | 20 | 2006-01-03 → 2025-12-31 | +431.5% | +8.7% | -44.5% | 0.60 |
| XLI · the 200-day line | 20 | 2006-01-03 → 2025-12-31 | +224.9% | +6.1% | -20.5% | 0.52 |
| XLY · both together | 20 | 2006-01-03 → 2025-12-31 | +381.5% | +8.2% | -22.9% | 0.66 |
| XLY · the 200-day line, second run | 20 | 2006-01-03 → 2025-12-31 | +375.3% | +8.1% | -25.4% | 0.64 |
| XLP · both together | 20 | 2006-01-03 → 2025-12-31 | +22.1% | +1.0% | -27.5% | 0.16 |
| XLP · the 200-day line, second run | 20 | 2006-01-03 → 2025-12-31 | +6.3% | +0.3% | -31.1% | 0.08 |
| XLI · both together | 20 | 2006-01-03 → 2025-12-31 | +224.0% | +6.1% | -20.1% | 0.54 |
| XLI · the 200-day line, second run | 20 | 2006-01-03 → 2025-12-31 | +224.9% | +6.1% | -20.5% | 0.52 |
| XLU · volatility targeting | 20 | 2006-01-03 → 2025-12-31 | +213.2% | +5.9% | -38.8% | 0.46 |
| XLU · the 200-day line | 20 | 2006-01-03 → 2025-12-31 | +6.6% | +0.3% | -33.7% | 0.09 |
| XLU · both together | 20 | 2006-01-03 → 2025-12-31 | +20.3% | +0.9% | -28.5% | 0.14 |
| XLU · the 200-day line, second run | 20 | 2006-01-03 → 2025-12-31 | +6.6% | +0.3% | -33.7% | 0.09 |
| platform reference (SPY) (benchmark) | 2000-01-03 → 2025-12-31 | +322.4% | +5.7% | -58.0% |
Growth and CAGR above are each walk over its own windows, so they are not comparable across walks with different window counts: a walk that excluded a window did not live through it. The figure rebases every line on the session all of them share.
2.3 Search accounting
This paper's search is a declared family: the paper's 28 walks, counted at N = 28 evaluated books. Every member is either a registered walk with its own hypothesis and frozen record, or a derived average computed from those frozen records; every member is reported, in the family table, and none was selected away. The count is declared by the author rather than derived from one project's ledger, because the members are sibling registered studies; the declaration names them and is frozen in this artifact. What the source strategy's author searched before publishing is not knowable from here and is not counted. The registered per-step record below still guarantees each window's hypothesis was hashed and registered before that window was scored.
2.4 The comparison
Both arms trade the same registered windows, so their returns can be PAIRED: inside each window the two return series are inner-joined date by date and the difference rVolatility targeting − rThe 200-day line is the object under test. Because this is ONE pre-declared contrast, frozen at registration before any window was scored, the paired statistic needs no multiple-testing deflation; the arm-level records carry the declared family count of §2.3 as their search accounting, and this contrast, registered per window before scoring, is not multiplied by it.
In the table: Arm A = Volatility targeting · Arm B = The 200-day line.
| # | Window | Paired bars | Arm A | Arm B | Δ | Leader |
|---|---|---|---|---|---|---|
| 1 | 2000-01-04 → 2000-12-29 | 251 | -9.8% | -20.8% | +11.0 pp | Arm A |
| 2 | 2001-01-03 → 2001-12-31 | 247 | -16.3% | +0.0% | -16.3 pp | Arm B |
| 3 | 2002-01-03 → 2002-12-31 | 251 | -24.9% | -4.4% | -20.5 pp | Arm B |
| 4 | 2003-01-03 → 2003-12-31 | 251 | +21.7% | +23.2% | -1.5 pp | Arm B |
| 5 | 2004-01-05 → 2004-12-31 | 251 | +8.7% | +1.6% | +7.1 pp | Arm A |
| 6 | 2005-01-04 → 2005-12-30 | 251 | +3.5% | -1.2% | +4.7 pp | Arm A |
| 7 | 2006-01-04 → 2006-12-29 | 250 | +11.8% | +7.2% | +4.6 pp | Arm A |
| 8 | 2007-01-04 → 2007-12-31 | 250 | +2.7% | -5.4% | +8.0 pp | Arm A |
| 9 | 2008-01-03 → 2008-12-31 | 252 | -19.4% | -0.9% | -18.6 pp | Arm B |
| 10 | 2009-01-05 → 2009-12-31 | 251 | +18.7% | +13.7% | +5.0 pp | Arm A |
| 11 | 2010-01-05 → 2010-12-31 | 251 | +12.2% | -1.0% | +13.2 pp | Arm A |
| 12 | 2011-01-04 → 2011-12-30 | 251 | -3.7% | -11.0% | +7.3 pp | Arm A |
| 13 | 2012-01-04 → 2012-12-31 | 249 | +11.7% | +9.9% | +1.8 pp | Arm A |
| 14 | 2013-01-03 → 2013-12-31 | 251 | +26.4% | +26.4% | +0.0 pp | tie |
| 15 | 2014-01-03 → 2014-12-31 | 251 | +11.6% | +10.3% | +1.4 pp | Arm A |
| 16 | 2015-01-05 → 2015-12-31 | 251 | -1.9% | -9.1% | +7.1 pp | Arm A |
| 17 | 2016-01-05 → 2016-12-30 | 251 | +10.0% | +8.2% | +1.8 pp | Arm A |
| 18 | 2017-01-04 → 2017-12-29 | 250 | +18.5% | +18.5% | +0.0 pp | tie |
| 19 | 2018-01-03 → 2018-12-31 | 250 | -5.9% | -10.2% | +4.3 pp | Arm A |
| 20 | 2019-01-03 → 2019-12-31 | 251 | +21.3% | +13.5% | +7.9 pp | Arm A |
| 21 | 2020-01-03 → 2020-12-31 | 252 | +15.6% | +3.0% | +12.7 pp | Arm A |
| 22 | 2021-01-05 → 2021-12-31 | 251 | +28.5% | +28.8% | -0.3 pp | Arm B |
| 23 | 2022-01-04 → 2022-12-30 | 250 | -18.6% | -16.1% | -2.5 pp | Arm B |
| 24 | 2023-01-04 → 2023-12-29 | 249 | +24.8% | +9.4% | +15.4 pp | Arm A |
| 25 | 2024-01-03 → 2024-12-31 | 251 | +23.9% | +24.0% | -0.1 pp | Arm B |
| 26 | 2025-01-03 → 2025-12-31 | 249 | +12.1% | +11.0% | +1.1 pp | Arm A |
Paired Sharpe of the difference track: 0.20 · block bootstrap (2000 paths, block 10, seed 1234): P(Volatility targeting beats The 200-day line) = 87.0%.
Window win-rate. Volatility targeting led 17 of 26 windows (65.4%), The 200-day line led 7, and 2 windows were ties, and the mean window gap of +2.09 pp points the same way. Widest single window: 2002 at -20.5 pp.
3 The circuit
The strategy is a circuit of platform primitives, frozen when the study is registered. Below is the circuit as wired on the canvas, the objective it encodes and how the search runs through it, followed by the mathematics each primitive actually computes, the same formulas the execution engine runs. The complete parameterisation is preserved in the study ledger (Appendix A).
The sentence below is the registered design with its rules in plain words; the exact registration record is in Appendix A2; the authored description of the design is Section 1.
A COMPARATIVE study: The volatility target vs The 200-day line, walked on the same registered out-of-sample windows. The volatility target: SPY, bought when always, every trading day; sell when never, and forward-tested out-of-sample from the anchor: the rule set is frozen at the anchor, with no in-sample re-optimization. The 200-day line: SPY, bought when the close is above its 200-day average; sell when the close is below its 200-day average, and forward-tested out-of-sample from the anchor: the rule set is frozen at the anchor, with no in-sample re-optimization. The arms differ in 2 nodes across 6 recorded settings: Signal Module, config (entry · indicator: every_day → sma; entry · operator: above → price_above; entry · length:, → 200; entry · value: 0.5 →, ; …); Volatility Target, removed in The 200-day line. NOTE: with more than one difference, an out-of-sample gap cannot be attributed to any single change. The contrast under test: whether The volatility target generates better risk-adjusted returns than The 200-day line over the identical out-of-sample windows.
Every block in this study is a card from the platform's catalog: the fund and its price loader, the Signal Module (the 200-day average, or Every trading day for volatility targeting, which is always in the fund), the Signal Forward Test, one year at a time, the Transaction Cost card, and the new Volatility Target card, which sets how much of the fund to hold from the size of its recent and normal daily moves. A reader can rebuild every test and change any setting.
Envelopes show counts, ratios, dates, and the parameters the author chose. Full price and per-name data series are not republished: the underlying market data is licensed to QuanterLab. Point figures quoted in the prose, a named holding's return over a stated span, are summary facts derived from public market prices, not redistributed series.
The objective and the search
The volatility target
| Universe | Single ticker SPY with 365 days (~1.0y) of price history. |
|---|---|
| Signal generation | buy when always, every trading day; sell when never. |
| Validation & out-of-sample | signal forward test (1y horizon from the anchor); overlays: Transaction Cost, Volatility Target. |
The 200-day line
| Signal generation | buy when the close is above its 200-day average; sell when the close is below its 200-day average. |
|---|---|
| Validation & out-of-sample | signal forward test (1y horizon from the anchor); overlays: Transaction Cost. |
Every other specification row is identical to The volatility target's table above.
What differs between the arms, 2 differences; more than one thing changes at once:
-
paramSignal Module, config
- · buy when: always, every trading day (Volatility targeting); the close is above its 200-day average (The 200-day line)
- · sell when: never (Volatility targeting); the close is below its 200-day average (The 200-day line)
- removedVolatility Target, removed in The 200-day line
Reader's note. With 2 settings changed at once across 2 nodes, an out-of-sample gap between the arms cannot be attributed to any single change, the arms are compared as whole packages, and any causal reading of one ingredient is unsupported by this design.
Cost elements are wired into the circuit.
Show the mathematics, 6 primitives, formulas and parity notes
3.1 Ticker
A single instrument symbol, the seed of a single-name circuit.
No math. It just names one stock and hands the symbol to a Ticker Price Loader, which fetches its price history.
A constant: one ticker string. The computation lives downstream in the loader and the signal.
3.2 Ticker Price Loader
Single-ticker OHLCV loader, the deep window a signal needs.
Same as the bulk loader but for one name, fetching a deep lifecycle window so an indicator or stochastic signal has enough history to warm up.
One ticker's OHLCV up to the anchor, length set by the strategy's warm-up requirement.
P = \{(o,h,l,c,v)_\tau : \tau \le t\}3.3 Signal Module
The entry / exit rule, turn indicators into a per-bar trade signal.
Composes indicators (RSI, moving averages, …) with comparison and logic operators into a rule that says enter, exit, or hold each bar. The rule is emitted as a portable config the optimizer tunes and the walk-forward validates, so what you design is exactly what gets traded.
\text{signal}_t = \begin{cases} +1 & \text{entry rule true} \\ 0 & \text{exit rule true} \\ \text{hold} & \text{otherwise}\end{cases}3.4 Backtest Validator
Forward-test the winning rule on unseen, out-of-sample data.
Takes the wired rule config (the Walk-Forward validated config wins, else the optimized config, else the raw signal config) and trades it FORWARD on the out-of-sample window to the right of the anchor, data it never saw during optimization, re-deriving the regime as-of each bar. It produces the true out-of-sample equity curve, trades and statistics: the signal-path twin of the Portfolio Forward Test, not an in-sample replay.
E_t = E_{t-1}\,(1 + r_t),\qquad \text{Sharpe} = \frac{\bar r - r_f}{\sigma_r}\sqrt{252}3.5 Transaction Cost
Charge for trading, slippage + commission on every turn.
Real trading isn't free. This deducts a cost proportional to how much you trade (turnover), in basis points, so the backtest reflects net, not gross, performance.
\text{cost}_t = \frac{\text{bps}}{10{,}000}\;\times\;\text{turnover}_t, \qquad \text{turnover}_t = \tfrac12\sum_i \lvert w_{i,t}-w_{i,t^-}\rvert3.6 Volatility Target
Hold less when the fund gets jumpy, all of it when it is calm.
Each close it compares how much the fund moved over the recent days with how much it normally moves, and holds normal divided by recent of the position over the next session. Twice as jumpy as normal holds half; it never holds more than the cap, so it never borrows. Every resize pays the transaction cost. It reads the fund's own price, not the strategy's results.
w_{t+1} = \min\!\left(\frac{\sigma_{\text{normal},t}}{\sigma_{\text{recent},t}},\; c\right)4 Discussion
4.1 Findings
The two great bear markets: the 200-day line protected best. In 2000 to 2002 and 2007 to 2009 it fell less than half as far as holding SPY and was back where it stood on SPY's record day years sooner (Table 1). In the third slow fall, 2022, it was back later than holding. Volatility targeting cut the 2008 fall from 57% to 38% but did not help in 2000 to 2002.
Sideways years: the 200-day line sold and bought back again and again, and its longest wait for a new high, counted from its own high of January 2000, was almost as long as holding's (Table 2).
The fast crashes of 2018 and 2020: volatility targeting was back first among the rules. It fell about as far as the 200-day line or less and was back months before it. In 2020 it fell 16% where holding fell 34%.
Two exceptions. In 2025, the third fast fall, the 200-day line fell less than volatility targeting, and all three rules were back in about six months. In 2022 every way of holding SPY fell by a fifth to a quarter.
The 26 years on SPY. Volatility targeting grew a little faster than holding, $1 becoming $4.88 against $4.69 before dividends, with a smaller worst fall. The 200-day line had less than half of holding's worst fall and grew 1.67 points a year slower (Table 2).
The 14 funds. Volatility targeting cut the worst fall on all 14 and grew at least as fast as holding on 9. The 200-day line cut the worst fall on all 14, more than volatility targeting on 11, and grew slower than holding on 13 (Tables 3 and 4).
4.2 Interpretation
The six falls came in two kinds, and in the clearest cases each rule protected best against one kind. In a great bear market the price falls for years and stays far below its average. The 200-day line suits that case: it waits for the price to cross its average, and in a long fall there is time to wait. In a crash like 2020 the daily moves jump first and the price follows within days. Volatility targeting suits that case. It reads the daily moves, so in 2020 it already held less while SPY was still near its high, and it bought back step by step as the moves calmed down.
Each rule also has a blind spot. The 200-day line is late in a fast crash. It sells only after the price has already fallen to its average, it can buy and sell several times while the price jumps around that average, and it buys back only after most of the rebound. In a market that moves sideways near its average, or falls slowly with rallies above it as in 2022, it sells and buys back again and again, losing a little each time. Volatility targeting protects only when the daily moves jump. In 2000 to 2002 they stayed close to their normal size most of the time, and it did not help: its wait for a new high, from 2000 to 2011, was the longest of the four. In the autumn of 2008 they jumped to several times their normal size, and it cut that fall by a third. Big up days count as moves too, so after the lows of 2018 and 2025 it held less in the first weeks of the rebound, and holding was back at its old high first.
For managing risk this gives a plain choice. If the fear is a long bear market that takes years to recover from, the 200-day line protects: in both great bear markets it was back where it started years before holding. It gives up growth to do it, in the rebounds it misses and in the sideways years. If the fear is a sudden crash that makes people sell at the bottom, volatility targeting softens it, and on SPY it gave up no growth at all. Together they gave the smallest falls and gave up most of what the line gave up.
A smaller fall also matters for a reason the tables do not show: it is easier to hold through, and an investor who sells at the bottom keeps the whole fall.
Where this study stops. Each rule ran with one setting, chosen before the tests and never tuned. Other settings may protect differently, and anyone can try them in the lab. Dividends and interest on cash are not counted: holding would gain more from dividends, and the line, out of the market more than a quarter of the time, would have earned interest in the years when cash paid. The next questions are the same test with dividends and interest counted, and the same test on markets outside the US.
Enter the lab
Press Open the platform and this study's test opens in the lab, our research workspace: SPY and its prices, volatility targeting and the 200-day line side by side, the one-year test and the trading cost. The Volatility Target card is new. It connects to the Signal Forward Test card, and its panel shows how much of the fund it holds when the daily moves are one to four times their normal size.
Things to try. Run it on another fund. Let it look at the last 10 trading days instead of 21, or at three years of normal moves instead of five, or let it hold at most 80% of the position. Put it under your own rule, an RSI pullback or a moving average crossover, or under the 200-day line itself, the both-together test of this paper.
4.3 Limitations
Prices without dividends. Every rule and holding itself use prices without dividends. With dividends, holding would grow faster, and the rules that are partly in cash would miss part of the dividends.
Cash earns nothing. The 200-day line and both together spend long stretches in cash. Interest on that cash would have helped them in the years when cash paid well.
One setting each, fixed in advance: 21 trading days for the recent moves, five years for the normal ones, never more than the whole position, and the 200-day average. Nothing was tuned on the results, so other settings may show more or less protection.
No borrowing. The volatility-managed portfolios of Moreira and Muir (2017) hold more than the whole position in calm times, with borrowed money. Ours never does, so it can only hold less.
Six falls. Six large falls in 26 years is a small number to judge rules by. The 13 other funds add breadth, but they lived through the same crashes.
Young funds. QQQ, long Treasuries and gold had two to three and a half years of history when their tests began, so their normal size came from a short stretch. For QQQ that stretch was 1999 to 2001, the most jumpy years of the dot-com era, and in 2002 volatility targeting held almost all of QQQ while it fell 39%.
Trading. Volatility targeting resizes its holding a little on every day it holds less than the whole position. At 0.02% a trade these resizes took about 0.04 points of growth a year on SPY; a trader who pays five times as much per trade would give up about 0.2 points a year. Taxes are not counted; in a taxable account every sale can realize a gain, and both rules sell more often than holding does.
Joining the yearly tests. The paths join each year's test with the share held the day before, as the methodology says; the platform's yearly records leave the first trading day of each year out.
References
- Gelman, A., & Loken, E. (2013). The garden of forking paths: Why multiple comparisons can be a problem, even when there is no “fishing expedition.” Working paper, Columbia University.
- Harvey, C. R., Liu, Y., & Zhu, H. (2016). … and the Cross-Section of Expected Returns. Review of Financial Studies, 29(1), 5–68. doi:10.1093/rfs/hhv059
- Lo, A. W. (2002). The Statistics of Sharpe Ratios. Financial Analysts Journal, 58(4), 36–52. doi:10.2469/faj.v58.n4.2453
- Moreira and Muir (2017), Volatility-Managed Portfolios, Journal of Finance 72(4): 1611-1644. Holding less of the market after its moves have been large raised the return for each unit of risk. https://doi.org/10.1111/jofi.12513
- Fleming, Kirby and Ostdiek (2001), The Economic Value of Volatility Timing, Journal of Finance 56(1): 329-352. https://doi.org/10.1111/0022-1082.00327
- Harvey, Hoyle, Korgaonkar, Rattray, Sargaison and Van Hemert (2018), The Impact of Volatility Targeting, Journal of Portfolio Management 45(1): 14-33. For stocks, volatility targeting made the worst falls smaller and raised the return for each unit of risk. https://doi.org/10.3905/jpm.2018.45.1.014
- Cederburg, O'Doherty, Wang and Yan (2020), On the Performance of Volatility-Managed Portfolios, Journal of Financial Economics 138(1): 95-117. Tested in real time, most volatility-managed portfolios did not beat holding. https://doi.org/10.1016/j.jfineco.2020.04.015
- Bongaerts, Kang and van Dijk (2020), Conditional Volatility Targeting, Financial Analysts Journal 76(4): 54-71. Cutting only when the moves are unusually large, and never adding, kept most of the benefit. https://doi.org/10.1080/0015198X.2020.1790853
- Faber (2007), A Quantitative Approach to Tactical Asset Allocation, Journal of Wealth Management 9(4): 69-79. A ten-month moving average rule, the monthly cousin of the 200-day line. https://doi.org/10.3905/jwm.2007.674809
- QuanterLab (2026), A Stochastic Model Against a Geometric Rule: the Kalman Filter and the 200-Day Line, the same funds and years. https://quanterlab.com/research/a-stochastic-model-against-a-geometric-rule-the-kalman-filter-and-the-200-day
Appendix A Reproducibility in QuanterLab
Each step is backed by a frozen run report. The study is re-derivable from the ledger below.
| # | Commit | Report | Anchor | OOS window |
|---|---|---|---|---|
| 1 | 7c11bec189b5 | 13821 | 2000-01-01 | 2000-01-03 → 2000-12-29 |
| 2 | 4c22e2479a1c | 13824 | 2001-01-01 | 2001-01-02 → 2001-12-31 |
| 3 | 43efeb312dc0 | 13827 | 2002-01-01 | 2002-01-02 → 2002-12-31 |
| 4 | a1ed70f4b60d | 13830 | 2003-01-01 | 2003-01-02 → 2003-12-31 |
| 5 | 61daf3244673 | 13833 | 2004-01-01 | 2004-01-02 → 2004-12-31 |
| 6 | d3e39d41d8b7 | 13836 | 2005-01-01 | 2005-01-03 → 2005-12-30 |
| 7 | dd9489cadc65 | 13839 | 2006-01-01 | 2006-01-03 → 2006-12-29 |
| 8 | 8f886149ee68 | 13842 | 2007-01-01 | 2007-01-03 → 2007-12-31 |
| 9 | dd10dfc6bf21 | 13845 | 2008-01-01 | 2008-01-02 → 2008-12-31 |
| 10 | b5616fa8a381 | 13848 | 2009-01-01 | 2009-01-02 → 2009-12-31 |
| 11 | c7d73fda6e9b | 13851 | 2010-01-01 | 2010-01-04 → 2010-12-31 |
| 12 | 3350d167e0c4 | 13854 | 2011-01-01 | 2011-01-03 → 2011-12-30 |
| 13 | 7fb0c499efa0 | 13857 | 2012-01-01 | 2012-01-03 → 2012-12-31 |
| 14 | 705efbaf263b | 13860 | 2013-01-01 | 2013-01-02 → 2013-12-31 |
| 15 | c2a85a6ca879 | 13863 | 2014-01-01 | 2014-01-02 → 2014-12-31 |
| 16 | 6bf57c8b6834 | 13866 | 2015-01-01 | 2015-01-02 → 2015-12-31 |
| 17 | 8f55216a014e | 13869 | 2016-01-01 | 2016-01-04 → 2016-12-30 |
| 18 | 91f87ed1c17f | 13872 | 2017-01-01 | 2017-01-03 → 2017-12-29 |
| 19 | 23dfc30c4edb | 13875 | 2018-01-01 | 2018-01-02 → 2018-12-31 |
| 20 | 5dbf8a455826 | 13878 | 2019-01-01 | 2019-01-02 → 2019-12-31 |
| 21 | afea05508958 | 13881 | 2020-01-01 | 2020-01-02 → 2020-12-31 |
| 22 | 57659defea51 | 13883 | 2021-01-01 | 2021-01-04 → 2021-12-31 |
| 23 | a409b7e4fe89 | 13885 | 2022-01-01 | 2022-01-03 → 2022-12-30 |
| 24 | 760fc0ece91d | 13887 | 2023-01-01 | 2023-01-03 → 2023-12-29 |
| 25 | e236041a6ec8 | 13889 | 2024-01-01 | 2024-01-02 → 2024-12-31 |
| 26 | 1b14e88b3517 | 13891 | 2025-01-01 | 2025-01-02 → 2025-12-31 |
Appendix A2 Registration record
What this record does and does not establish. Every window in this study is historical: the data existed before the study began, so this is sequential registration on past windows, not pre-registration in the clinical-trial sense, and no procedure could make it so. What the platform does enforce is order, each step's specification was frozen and hashed before that step was scored, and the walk cannot advance past a step that was never run or close one with a result registered for a different window. The two timestamp columns below are the evidence: read them together and each registration precedes its own run, and each run precedes the next registration. A study whose registrations all post-date its runs would show it here. Wall-clock spacing between registrations varies with the author's schedule and queue latency; the ordering, not the tempo, is the claim.
“A COMPARATIVE study: The volatility target vs The 200-day line, walked on the same registered out-of-sample windows. The volatility target: SPY, bought when always, every trading day; sell when never, and forward-tested out-of-sample from the anchor: the rule set is frozen at the anchor, with no in-sample re-optimization. The 200-day line: SPY, bought when the close is above its 200-day average; sell when the close is below its 200-day average, and forward-tested out-of-sample from the anchor: the rule set is frozen at the anchor, with no in-sample re-optimization. The arms differ in 2 nodes across 6 recorded settings: Signal Module, config (entry · indicator: every_day → sma; entry · operator: above → price_above; entry · length:, → 200; entry · value: 0.5 →, ; …); Volatility Target, removed in The 200-day line. NOTE: with more than one difference, an out-of-sample gap cannot be attributed to any single change. The contrast under test: whether The volatility target generates better risk-adjusted returns than The 200-day line over the identical out-of-sample windows.”
The same hypothesis was registered independently at every step, hashed before each step's out-of-sample window was scored:
| # | Anchor | Registered at (UTC) | Run completed (UTC) |
|---|---|---|---|
| 1 | 2000-01-01 | 2026-10-05 09:02:53 | 2026-10-05 09:02:54 |
| 2 | 2001-01-01 | 2026-10-05 09:02:54 | 2026-10-05 09:02:55 |
| 3 | 2002-01-01 | 2026-10-05 09:02:55 | 2026-10-05 09:02:56 |
| 4 | 2003-01-01 | 2026-10-05 09:02:57 | 2026-10-05 09:02:58 |
| 5 | 2004-01-01 | 2026-10-05 09:02:58 | 2026-10-05 09:02:59 |
| 6 | 2005-01-01 | 2026-10-05 09:02:59 | 2026-10-05 09:03:00 |
| 7 | 2006-01-01 | 2026-10-05 09:03:00 | 2026-10-05 09:03:01 |
| 8 | 2007-01-01 | 2026-10-05 09:03:01 | 2026-10-05 09:03:02 |
| 9 | 2008-01-01 | 2026-10-05 09:03:02 | 2026-10-05 09:03:03 |
| 10 | 2009-01-01 | 2026-10-05 09:03:04 | 2026-10-05 09:03:05 |
| 11 | 2010-01-01 | 2026-10-05 09:03:05 | 2026-10-05 09:03:06 |
| 12 | 2011-01-01 | 2026-10-05 09:03:06 | 2026-10-05 09:03:07 |
| 13 | 2012-01-01 | 2026-10-05 09:03:07 | 2026-10-05 09:03:08 |
| 14 | 2013-01-01 | 2026-10-05 09:03:09 | 2026-10-05 09:03:10 |
| 15 | 2014-01-01 | 2026-10-05 09:03:10 | 2026-10-05 09:03:11 |
| 16 | 2015-01-01 | 2026-10-05 09:03:11 | 2026-10-05 09:03:12 |
| 17 | 2016-01-01 | 2026-10-05 09:03:12 | 2026-10-05 09:03:13 |
| 18 | 2017-01-01 | 2026-10-05 09:03:13 | 2026-10-05 09:03:15 |
| 19 | 2018-01-01 | 2026-10-05 09:03:15 | 2026-10-05 09:03:16 |
| 20 | 2019-01-01 | 2026-10-05 09:03:16 | 2026-10-05 09:03:17 |
| 21 | 2020-01-01 | 2026-10-05 09:03:17 | 2026-10-05 09:03:18 |
| 22 | 2021-01-01 | 2026-10-05 09:03:18 | 2026-10-05 09:03:19 |
| 23 | 2022-01-01 | 2026-10-05 09:03:19 | 2026-10-05 09:03:20 |
| 24 | 2023-01-01 | 2026-10-05 09:03:20 | 2026-10-05 09:03:21 |
| 25 | 2024-01-01 | 2026-10-05 09:03:22 | 2026-10-05 09:03:23 |
| 26 | 2025-01-01 | 2026-10-05 09:03:23 | 2026-10-05 09:03:24 |