Mean Variance Optimization Historical Mean vs Black Litterman
Two portfolios were walked forward across twenty, sealed, one-year windows of the S&P 500, from January 2006 to December 2025, identical in every respect but one: how each estimated the expected returns it optimised against. Arm A used the trailing historical mean. Arm B used a Black-Litterman posterior the market-capitalisation equilibrium, tilted by views taken from the same factor composite that selected the pool. Paired date by date across 5,011 common out-of-sample observations, Arm A compounded at 4.1% a year against Arm B's 9.7%, and a seeded block bootstrap of the paired differences puts the probability that Arm A genuinely beats Arm B at 3.0%. The pooled gap is not, however, a standing property of either method. Split at 2010, the four pre-crisis windows contribute a −14.05 pp mean gap with Arm A leading none of them, while the sixteen windows from 2010 onward contribute −3.47 pp with Arm A leading seven. The two eras disagree by 10.58 pp, so a reader who takes only the headline has taken mostly the crisis. The more durable result is a risk one. Every rebalance carried a Monte Carlo cone and a 95% VaR estimated strictly before the segment they were scored against 160 forecasts and 9,902 VaR days in total. Both arms proved over-confident, and in the same order as their returns: Arm A breached its 95% VaR on 8.58% of days against the 5% advertised, Arm B on 6.38%. Arm A also held the more concentrated book, a median of 12 names against Arm B's 15. Concentration therefore shows up twice once as weaker compounding, once as a risk model that understated its own tails which is a more useful finding than the headline gap, because it is measured on thousands of days rather than twenty windows.
Motivation
Mean-variance optimisation has a well-documented failure mode: it treats estimated expected returns as if they were known, and expected returns are the hardest thing in finance to estimate. Michaud named the consequence an estimation-error maximiser, the optimiser loads onto whichever names the estimate happened to flatter, which are disproportionately the names the estimate got wrong. Black-Litterman is the standard answer. Rather than optimise raw estimates, it starts from the returns implied by the market portfolio and moves toward the investor's views only as far as the stated confidence warrants. The claim is not that it forecasts better. It is that it degrades more gracefully when the forecast is poor. That claim is usually argued analytically or shown on a single backtest. It is rarely put out of sample, twenty times, on identical windows, with the record sealed in advance. That is the gap this study fills not a new method, but a clean measurement of an old one.
Why this setup
Every constraint exists to make one comparison legible. One manipulated variable. The arms are the same circuit same universe, same factor lane, same optimiser, same rebalance calendar differing only in return_method. Registration refuses a comparative study whose arms are identical, and the frozen diff reports exactly one difference. Twenty one-year windows rather than one long backtest. A single 2006–2025 run produces one number and no way to see where it came from. Twenty paired windows produce a distribution, a win-rate, and the era structure that turned out to matter more than the average. Point-in-time everything. Index membership is reconstructed from the dated constituent change-log at each anchor. Fundamentals are gated on SEC acceptance timestamps. The risk-free rate is the three-month Treasury bill resolved as of each rebalance, not a constant. Each is a way a backtest can quietly learn the future. A capped, rebalanced book. Holdings are capped at fifteen and any single weight at 20%, with quarterly reselection from the top hundred of the composite. Unconstrained MVO on five hundred names produces corner solutions that interest nobody. A 20% ceiling still permits a five-name book, which is what leaves room for the arms to differ in breadth at all a tighter cap would have forced both arms wide and hidden the study's central finding. Equal factor weights. Value, quality, momentum and growth at 25% each, not optimised. This is the null choice; it removes a class of objection about a fitted signal, at the cost of certainly not being the best available blend.
1 Methodology
The study walks a comparative hypothesis forward across twenty consecutive one-year windows, anchored at 1 January of each year from 2006 to 2025. Each step's hypothesis is registered and sealed before the window that follows it is scored; the walk advances only forward and the circuit cannot be edited while it runs. Universe and selection. The starting set is the S&P 500 as constituted on the anchor date, reconstructed from the dated change-log. Point-in-time fundamentals feed a composite blending value, quality, momentum and growth in equal parts, z-scored and winsorised; the top hundred names pass to the optimiser. Selection repeats at every rebalance, so the pool is re-cut quarterly on data available at that date. Portfolio construction. Both arms run mean-variance optimisation for maximum Sharpe over the pool, long only, excluding names whose expected return is not positive. Books rebalance quarterly on a one-year horizon from the anchor. The manipulated variable. Arm A estimates expected returns as the annualised trailing mean of the 504-day window. Arm B estimates them as a Black-Litterman posterior: the prior is the equilibrium implied by reverse optimisation over the pool's point-in-time market-capitalisation weights at δ = 2.5, expressed as a total return by adding the point-in-time risk-free rate. Views are absolute and cover every name, each name's view is its equilibrium return shifted by the Grinold quantity, information coefficient times pool-standardised composite score times the name's own volatility. View uncertainty follows He-Litterman with a single confidence of 0.50, placing the posterior approximately midway between equilibrium and views. Both dials were fixed before the first window was scored. Note that covariance shrinkage is present on both arms via Ledoit-Wolf. The contrast is therefore not shrinkage against no shrinkage; it is whether shrinking the return estimate adds anything once the covariance is already shrunk. Risk forecasting. At every rebalance both arms produce a Monte Carlo distribution of the segment ahead and a 95% one-day VaR, each fitted only on prior data, scored against what subsequently occurred and pooled across the walk. What is measured. Both arms trade identical sealed windows, so daily returns are paired within each window and the difference series is the object under test. The paper reports the raw out-of-sample outcome and claims no deflated Sharpe: no search record exists for this design, so the number of alternatives considered before it is unknown, which is a different fact from one. Costs are not modelled. All figures are gross of commissions, spread, impact and tax.
Transaction costs are not modelled in this study; all results are gross of costs.
2 Results
2.1 Headline
2.2 Per-step results
| # | Out-of-sample window | Arm A SR | Arm B SR |
|---|---|---|---|
| 1 | 2006-01-03 → 2006-12-29 | -0.30 | 0.23 |
| 2 | 2007-01-03 → 2007-12-31 | 0.12 | 1.00 |
| 3 | 2008-01-02 → 2008-12-31 | -1.87 | -1.16 |
| 4 | 2009-01-02 → 2009-12-31 | 0.12 | 0.99 |
| 5 | 2010-01-04 → 2010-12-31 | 0.97 | 0.68 |
| 6 | 2011-01-03 → 2011-12-30 | 0.33 | -0.04 |
| 7 | 2012-01-03 → 2012-12-31 | 0.58 | 0.58 |
| 8 | 2013-01-02 → 2013-12-31 | 1.85 | 1.40 |
| 9 | 2014-01-02 → 2014-12-31 | 1.25 | 0.99 |
| 10 | 2015-01-02 → 2015-12-31 | 0.30 | 0.55 |
| 11 | 2016-01-04 → 2016-12-30 | 0.89 | -0.18 |
| 12 | 2017-01-03 → 2017-12-29 | 2.66 | 1.51 |
| 13 | 2018-01-02 → 2018-12-31 | -0.52 | -0.54 |
| 14 | 2019-01-02 → 2019-12-31 | 1.43 | 0.83 |
| 15 | 2020-01-02 → 2020-12-31 | 0.28 | 0.81 |
| 16 | 2021-01-04 → 2021-12-31 | 0.78 | 1.67 |
| 17 | 2022-01-03 → 2022-12-30 | -1.10 | -0.43 |
| 18 | 2023-01-03 → 2023-12-29 | 0.43 | 1.54 |
| 19 | 2024-01-02 → 2024-12-31 | 1.33 | 2.02 |
| 20 | 2025-01-02 → 2025-12-31 | 0.61 | 0.88 |
2.3 Search accounting
No search record exists for this design. It was not promoted from a recorded evolving search, so the number of alternatives tried before it — on paper, in another tool, or in the author's head — is unknown. Unknown is a different fact from one: a study with no lineage is not a strategy with one trial, it is a strategy with an unrecorded number of them. Accordingly this paper claims no deflated Sharpe and no trial count; the honest statement is the raw out-of-sample result plus this disclosure. The registered per-step record below (§4) still guarantees each window's hypothesis was sealed before that window was scored.
2.4 The comparison
Both arms trade the same sealed windows, so their returns can be PAIRED: inside each window the two return series are inner-joined date by date and the difference rArm A − rArm B is the object under test. Because this is ONE pre-declared contrast — sealed before any window was scored — the paired statistic needs no multiple-testing deflation; the per-arm pooled numbers above are still deflated by the trial count as usual.
| # | Window | Paired bars | Arm A | Arm B | Δ | Leader |
|---|---|---|---|---|---|---|
| 1 | 2006-01-04 → 2006-12-29 | 250 | -5.8% | +2.5% | -8.3 pp | Arm B |
| 2 | 2007-01-04 → 2007-12-31 | 250 | +0.2% | +20.4% | -20.1 pp | Arm B |
| 3 | 2008-01-03 → 2008-12-31 | 252 | -50.8% | -47.1% | -3.6 pp | Arm B |
| 4 | 2009-01-05 → 2009-12-31 | 251 | -0.2% | +23.8% | -24.0 pp | Arm B |
| 5 | 2010-01-05 → 2010-12-31 | 251 | +21.3% | +12.9% | +8.3 pp | Arm A |
| 6 | 2011-01-04 → 2011-12-30 | 251 | +4.8% | -4.2% | +9.0 pp | Arm A |
| 7 | 2012-01-04 → 2012-12-31 | 249 | +8.0% | +8.3% | -0.3 pp | Arm B |
| 8 | 2013-01-03 → 2013-12-31 | 251 | +32.9% | +22.6% | +10.3 pp | Arm A |
| 9 | 2014-01-03 → 2014-12-31 | 251 | +19.8% | +15.6% | +4.2 pp | Arm A |
| 10 | 2015-01-05 → 2015-12-31 | 251 | +3.8% | +8.4% | -4.6 pp | Arm B |
| 11 | 2016-01-05 → 2016-12-30 | 251 | +15.2% | -4.0% | +19.2 pp | Arm A |
| 12 | 2017-01-04 → 2017-12-29 | 250 | +36.5% | +20.0% | +16.5 pp | Arm A |
| 13 | 2018-01-03 → 2018-12-31 | 250 | -12.6% | -12.6% | -0.0 pp | tie |
| 14 | 2019-01-03 → 2019-12-31 | 251 | +19.5% | +11.9% | +7.6 pp | Arm A |
| 15 | 2020-01-03 → 2020-12-31 | 252 | +3.7% | +27.0% | -23.4 pp | Arm B |
| 16 | 2021-01-05 → 2021-12-31 | 251 | +17.8% | +38.8% | -21.0 pp | Arm B |
| 17 | 2022-01-04 → 2022-12-30 | 250 | -28.5% | -13.6% | -14.9 pp | Arm B |
| 18 | 2023-01-04 → 2023-12-29 | 249 | +5.7% | +30.6% | -24.9 pp | Arm B |
| 19 | 2024-01-03 → 2024-12-31 | 251 | +25.7% | +53.2% | -27.6 pp | Arm B |
| 20 | 2025-01-03 → 2025-12-31 | 249 | +9.9% | +24.1% | -14.2 pp | Arm B |
Paired Sharpe of the difference track: -0.39 · block bootstrap (2000 paths, block 10, seed 1234): P(Arm A beats Arm B) = 3.0%.
Window win-rate. Arm A led 7 of 20 windows (35.0%), Arm B led 12 , and the mean window gap of -5.58 pp points the same way. Widest single window: 2024 at -27.6 pp.
| Period | Windows | Arm A | Arm B | Mean gap | Arm A led |
|---|---|---|---|---|---|
| All windows | 20 | +6.35% | +11.93% | -5.58 pp | 7/20 |
| Before 2010 | 4 | -14.15% | -0.10% | -14.05 pp | 0/4 |
| 2010 onward | 16 | +11.47% | +14.94% | -3.47 pp | 7/16 |
The two eras disagree by 10.58 pp. The pooled figure is therefore not a standing property of either method — it is dominated by the earlier period. Read the two rows, not the average.
3 The circuit
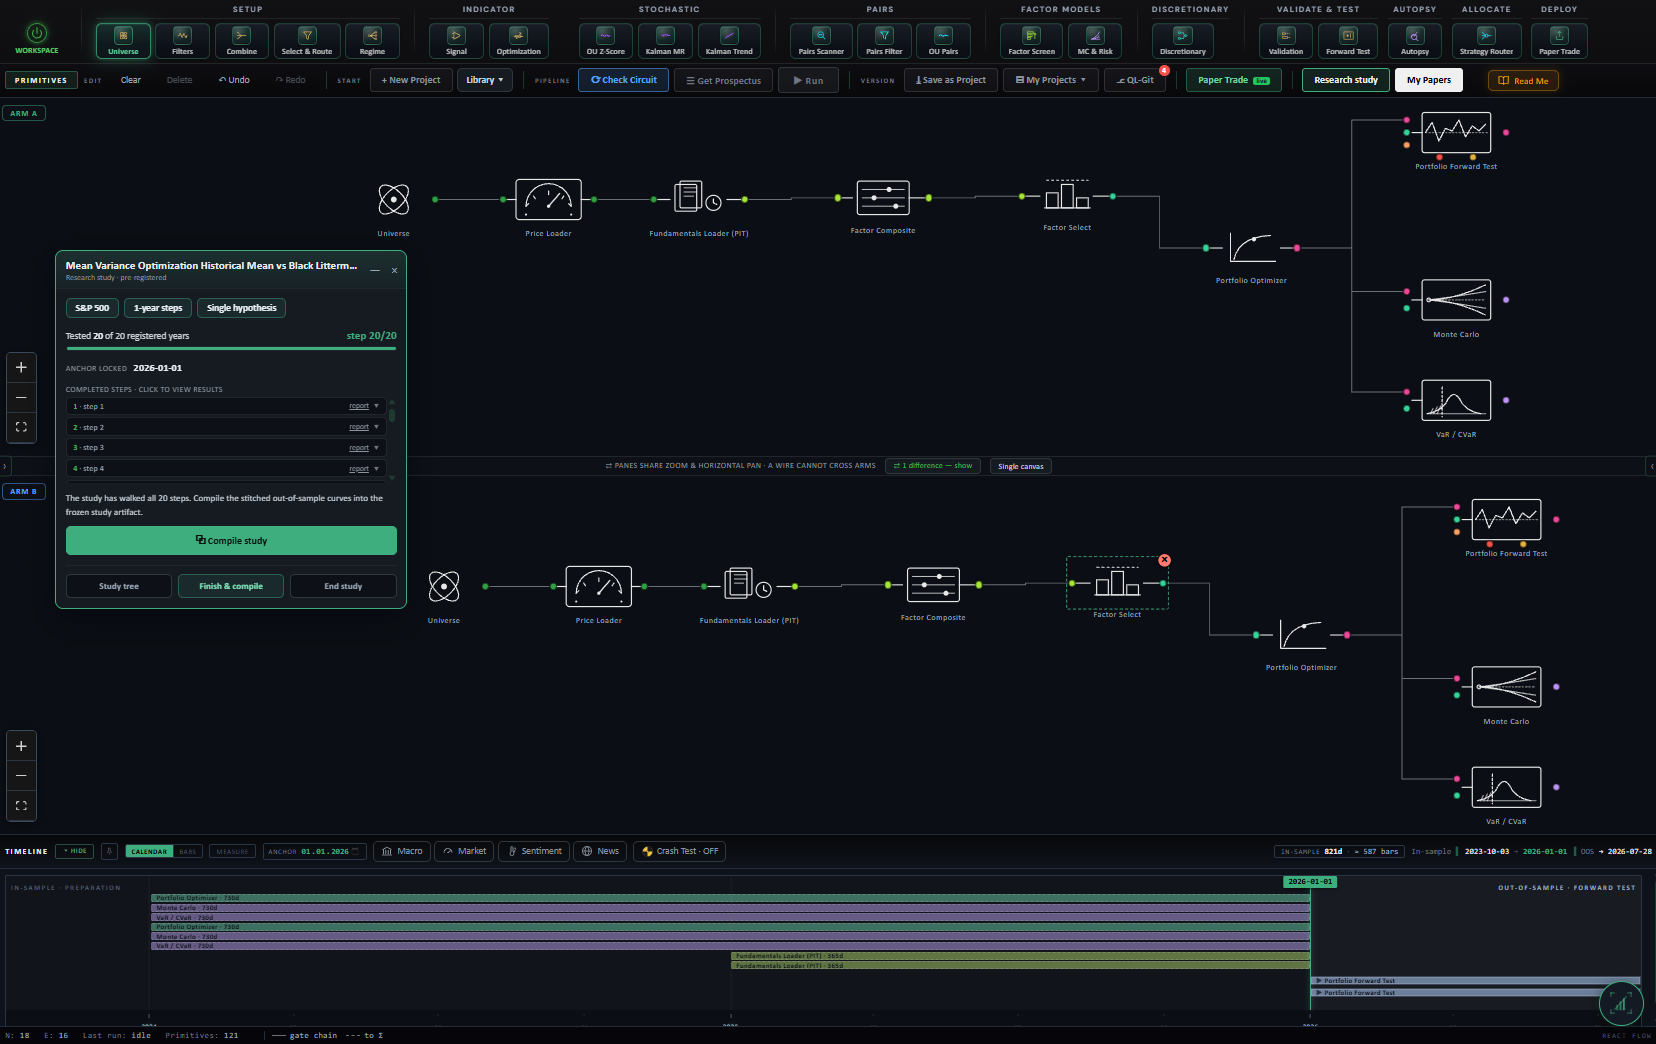
The strategy is a circuit of platform primitives, frozen when the study is registered. Below is the circuit as wired on the canvas, the objective it encodes and how the search runs through it, followed by the mathematics each primitive actually computes — the same formulas the execution engine runs. The complete parameterisation is preserved in the study ledger (Appendix A).
A COMPARATIVE study — Arm A vs Arm B, walked on the same sealed out-of-sample windows. Arm A: S&P 500, rebalanced quarterly across the selected basket, and run out-of-sample from the anchor — with no in-sample parameters to optimize, a walk-forward does not apply; its disposition is the realized forward path versus the benchmark. Arm B: S&P 500, rebalanced quarterly across the selected basket, and run out-of-sample from the anchor — with no in-sample parameters to optimize, a walk-forward does not apply; its disposition is the realized forward path versus the benchmark. The arms differ in: Portfolio Optimizer — return_method: historical_mean → black_litterman_views. The contrast under test: whether Arm A generates better risk-adjusted returns than Arm B over the identical out-of-sample windows.
Envelopes show counts, ratios, dates, and the parameters the author chose. Price series and per-name figures are not published: the underlying market data is licensed to QuanterLab, and redistributing it isn't ours to do.
The objective and the search
Arm A — S&P 500, rebalanced quarterly across the selected basket, and run out-of-sample from the anchor — with no in-sample parameters to optimize, a walk-forward does not apply; its disposition is the realized forward path versus the benchmark.
| Universe | S&P 500 index constituents. |
|---|---|
| Validation & out-of-sample | portfolio forward test (buy-and-hold book) (1y horizon from the anchor, quarterly rebalance). |
| Other components | Combine: Portfolio Optimizer; Factor models: Factor Composite, Factor Select, Fundamentals Loader (PIT). |
Arm B — S&P 500, rebalanced quarterly across the selected basket, and run out-of-sample from the anchor — with no in-sample parameters to optimize, a walk-forward does not apply; its disposition is the realized forward path versus the benchmark.
| Universe | S&P 500 index constituents. |
|---|---|
| Validation & out-of-sample | portfolio forward test (buy-and-hold book) (1y horizon from the anchor, quarterly rebalance). |
| Other components | Combine: Portfolio Optimizer; Factor models: Factor Composite, Factor Select, Fundamentals Loader (PIT). |
What differs between the arms — one difference; the comparison is clean:
- paramPortfolio Optimizer — return_method: historical_mean → black_litterman_views
Everything else is held identical, so an out-of-sample gap between the arms is attributable to this one change.
No transaction-cost elements are wired into this circuit; results are gross of costs.
Show the mathematics — 9 primitives, formulas and parity notes
3.1 Universe
The starting set of tickers — resolved point-in-time so there is no survivorship bias.
Before any math, you need a list of stocks. An index preset (S&P 500, Nasdaq-100, Dow 30) is reconstructed as it stood ON your anchor date by replaying the historical add/drop change-log backwards — so a 2018 backtest sees the 2018 membership, not today's winners.
Start from today's constituents and un-apply every membership change after the anchor t:
\mathcal{U}(t) = \mathcal{U}_{\text{now}} \;\ominus\; \{\text{adds after } t\} \;\oplus\; \{\text{drops after } t\}3.2 Price Loader
Bulk OHLCV fetch for the whole universe — point-in-time, no future bars.
Momentum, volatility, trend — every price-based metric needs history. This loads open/high/low/close/volume for all names in parallel, clipped so nothing after the anchor can leak in. The lookback window is derived automatically from the deepest metric you wired.
It loads exactly enough history for the hungriest downstream metric plus a warm-up buffer:
W = \max_k(\text{lookback}_k) + \text{buffer}, \qquad \text{bars} \le \text{anchor } t3.3 Factor Loader
Point-in-time fundamentals — never let the user see a number before the SEC did.
Loads ~23 fundamental metrics (valuation, quality, growth) per name, but with one inviolable rule: a financial statement becomes visible only on or after its SEC acceptedDate. A 2020 backtest sees only what was actually filed by 2020 — no look-ahead, ever.
\text{visible}(f, t) \iff \text{acceptedDate}(f) \le t3.4 Factor Composite
The weighting console — blend Value, Quality, Momentum, Growth into one 0–100 score.
Where the four factor families become a single ranking. Each family score is standardized across the universe, blended with your slider weights (or the radar's suggested tilt), and min-max scaled to 0–100. Winsorizing tames outliers; z-score or percentile normalization is your choice.
z_{i,f} = \frac{x_{i,f} - \bar x_f}{s_f}\quad(\text{clipped at the 1st / 99th percentile})C_i = \sum_f W_f\,z_{i,f}, \qquad \text{score}_i = 100\cdot\frac{C_i - \min_j C_j}{\max_j C_j - \min_j C_j}3.5 Factor Top Tier
The cut out of the factor lane — keep the top-ranked names.
Takes the composite-ranked factor set and keeps the best N, carrying the composite score, the four family scores and the point-in-time market cap for each survivor. Feed 10–20 to a direct portfolio, or 30–100 as an optimizer pool.
\{\, i : \operatorname{rank}(C_i) \le N\,\}, \quad C_i = \text{composite score}3.6 Portfolio Optimizer
MVO · HRP · IVOL — three rigorous ways to weight a pool.
Beyond simple rules, three portfolio-theory optimizers. MVO maximizes return per unit of risk on the efficient frontier; HRP spreads risk across correlation clusters with no return forecast; IVOL is the simplest risk-balanced rule. All re-solve point-in-time at every rebalance.
\max_{\mathbf w}\ \frac{\mathbf w^{\top}\boldsymbol\mu - r_f}{\sqrt{\mathbf w^{\top}\boldsymbol\Sigma\,\mathbf w}} \quad \text{s.t.}\ \ \mathbf 1^{\top}\mathbf w = 1,\ \ 0 \le w_i \le w_{\max}d_{ij} = \sqrt{\tfrac12\,(1-\rho_{ij})} \ \to\ \text{hierarchical clusters}\ \to\ \text{recursive inverse-variance bisection}w_i = \frac{1/\sigma_i}{\sum_j 1/\sigma_j}3.7 Portfolio Backtest
Replay the portfolio forward — rebalanced, point-in-time, with costs.
Holds the basket and rebalances on schedule, re-selecting and re-optimizing point-in-time at each rebalance (so it only ever uses information available then), and reports the equity curve, Sharpe, drawdown and trade stats — optionally net of cost and risk overlays.
E_t = E_{t-1}\big(1 + \mathbf w_{t}^{\top}\mathbf r_t - \text{costs}_t\big)\text{DD}_t = \frac{E_t}{\max_{\tau\le t}E_\tau} - 1, \qquad \text{MaxDD} = \min_t \text{DD}_t3.8 Monte Carlo
Monte Carlo — simulate thousands of futures for the portfolio.
Estimate the portfolio's drift and covariance, then roll it forward thousands of times under geometric Brownian motion. The spread of outcomes gives the probability of doubling, of a big loss, and the P5–P95 cone — the honest range around any single backtested path.
S_{t+\Delta t} = S_t\,\exp\!\Big[\big(\mu - \tfrac12\sigma^2\big)\Delta t + \sigma\sqrt{\Delta t}\;Z\Big],\quad Z\sim\mathcal N(0,1)P(\text{double}),\ P(\text{+50\%}),\ P(\text{loss}),\ P(\text{−25\%}) = \frac{\#\{\text{paths in region}\}}{\#\text{paths}}3.9 Var Cvar
Value-at-Risk & CVaR — how bad is a bad day (or year)?
VaR is the loss you would not exceed at a given confidence (e.g. "95% of days lose less than X"). CVaR (expected shortfall) is the average loss on the days you DO breach it — the tail beyond the line. Computed historically and parametrically, with each holding's contribution to the tail.
\text{VaR}_\alpha = -\,Q_{1-\alpha}(r), \qquad \alpha \in \{90\%, 95\%, 99\%\}\text{CVaR}_\alpha = -\,\mathbb E\!\big[\,r \mid r \le -\text{VaR}_\alpha\,\big]\text{RC}_i = w_i\,\frac{(\boldsymbol\Sigma\,\mathbf w)_i}{\sqrt{\mathbf w^{\top}\boldsymbol\Sigma\,\mathbf w}}, \qquad \sum_i \text{RC}_i = 100\%4 Projection calibration, pooled across the walk
Every rebalance carried a Monte Carlo cone and a 95% VaR estimated before the segment it is scored against. Two questions, pooled over the whole study: did realized outcomes land inside the band as often as the band claims, and were VaR breaches as frequent as 5%?
| Arm | Steps | Rebalances | In band | Coverage | Expected | VaR days | Breach rate | Expected |
|---|---|---|---|---|---|---|---|---|
| Arm A | 20 | 95 | 66 / 80 | 82.5% ±4.25 | 90.0% | 4951 | 8.58% ±0.398 | 5.0% |
| Arm B | 20 | 95 | 69 / 80 | 86.2% ±3.85 | 90.0% | 4951 | 6.38% ±0.347 | 5.0% |
± values are binomial standard errors on the estimate. A coverage figure below the expected band means the projection was over-confident; a breach rate above 5% means the same of the risk model. Both forecasts used only data prior to the segment scored.
5 Discussion
5.1 Findings
Arm B outperformed Arm A on the pooled sample and the result is unlikely to be noise. Across 5,011 paired out-of-sample observations spanning twenty sealed windows, Arm A compounded at 4.1% a year against Arm B's 9.7%, with pooled Sharpe ratios of 0.29 and 0.51. The paired difference series has a Sharpe of −0.39, and a block bootstrap of 2,000 resampled paths leaves Arm A ahead on 3.0% of them. Arm B led twelve of twenty windows, Arm A seven, with one tie. Cumulatively Arm B returned +520.3% against the benchmark's +402.8%, while Arm A returned +120.5% Arm A did not merely lose the comparison, it substantially lagged the index it was drawn from. The pooled gap is not a property of either estimator. Split at 2010, the four earlier windows show a mean gap of −14.05 pp with Arm A leading none, and the sixteen later windows −3.47 pp with Arm A leading seven. But that post-2010 residual is two opposite regimes cancelling. Across 2010–2019 Arm A led, by a mean of +7.0 pp per window and in seven of ten; across 2020–2025 Arm B led all six by a mean of −21.0 pp, a wider margin than the crisis produced. A −3.47 pp average is what those two blocks come to, and averaging is exactly what it conceals. The finer split is reported because it is arithmetic on Table 2 and suppressing it would be worse but it was chosen after inspecting the results, carries no registration, and is a hypothesis rather than a finding. The risk forecasts were over-confident for both arms, measurably more so for Arm A. Realised outcomes fell inside the 90% Monte Carlo band on 82.5% (±4.25) of Arm A's eighty scored rebalances and 86.2% (±3.85) of Arm B's each one to two standard errors light, which on eighty draws is suggestive rather than conclusive. The VaR evidence is far better powered: across 4,951 days per arm, Arm A breached its 95% VaR on 8.58% (±0.398) of days and Arm B on 6.38% (±0.347), against 5% advertised. Both exceedances are many standard errors wide, and Arm A's book experienced roughly seventy per cent more breaches than its own risk model allowed for. The two results share a mechanism. Arm B reached the fifteen-name holdings cap in nineteen of twenty steps; Arm A reached it in four, with a median of 10.5 names and a floor of six in both 2008 and 2011. Shrinking expected returns toward equilibrium compresses the cross-sectional spread, so more names clear the optimiser's inclusion hurdle and the posterior arm is structurally the more diversified one at every rebalance. The less diversified arm compounded worse and understated its own tail risk by more.
5.2 Interpretation
The safest reading is not that Black-Litterman forecasts better than a historical mean. Nothing here measures forecast accuracy. What it measures is what happens to a portfolio when a known-noisy estimator is fed into an optimiser that treats estimates as certainties, and the answer is that the damage arrives through concentration. A trailing mean over 504 days produces a wide cross-sectional spread of expected returns, including many negative ones. The optimiser excludes those outright and loads onto the survivors, so the book narrows exactly when disagreement between names is highest which is when the estimates are least reliable. The posterior arm never has that problem: shrinking toward equilibrium compresses the spread and leaves nearly the whole pool admissible, which is why it sat at the holdings cap in nineteen of twenty steps. Michaud's estimation-error maximiser is visible here not as a bad forecast but as a thin portfolio. That account predicts the advantage should be large when dispersion and correlation spike and modest otherwise. It holds for 2006–2009, and it holds for the 2010s, where Arm A led. It does not hold for 2020–2025, where the gap is the widest in the study without a comparable systemic event. Either the diversification account is incomplete, or the 2020s carry a mechanism this study does not measure. Two candidates are worth naming: a market-capitalisation-anchored prior tilts toward the largest names, and 2020–2025 was a period in which a handful of very large names carried the index — so Arm B's prior may have been long the decade's winners for reasons unrelated to shrinkage. Or a two-year lookback spanning the COVID drawdown fed the historical-mean arm systematically extreme inputs well after the event. This study cannot separate them and was not designed to. The calibration result is the one I would defend most firmly, because it rests on thousands of days rather than twenty windows. A 95% VaR fitted on trailing data breached at 8.58% and 6.38%. The per-step diagnostics show the misses are not spread evenly the 2008 window breached on 20.5% of days against 2.0% in 2010, which is the signature of volatility clustering defeating a model fitted on the calm that preceded it. The risk model was least trustworthy in precisely the window where trusting it would have cost the most. Widening the interval would not fix that; the failure is in assuming the next segment resembles the last one. None of this makes the comparison unknowable. One pre-declared contrast, twenty sealed windows, paired daily, leaves Arm A ahead on 3.0% of bootstrap paths a usable answer. What the era structure adds is that the effect's size and sign are not portable across regimes. What the calibration adds is that the uncertainty bands either arm would have shown you were too narrow. A study reporting only the 5.6 pp would have been technically correct and practically misleading; reporting all three is the point.
No search record exists for this study: the design was not promoted from a recorded evolving search, so the number of alternatives tried before it is UNKNOWN — which is a different fact from one. No deflated Sharpe is claimed; the honest statement is the raw out-of-sample result plus this disclosure. The out-of-sample windows are historical.
What would falsify this
On the ranking. Re-run the same twenty windows with the views removed equilibrium alone, no factor tilt. If the mechanism really is diversification through shrinkage, most of Arm B's advantage should survive. If it collapses, the edge was the factor signal applied twice and this interpretation is wrong. On the concentration mechanism. Force both arms to the same breadth, by tightening the position ceiling so the floor rises. The return gap should compress substantially. If it survives at matched breadth, concentration is not the channel. On the 2020s reversal. Re-run Arm B with an equal-weighted rather than capitalisation-weighted equilibrium prior. If 2020–2025 dominance weakens materially, that period's advantage was a large-cap tilt in a large-cap decade rather than a shrinkage benefit. Separately, re-run Arm A on a five-year in-sample block: if the 2020s collapse attenuates while the 2010s advantage persists, the failure is a COVID-contaminated lookback rather than historical means as such. On shrinkage overlap. Both arms already shrink the covariance. Re-run both with a raw sample covariance: if Arm A's deficit widens, the Ledoit-Wolf estimator was partially compensating for the return estimate all along, and the two shrinkages are substitutes rather than complements. On regime dependence. Extending the walk backward to a start clear of 2008, or forward as new years close, should keep the 2010s result near +7 pp for Arm A. A reversal in a fresh calm period would show even that reading is period-specific. On the risk finding. The VaR exceedance should replicate on any comparably concentrated long-only equity book spanning a volatility regime change. Breaches near 5% on such a book would locate the failure in this implementation rather than in trailing-fitted VaR. On costs. Turnover was not measured and costs were not modelled. A cost model large enough to close a 5.6 pp annual gap would be implausible for liquid large-caps; one large enough to close the 2010s +7.0 pp gap in Arm A's favour is not obviously implausible, and that would change the sign of the decade a reader most cares about.
5.3 Limitations
The views are not independent of the selection. This is the study's central weakness. The same equal-weighted composite that cuts the universe to a hundred names also supplies Arm B's views, so Arm B applies the factor signal twice once to choose the pool and again to tilt within it while Arm A applies it only once. Part of the measured gap is therefore attributable to a stronger factor bet rather than to the estimator. The falsification test above is designed to separate the two, and until it is run the honest description of Arm B is "Black-Litterman carrying this factor signal deeper", not "Black-Litterman". The start date is not neutral. Twenty one-year windows ending in 2025 forces a 2006 start, which places a systemic crisis in the third window. The era split is provided so the reader can take the post-2010 reading instead, but four pre-2010 windows is a very small sample on which a large part of the pooled result rests. Early-period data is thinner than the reconstruction admits. A material fraction of the 2006 point-in-time constituent set has no usable price history in the vendor data, and the missing names are disproportionately the firms that subsequently failed. They enter the universe and are dropped before the optimiser sees them. Because both arms see the identical surviving pool the contrast survives, but the absolute 2006–2010 figures for either arm should not be read as achievable real-world results. Costs and turnover are absent. No commission, spread, market impact or tax is modelled, and turnover is not reported. All figures are gross. Weight caps bind approximately, not exactly. After the holdings cap prunes to the top fifteen names the remaining weights are renormalised, which can carry the largest position slightly above the stated 20% ceiling. The effect is small and applies identically to both arms. Twenty windows is a small sample for a Sharpe comparison. The bootstrap's 3.0% is computed on paired daily differences, which is the better-powered framing, but the window-level evidence seven wins against twelve is thin on its own, and the era split divides an already small sample further. The search behind the design is unrecorded. This study was not promoted from a logged search, so the number of alternative designs considered before it is unknown. Unknown is not one. No deflated Sharpe is claimed anywhere in this paper for exactly that reason. One implementation, not the method in general. Every result is conditional on a 504-day covariance with Ledoit-Wolf shrinkage, a risk-aversion coefficient of 2.5, an information coefficient of 0.05, a confidence of 0.50, quarterly rebalancing and a fifteen-name cap. Other defensible settings exist for all of them, and this study measures none of that surface.
References
- Bailey, D. H., & López de Prado, M. (2014). The Deflated Sharpe Ratio: Correcting for Selection Bias, Backtest Overfitting, and Non-Normality. Journal of Portfolio Management, 40(5), 94–107. doi:10.3905/jpm.2014.40.5.094
- Gelman, A., & Loken, E. (2013). The garden of forking paths: Why multiple comparisons can be a problem, even when there is no “fishing expedition.” Working paper, Columbia University.
- Harvey, C. R., Liu, Y., & Zhu, H. (2016). … and the Cross-Section of Expected Returns. Review of Financial Studies, 29(1), 5–68. doi:10.1093/rfs/hhv059
- Lo, A. W. (2002). The Statistics of Sharpe Ratios. Financial Analysts Journal, 58(4), 36–52. doi:10.2469/faj.v58.n4.2453
- Markowitz, H. (1952). Portfolio Selection. Journal of Finance, 7(1), 77–91.
- Michaud, R. O. (1989). The Markowitz Optimization Enigma: Is 'Optimized' Optimal? Financial Analysts Journal, 45(1), 31–42.
- Black, F., & Litterman, R. (1992). Global Portfolio Optimization. Financial Analysts Journal, 48(5), 28–43.
- Grinold, R. C. (1994). Alpha is Volatility Times IC Times Score. Journal of Portfolio Management, 20(4), 9–16.
- He, G., & Litterman, R. (1999). The Intuition Behind Black-Litterman Model Portfolios. Goldman Sachs Investment Management Research.
- Ledoit, O., & Wolf, M. (2004). Honey, I Shrunk the Sample Covariance Matrix. Journal of Portfolio Management, 30(4), 110–119.
- DeMiguel, V., Garlappi, L., & Uppal, R. (2009). Optimal Versus Naive Diversification: How Inefficient is the 1/N Portfolio Strategy? Review of Financial Studies, 22(5), 1915–1953.
- Christoffersen, P. F. (1998). Evaluating Interval Forecasts. International Economic Review, 39(4), 841–862.
Appendix A Reproducibility in QuanterLab
Each step is backed by a frozen run report. The study is re-derivable from the ledger below.
| # | Commit | Report | Anchor | OOS window |
|---|---|---|---|---|
| 1 | c76caa203824 | 334 | 2006-01-01 | 2006-01-03 → 2006-12-29 |
| 2 | 3a4031fe2461 | 335 | 2007-01-01 | 2007-01-03 → 2007-12-31 |
| 3 | 76fbd607d12f | 336 | 2008-01-01 | 2008-01-02 → 2008-12-31 |
| 4 | cdf526219ab0 | 337 | 2009-01-01 | 2009-01-02 → 2009-12-31 |
| 5 | 0326b6fcbcbd | 338 | 2010-01-01 | 2010-01-04 → 2010-12-31 |
| 6 | 3eecf7b3fff1 | 339 | 2011-01-01 | 2011-01-03 → 2011-12-30 |
| 7 | 66e572c21727 | 340 | 2012-01-01 | 2012-01-03 → 2012-12-31 |
| 8 | 84248fc155a6 | 341 | 2013-01-01 | 2013-01-02 → 2013-12-31 |
| 9 | c3b74b70a8f1 | 342 | 2014-01-01 | 2014-01-02 → 2014-12-31 |
| 10 | 26a805511667 | 343 | 2015-01-01 | 2015-01-02 → 2015-12-31 |
| 11 | 5652cf1629bf | 344 | 2016-01-01 | 2016-01-04 → 2016-12-30 |
| 12 | e152e9524dff | 345 | 2017-01-01 | 2017-01-03 → 2017-12-29 |
| 13 | 3b5ce205eca2 | 347 | 2018-01-01 | 2018-01-02 → 2018-12-31 |
| 14 | 2240ee199e12 | 348 | 2019-01-01 | 2019-01-02 → 2019-12-31 |
| 15 | 66fa6734e2e2 | 349 | 2020-01-01 | 2020-01-02 → 2020-12-31 |
| 16 | 91ebc1f0d097 | 350 | 2021-01-01 | 2021-01-04 → 2021-12-31 |
| 17 | 006f496dea2a | 351 | 2022-01-01 | 2022-01-03 → 2022-12-30 |
| 18 | 86b97ef2d88f | 352 | 2023-01-01 | 2023-01-03 → 2023-12-29 |
| 19 | 5573fd49b18a | 353 | 2024-01-01 | 2024-01-02 → 2024-12-31 |
| 20 | a0af7d80af20 | 354 | 2025-01-01 | 2025-01-02 → 2025-12-31 |
Appendix A2 Sealed-hypothesis record
The integrity of a walk-forward rests on registering each hypothesis before its out-of-sample window is scored — the windows themselves are historical. The order below is the order in which the hypotheses were sealed.
“A COMPARATIVE study — Arm A vs Arm B, walked on the same sealed out-of-sample windows. Arm A: S&P 500, rebalanced quarterly across the selected basket, and run out-of-sample from the anchor — with no in-sample parameters to optimize, a walk-forward does not apply; its disposition is the realized forward path versus the benchmark. Arm B: S&P 500, rebalanced quarterly across the selected basket, and run out-of-sample from the anchor — with no in-sample parameters to optimize, a walk-forward does not apply; its disposition is the realized forward path versus the benchmark. The arms differ in: Portfolio Optimizer — return_method: historical_mean → black_litterman_views. The contrast under test: whether Arm A generates better risk-adjusted returns than Arm B over the identical out-of-sample windows.”
The same hypothesis was sealed independently at every step — registered before each step's out-of-sample window was scored:
| # | Anchor | Registered at |
|---|---|---|
| 1 | 2006-01-01 | 2026-07-28 |
| 2 | 2007-01-01 | 2026-07-28 |
| 3 | 2008-01-01 | 2026-07-28 |
| 4 | 2009-01-01 | 2026-07-28 |
| 5 | 2010-01-01 | 2026-07-28 |
| 6 | 2011-01-01 | 2026-07-28 |
| 7 | 2012-01-01 | 2026-07-28 |
| 8 | 2013-01-01 | 2026-07-28 |
| 9 | 2014-01-01 | 2026-07-28 |
| 10 | 2015-01-01 | 2026-07-28 |
| 11 | 2016-01-01 | 2026-07-28 |
| 12 | 2017-01-01 | 2026-07-28 |
| 13 | 2018-01-01 | 2026-07-28 |
| 14 | 2019-01-01 | 2026-07-28 |
| 15 | 2020-01-01 | 2026-07-28 |
| 16 | 2021-01-01 | 2026-07-28 |
| 17 | 2022-01-01 | 2026-07-28 |
| 18 | 2023-01-01 | 2026-07-28 |
| 19 | 2024-01-01 | 2026-07-28 |
| 20 | 2025-01-01 | 2026-07-28 |
Appendix B Per-step diagnostics
What each step's run actually did beyond its return: capital allocation across lanes and regimes, the portfolio book's rebalancing and cost drag, and how positions were sized. Harvested from the frozen run reports — present where the circuit produced them.
Step 1 · 2006-01-03 → 2006-12-29
Arm A
Portfolio book — rebalanced quarterly · 5 constructions · 11 names held · selection: reselect · 0% in cash
Projection accuracy — realized outcome fell inside the P5–P95 cone in 50% of 4 scored rebalances (an honest 90% band would contain ~90%) · 95% VaR breached on 12.15% of 247 days (expected ~5%)
| Rebalance | P5 | Median | P95 | Realized | In band | VaR 95 (1d) | Breaches |
|---|---|---|---|---|---|---|---|
| 2006-01-01 | 0.5008% | 13.174% | 28.838% | 1.0713% | yes | 1.3441% | 6 / 61 |
| 2006-04-01 | -1.5853% | 10.5882% | 24.3518% | -8.4249% | no | 1.2538% | 15 / 62 |
| 2006-07-01 | 0.9815% | 15.4501% | 32.0946% | -2.8582% | no | 1.5293% | 5 / 62 |
| 2006-10-01 | 0.2442% | 12.9415% | 27.3353% | 4.0116% | yes | 1.1902% | 4 / 62 |
| 2007-01-01 | no segment follows this rebalance — not scored | ||||||
Arm B
Portfolio book — rebalanced quarterly · 5 constructions · 14 names held · selection: reselect · 0% in cash · 1 name dropped from the held union of 52 (weights renormalised onto the rest)
Projection accuracy — realized outcome fell inside the P5–P95 cone in 100% of 4 scored rebalances (an honest 90% band would contain ~90%) · 95% VaR breached on 6.48% of 247 days (expected ~5%)
| Rebalance | P5 | Median | P95 | Realized | In band | VaR 95 (1d) | Breaches |
|---|---|---|---|---|---|---|---|
| 2006-01-01 | -3.011% | 9.9697% | 26.1294% | 7.8759% | yes | 1.5381% | 4 / 61 |
| 2006-04-01 | -8.8712% | 6.6342% | 24.892% | -7.4188% | yes | 1.8825% | 8 / 62 |
| 2006-07-01 | -4.6516% | 7.1151% | 20.4153% | -1.5643% | yes | 1.3856% | 2 / 62 |
| 2006-10-01 | -4.3303% | 6.4243% | 18.4612% | 3.1038% | yes | 1.1528% | 2 / 62 |
| 2007-01-01 | no segment follows this rebalance — not scored | ||||||
Step 2 · 2007-01-03 → 2007-12-31
Arm A
Portfolio book — rebalanced quarterly · 5 constructions · 14 names held · selection: reselect · 0% in cash · 1 name dropped from the held union of 45 (weights renormalised onto the rest)
Projection accuracy — realized outcome fell inside the P5–P95 cone in 75% of 4 scored rebalances (an honest 90% band would contain ~90%) · 95% VaR breached on 13.77% of 247 days (expected ~5%)
| Rebalance | P5 | Median | P95 | Realized | In band | VaR 95 (1d) | Breaches |
|---|---|---|---|---|---|---|---|
| 2007-01-01 | -2.369% | 11.55% | 25.9091% | 4.2124% | yes | 1.5253% | 6 / 60 |
| 2007-04-01 | -4.8758% | 5.519% | 17.1202% | 0.1423% | yes | 1.3082% | 5 / 62 |
| 2007-07-01 | -3.3827% | 8.1755% | 21.1959% | -5.8359% | no | 1.2317% | 13 / 62 |
| 2007-10-01 | -10.2043% | 12.5319% | 38.2547% | -0.7308% | yes | 1.4275% | 10 / 63 |
| 2008-01-01 | no segment follows this rebalance — not scored | ||||||
Arm B
Portfolio book — rebalanced quarterly · 5 constructions · 15 names held · selection: reselect · 0% in cash
Projection accuracy — realized outcome fell inside the P5–P95 cone in 100% of 4 scored rebalances (an honest 90% band would contain ~90%) · 95% VaR breached on 11.74% of 247 days (expected ~5%)
| Rebalance | P5 | Median | P95 | Realized | In band | VaR 95 (1d) | Breaches |
|---|---|---|---|---|---|---|---|
| 2007-01-01 | -4.4772% | 6.4342% | 17.4245% | 1.9089% | yes | 1.2197% | 6 / 60 |
| 2007-04-01 | -6.7502% | 8.8383% | 27.1469% | 9.1645% | yes | 1.8507% | 2 / 62 |
| 2007-07-01 | -5.4809% | 7.0591% | 21.3506% | 3.8783% | yes | 1.4633% | 9 / 62 |
| 2007-10-01 | -7.5665% | 7.1206% | 22.5428% | -0.018% | yes | 1.6258% | 12 / 63 |
| 2008-01-01 | no segment follows this rebalance — not scored | ||||||
Step 3 · 2008-01-02 → 2008-12-31
Arm A
Portfolio book — rebalanced quarterly · 4 constructions · 6 names held · selection: reselect · 0% in cash · 1 name dropped from the held union of 35 (weights renormalised onto the rest)
Projection accuracy — realized outcome fell inside the P5–P95 cone in 25% of 4 scored rebalances (an honest 90% band would contain ~90%) · 95% VaR breached on 20.48% of 249 days (expected ~5%)
| Rebalance | P5 | Median | P95 | Realized | In band | VaR 95 (1d) | Breaches |
|---|---|---|---|---|---|---|---|
| 2008-01-01 | -4.0322% | 12.2292% | 29.3802% | -18.1945% | no | 1.7155% | 14 / 60 |
| 2008-04-01 | -10.9565% | 8.1024% | 29.0222% | 0.7789% | yes | 2.3155% | 3 / 63 |
| 2008-07-01 | -8.0597% | 11.0339% | 31.8872% | -28.077% | no | 2.1783% | 12 / 63 |
| 2008-10-01 | -10.2081% | 2.2046% | 15.0168% | -19.3059% | no | 1.5376% | 22 / 63 |
Arm B
Portfolio book — rebalanced quarterly · 4 constructions · 15 names held · selection: reselect · 0% in cash
Projection accuracy — realized outcome fell inside the P5–P95 cone in 25% of 4 scored rebalances (an honest 90% band would contain ~90%) · 95% VaR breached on 21.69% of 249 days (expected ~5%)
| Rebalance | P5 | Median | P95 | Realized | In band | VaR 95 (1d) | Breaches |
|---|---|---|---|---|---|---|---|
| 2008-01-01 | -8.6656% | 5.4465% | 20.1496% | -13.221% | no | 1.6073% | 15 / 60 |
| 2008-04-01 | -10.0519% | 4.5367% | 19.897% | 0.1659% | yes | 1.8892% | 4 / 63 |
| 2008-07-01 | -11.9925% | 5.6691% | 24.8519% | -20.1517% | no | 2.2494% | 12 / 63 |
| 2008-10-01 | -19.9759% | 0.4457% | 23.585% | -27.1313% | no | 2.7126% | 23 / 63 |
Step 4 · 2009-01-02 → 2009-12-31
Arm A
Portfolio book — rebalanced quarterly · 5 constructions · 10 names held · selection: reselect · 0% in cash · 1 name dropped from the held union of 26 (weights renormalised onto the rest)
Projection accuracy — realized outcome fell inside the P5–P95 cone in 100% of 4 scored rebalances (an honest 90% band would contain ~90%) · 95% VaR breached on 4.03% of 248 days (expected ~5%)
| Rebalance | P5 | Median | P95 | Realized | In band | VaR 95 (1d) | Breaches |
|---|---|---|---|---|---|---|---|
| 2009-01-01 | -19.036% | 3.9988% | 30.5624% | -13.5082% | yes | 2.5309% | 9 / 60 |
| 2009-04-01 | -25.2724% | 3.4% | 43.3443% | -3.9474% | yes | 3.7242% | 0 / 62 |
| 2009-07-01 | -28.8271% | 9.0142% | 60.8334% | 17.8704% | yes | 3.9362% | 0 / 63 |
| 2009-10-01 | -26.6216% | 10.7691% | 61.2683% | 8.6379% | yes | 4.3555% | 1 / 63 |
| 2010-01-01 | no segment follows this rebalance — not scored | ||||||
Arm B
Portfolio book — rebalanced quarterly · 5 constructions · 15 names held · selection: reselect · 0% in cash
Projection accuracy — realized outcome fell inside the P5–P95 cone in 100% of 4 scored rebalances (an honest 90% band would contain ~90%) · 95% VaR breached on 3.23% of 248 days (expected ~5%)
| Rebalance | P5 | Median | P95 | Realized | In band | VaR 95 (1d) | Breaches |
|---|---|---|---|---|---|---|---|
| 2009-01-01 | -20.6108% | 0.5981% | 24.7418% | -13.6495% | yes | 2.4474% | 8 / 60 |
| 2009-04-01 | -28.079% | -1.7242% | 34.5321% | 13.4482% | yes | 3.7628% | 0 / 62 |
| 2009-07-01 | -34.7262% | -1.24% | 44.084% | 14.9083% | yes | 4.1891% | 0 / 63 |
| 2009-10-01 | -30.283% | 0.7837% | 41.0503% | 13.3392% | yes | 4.062% | 0 / 63 |
| 2010-01-01 | no segment follows this rebalance — not scored | ||||||
Step 5 · 2010-01-04 → 2010-12-31
Arm A
Portfolio book — rebalanced quarterly · 5 constructions · 10 names held · selection: reselect · 0% in cash · 1 name dropped from the held union of 30 (weights renormalised onto the rest)
Projection accuracy — realized outcome fell inside the P5–P95 cone in 100% of 4 scored rebalances (an honest 90% band would contain ~90%) · 95% VaR breached on 2.02% of 248 days (expected ~5%)
| Rebalance | P5 | Median | P95 | Realized | In band | VaR 95 (1d) | Breaches |
|---|---|---|---|---|---|---|---|
| 2010-01-01 | -24.1533% | 6.4477% | 44.834% | 9.352% | yes | 3.5422% | 0 / 60 |
| 2010-04-01 | -21.1282% | 9.48% | 52.2566% | -13.7313% | yes | 3.2999% | 4 / 62 |
| 2010-07-01 | -24.8228% | 5.8839% | 44.7105% | 11.4776% | yes | 3.7763% | 1 / 63 |
| 2010-10-01 | -22.1968% | 13.5203% | 60.2243% | 13.4141% | yes | 4.1386% | 0 / 63 |
| 2011-01-01 | no segment follows this rebalance — not scored | ||||||
Arm B
Portfolio book — rebalanced quarterly · 5 constructions · 15 names held · selection: reselect · 0% in cash
Projection accuracy — realized outcome fell inside the P5–P95 cone in 100% of 4 scored rebalances (an honest 90% band would contain ~90%) · 95% VaR breached on 1.61% of 248 days (expected ~5%)
| Rebalance | P5 | Median | P95 | Realized | In band | VaR 95 (1d) | Breaches |
|---|---|---|---|---|---|---|---|
| 2010-01-01 | -30.2787% | -0.5432% | 37.3383% | 0.6268% | yes | 4.1926% | 1 / 60 |
| 2010-04-01 | -28.1758% | 1.9161% | 44.91% | -13.4187% | yes | 4.0523% | 3 / 62 |
| 2010-07-01 | -28.2355% | 1.2889% | 38.695% | 10.4554% | yes | 4.0285% | 0 / 63 |
| 2010-10-01 | -31.0856% | 3.6302% | 50.3454% | 15.4893% | yes | 4.9118% | 0 / 63 |
| 2011-01-01 | no segment follows this rebalance — not scored | ||||||
Step 6 · 2011-01-03 → 2011-12-30
Arm A
Portfolio book — rebalanced quarterly · 5 constructions · 6 names held · selection: reselect · 0% in cash · 1 name dropped from the held union of 29 (weights renormalised onto the rest)
Projection accuracy — realized outcome fell inside the P5–P95 cone in 75% of 4 scored rebalances (an honest 90% band would contain ~90%) · 95% VaR breached on 7.66% of 248 days (expected ~5%)
| Rebalance | P5 | Median | P95 | Realized | In band | VaR 95 (1d) | Breaches |
|---|---|---|---|---|---|---|---|
| 2011-01-01 | -0.9227% | 24.5474% | 59.878% | 2.3772% | yes | 2.7189% | 2 / 61 |
| 2011-04-01 | -3.8092% | 16.9742% | 42.4101% | 4.9763% | yes | 2.1503% | 0 / 62 |
| 2011-07-01 | -1.9163% | 13.2581% | 29.137% | -11.8249% | no | 1.4838% | 14 / 63 |
| 2011-10-01 | -4.1259% | 7.9684% | 21.6724% | 10.8689% | yes | 1.3685% | 3 / 62 |
| 2012-01-01 | no segment follows this rebalance — not scored | ||||||
Arm B
Portfolio book — rebalanced quarterly · 5 constructions · 15 names held · selection: reselect · 0% in cash
Projection accuracy — realized outcome fell inside the P5–P95 cone in 75% of 4 scored rebalances (an honest 90% band would contain ~90%) · 95% VaR breached on 6.85% of 248 days (expected ~5%)
| Rebalance | P5 | Median | P95 | Realized | In band | VaR 95 (1d) | Breaches |
|---|---|---|---|---|---|---|---|
| 2011-01-01 | -17.9357% | 9.1082% | 48.8958% | 1.6991% | yes | 3.654% | 0 / 61 |
| 2011-04-01 | -12.5509% | 11.3294% | 41.9297% | 0.7005% | yes | 2.9273% | 0 / 62 |
| 2011-07-01 | -7.5245% | 8.5672% | 25.6745% | -14.3844% | no | 1.8525% | 14 / 63 |
| 2011-10-01 | -12.976% | 2.3579% | 20.5072% | 10.6743% | yes | 2.0328% | 3 / 62 |
| 2012-01-01 | no segment follows this rebalance — not scored | ||||||
Step 7 · 2012-01-03 → 2012-12-31
Arm A
Portfolio book — rebalanced quarterly · 4 constructions · 9 names held · selection: reselect · 0% in cash
Projection accuracy — realized outcome fell inside the P5–P95 cone in 100% of 4 scored rebalances (an honest 90% band would contain ~90%) · 95% VaR breached on 5.69% of 246 days (expected ~5%)
| Rebalance | P5 | Median | P95 | Realized | In band | VaR 95 (1d) | Breaches |
|---|---|---|---|---|---|---|---|
| 2012-01-01 | -3.8562% | 7.4532% | 21.3215% | 4.5808% | yes | 1.2315% | 1 / 61 |
| 2012-04-01 | -4.6015% | 11.5892% | 30.6466% | 1.4472% | yes | 1.7415% | 8 / 62 |
| 2012-07-01 | -6.305% | 5.9037% | 19.7886% | 1.9219% | yes | 1.4185% | 0 / 62 |
| 2012-10-01 | -6.0886% | 7.8444% | 25.4224% | -0.5322% | yes | 1.5748% | 5 / 61 |
Arm B
Portfolio book — rebalanced quarterly · 4 constructions · 15 names held · selection: reselect · 0% in cash
Projection accuracy — realized outcome fell inside the P5–P95 cone in 100% of 4 scored rebalances (an honest 90% band would contain ~90%) · 95% VaR breached on 0.81% of 246 days (expected ~5%)
| Rebalance | P5 | Median | P95 | Realized | In band | VaR 95 (1d) | Breaches |
|---|---|---|---|---|---|---|---|
| 2012-01-01 | -10.5186% | 4.5193% | 23.8324% | 10.6174% | yes | 1.9254% | 0 / 61 |
| 2012-04-01 | -12.7875% | 7.8789% | 33.6076% | -8.424% | yes | 2.7489% | 2 / 62 |
| 2012-07-01 | -14.8037% | 3.6634% | 26.2773% | 6.8182% | yes | 2.3783% | 0 / 62 |
| 2012-10-01 | -12.6369% | 5.3923% | 29.3443% | 1.8554% | yes | 2.2685% | 0 / 61 |
Step 8 · 2013-01-02 → 2013-12-31
Arm A
Portfolio book — rebalanced quarterly · 5 constructions · 15 names held · selection: reselect · 0% in cash
Projection accuracy — realized outcome fell inside the P5–P95 cone in 100% of 4 scored rebalances (an honest 90% band would contain ~90%) · 95% VaR breached on 4.03% of 248 days (expected ~5%)
| Rebalance | P5 | Median | P95 | Realized | In band | VaR 95 (1d) | Breaches |
|---|---|---|---|---|---|---|---|
| 2013-01-01 | -11.7815% | 7.9771% | 28.4137% | 12.624% | yes | 2.1336% | 2 / 59 |
| 2013-04-01 | -8.2099% | 8.5274% | 26.4415% | 1.6817% | yes | 1.7068% | 5 / 63 |
| 2013-07-01 | -10.846% | 9.4305% | 31.9209% | 4.7269% | yes | 2.201% | 1 / 63 |
| 2013-10-01 | -3.7478% | 11.711% | 27.9663% | 9.2284% | yes | 1.585% | 2 / 63 |
| 2014-01-01 | no segment follows this rebalance — not scored | ||||||
Arm B
Portfolio book — rebalanced quarterly · 5 constructions · 15 names held · selection: reselect · 0% in cash
Projection accuracy — realized outcome fell inside the P5–P95 cone in 100% of 4 scored rebalances (an honest 90% band would contain ~90%) · 95% VaR breached on 2.02% of 248 days (expected ~5%)
| Rebalance | P5 | Median | P95 | Realized | In band | VaR 95 (1d) | Breaches |
|---|---|---|---|---|---|---|---|
| 2013-01-01 | -18.2899% | 4.5932% | 29.2616% | 6.4868% | yes | 2.8103% | 1 / 59 |
| 2013-04-01 | -15.7313% | 5.8495% | 30.319% | 0.7522% | yes | 2.5899% | 2 / 63 |
| 2013-07-01 | -14.761% | 4.2125% | 25.1785% | 0.875% | yes | 2.1949% | 1 / 63 |
| 2013-10-01 | -5.0562% | 10.1815% | 26.2028% | 11.8569% | yes | 1.5593% | 1 / 63 |
| 2014-01-01 | no segment follows this rebalance — not scored | ||||||
Step 9 · 2014-01-02 → 2014-12-31
Arm A
Portfolio book — rebalanced quarterly · 5 constructions · 15 names held · selection: reselect · 0% in cash
Projection accuracy — realized outcome fell inside the P5–P95 cone in 100% of 4 scored rebalances (an honest 90% band would contain ~90%) · 95% VaR breached on 7.66% of 248 days (expected ~5%)
| Rebalance | P5 | Median | P95 | Realized | In band | VaR 95 (1d) | Breaches |
|---|---|---|---|---|---|---|---|
| 2014-01-01 | -4.2425% | 9.123% | 22.8765% | 7.5786% | yes | 1.4544% | 5 / 60 |
| 2014-04-01 | -0.9893% | 12.3473% | 27.574% | 1.616% | yes | 1.4027% | 5 / 62 |
| 2014-07-01 | -4.9318% | 7.7376% | 20.7601% | -1.6861% | yes | 1.5032% | 3 / 63 |
| 2014-10-01 | -0.4072% | 12.9299% | 26.6463% | 10.4811% | yes | 1.2856% | 6 / 63 |
| 2015-01-01 | no segment follows this rebalance — not scored | ||||||
Arm B
Portfolio book — rebalanced quarterly · 5 constructions · 15 names held · selection: reselect · 0% in cash · 1 name dropped from the held union of 48 (weights renormalised onto the rest)
Projection accuracy — realized outcome fell inside the P5–P95 cone in 100% of 4 scored rebalances (an honest 90% band would contain ~90%) · 95% VaR breached on 6.05% of 248 days (expected ~5%)
| Rebalance | P5 | Median | P95 | Realized | In band | VaR 95 (1d) | Breaches |
|---|---|---|---|---|---|---|---|
| 2014-01-01 | -7.208% | 9.4928% | 27.2584% | 0.0736% | yes | 1.8321% | 3 / 60 |
| 2014-04-01 | -4.5031% | 9.8893% | 26.5539% | 3.9803% | yes | 1.6567% | 4 / 62 |
| 2014-07-01 | -4.5044% | 8.8643% | 22.6834% | 1.7796% | yes | 1.4151% | 3 / 63 |
| 2014-10-01 | -3.0608% | 8.9996% | 21.3038% | 7.208% | yes | 1.3033% | 5 / 63 |
| 2015-01-01 | no segment follows this rebalance — not scored | ||||||
Step 10 · 2015-01-02 → 2015-12-31
Arm A
Portfolio book — rebalanced quarterly · 5 constructions · 10 names held · selection: reselect · 0% in cash
Projection accuracy — realized outcome fell inside the P5–P95 cone in 75% of 4 scored rebalances (an honest 90% band would contain ~90%) · 95% VaR breached on 10.08% of 248 days (expected ~5%)
| Rebalance | P5 | Median | P95 | Realized | In band | VaR 95 (1d) | Breaches |
|---|---|---|---|---|---|---|---|
| 2015-01-01 | -2.0814% | 9.3979% | 20.9899% | 6.6245% | yes | 1.2307% | 6 / 60 |
| 2015-04-01 | -0.0348% | 12.5864% | 26.8888% | 0.0284% | yes | 1.34% | 2 / 62 |
| 2015-07-01 | -1.0032% | 11.7162% | 24.7376% | -7.7177% | no | 1.3571% | 10 / 63 |
| 2015-10-01 | -3.9434% | 9.751% | 23.9374% | 4.2906% | yes | 1.3702% | 7 / 63 |
| 2016-01-01 | no segment follows this rebalance — not scored | ||||||
Arm B
Portfolio book — rebalanced quarterly · 5 constructions · 15 names held · selection: reselect · 0% in cash · 5 names dropped from the held union of 48 (weights renormalised onto the rest)
Projection accuracy — realized outcome fell inside the P5–P95 cone in 75% of 4 scored rebalances (an honest 90% band would contain ~90%) · 95% VaR breached on 8.06% of 248 days (expected ~5%)
| Rebalance | P5 | Median | P95 | Realized | In band | VaR 95 (1d) | Breaches |
|---|---|---|---|---|---|---|---|
| 2015-01-01 | -6.7621% | 5.8186% | 18.7145% | 0.9486% | yes | 1.3933% | 5 / 60 |
| 2015-04-01 | -3.4369% | 8.9352% | 22.9786% | 4.3803% | yes | 1.4923% | 3 / 62 |
| 2015-07-01 | -4.6735% | 7.5782% | 20.1213% | -7.0607% | no | 1.3996% | 7 / 63 |
| 2015-10-01 | -7.5904% | 5.3319% | 18.6879% | 9.8948% | yes | 1.3985% | 5 / 63 |
| 2016-01-01 | no segment follows this rebalance — not scored | ||||||
Step 11 · 2016-01-04 → 2016-12-30
Arm A
Portfolio book — rebalanced quarterly · 4 constructions · 9 names held · selection: reselect · 0% in cash · 1 name dropped from the held union of 30 (weights renormalised onto the rest)
Projection accuracy — realized outcome fell inside the P5–P95 cone in 100% of 4 scored rebalances (an honest 90% band would contain ~90%) · 95% VaR breached on 8.47% of 248 days (expected ~5%)
| Rebalance | P5 | Median | P95 | Realized | In band | VaR 95 (1d) | Breaches |
|---|---|---|---|---|---|---|---|
| 2016-01-01 | -2.5107% | 10.2562% | 23.2992% | 2.2932% | yes | 1.2406% | 7 / 60 |
| 2016-04-01 | -5.4582% | 7.1189% | 20.0441% | 5.4852% | yes | 1.3871% | 4 / 63 |
| 2016-07-01 | -2.4785% | 10.1876% | 23.1697% | 1.1714% | yes | 1.2578% | 4 / 63 |
| 2016-10-01 | -5.2613% | 8.3077% | 23.9164% | 6.117% | yes | 1.5358% | 6 / 62 |
Arm B
Portfolio book — rebalanced quarterly · 4 constructions · 15 names held · selection: reselect · 0% in cash
Projection accuracy — realized outcome fell inside the P5–P95 cone in 75% of 4 scored rebalances (an honest 90% band would contain ~90%) · 95% VaR breached on 4.44% of 248 days (expected ~5%)
| Rebalance | P5 | Median | P95 | Realized | In band | VaR 95 (1d) | Breaches |
|---|---|---|---|---|---|---|---|
| 2016-01-01 | -9.5572% | 4.216% | 18.5397% | 1.3646% | yes | 1.709% | 5 / 60 |
| 2016-04-01 | -8.7235% | 4.9619% | 19.2262% | -9.9351% | no | 1.6536% | 3 / 63 |
| 2016-07-01 | -7.7722% | 4.5947% | 17.3152% | -0.9075% | yes | 1.3194% | 2 / 63 |
| 2016-10-01 | -8.8172% | 4.6335% | 20.1644% | 4.7222% | yes | 1.573% | 1 / 62 |
Step 12 · 2017-01-03 → 2017-12-29
Arm A
Portfolio book — rebalanced quarterly · 5 constructions · 12 names held · selection: reselect · 0% in cash
Projection accuracy — realized outcome fell inside the P5–P95 cone in 100% of 4 scored rebalances (an honest 90% band would contain ~90%) · 95% VaR breached on 2.43% of 247 days (expected ~5%)
| Rebalance | P5 | Median | P95 | Realized | In band | VaR 95 (1d) | Breaches |
|---|---|---|---|---|---|---|---|
| 2017-01-01 | -6.2958% | 7.3241% | 24.46% | 4.986% | yes | 1.6985% | 1 / 61 |
| 2017-04-01 | -10.5695% | 3.8817% | 20.7731% | 3.8826% | yes | 1.8708% | 1 / 62 |
| 2017-07-01 | -2.676% | 10.9666% | 26.6181% | 11.5917% | yes | 1.4746% | 2 / 62 |
| 2017-10-01 | -4.7709% | 8.0881% | 22.7739% | 11.7356% | yes | 1.4738% | 2 / 62 |
| 2018-01-01 | no segment follows this rebalance — not scored | ||||||
Arm B
Portfolio book — rebalanced quarterly · 5 constructions · 15 names held · selection: reselect · 0% in cash · 1 name dropped from the held union of 51 (weights renormalised onto the rest)
Projection accuracy — realized outcome fell inside the P5–P95 cone in 100% of 4 scored rebalances (an honest 90% band would contain ~90%) · 95% VaR breached on 3.24% of 247 days (expected ~5%)
| Rebalance | P5 | Median | P95 | Realized | In band | VaR 95 (1d) | Breaches |
|---|---|---|---|---|---|---|---|
| 2017-01-01 | -9.8346% | 4.4635% | 22.6704% | 2.8554% | yes | 1.9721% | 2 / 61 |
| 2017-04-01 | -9.3993% | 4.7659% | 21.2482% | 5.5306% | yes | 1.7674% | 3 / 62 |
| 2017-07-01 | -9.9039% | 3.5734% | 19.1633% | 5.1343% | yes | 1.6439% | 2 / 62 |
| 2017-10-01 | -8.7408% | 6.2908% | 23.908% | 6.4629% | yes | 1.757% | 1 / 62 |
| 2018-01-01 | no segment follows this rebalance — not scored | ||||||
Step 13 · 2018-01-02 → 2018-12-31
Arm A
Portfolio book — rebalanced quarterly · 5 constructions · 13 names held · selection: reselect · 0% in cash
Projection accuracy — realized outcome fell inside the P5–P95 cone in 75% of 4 scored rebalances (an honest 90% band would contain ~90%) · 95% VaR breached on 15.79% of 247 days (expected ~5%)
| Rebalance | P5 | Median | P95 | Realized | In band | VaR 95 (1d) | Breaches |
|---|---|---|---|---|---|---|---|
| 2018-01-01 | -2.0655% | 9.1165% | 20.3788% | 2.4525% | yes | 1.1617% | 9 / 60 |
| 2018-04-01 | -1.1726% | 13.2668% | 28.2691% | 0.9583% | yes | 1.3366% | 6 / 63 |
| 2018-07-01 | -0.1369% | 13.0482% | 28.0666% | 6.3712% | yes | 1.3094% | 6 / 62 |
| 2018-10-01 | 0.6157% | 12.1061% | 24.9873% | -19.934% | no | 1.1701% | 18 / 62 |
| 2019-01-01 | no segment follows this rebalance — not scored | ||||||
Arm B
Portfolio book — rebalanced quarterly · 5 constructions · 15 names held · selection: reselect · 0% in cash
Projection accuracy — realized outcome fell inside the P5–P95 cone in 75% of 4 scored rebalances (an honest 90% band would contain ~90%) · 95% VaR breached on 12.96% of 247 days (expected ~5%)
| Rebalance | P5 | Median | P95 | Realized | In band | VaR 95 (1d) | Breaches |
|---|---|---|---|---|---|---|---|
| 2018-01-01 | -7.5887% | 4.7099% | 17.2969% | -3.6671% | yes | 1.4514% | 9 / 60 |
| 2018-04-01 | -3.9735% | 9.4172% | 23.2528% | 9.1284% | yes | 1.3125% | 5 / 63 |
| 2018-07-01 | -5.5521% | 7.2223% | 21.8143% | 2.3838% | yes | 1.544% | 3 / 62 |
| 2018-10-01 | -4.8847% | 5.9234% | 18.0335% | -17.0698% | no | 1.2109% | 15 / 62 |
| 2019-01-01 | no segment follows this rebalance — not scored | ||||||
Step 14 · 2019-01-02 → 2019-12-31
Arm A
Portfolio book — rebalanced quarterly · 5 constructions · 13 names held · selection: reselect · 0% in cash
Projection accuracy — realized outcome fell inside the P5–P95 cone in 100% of 4 scored rebalances (an honest 90% band would contain ~90%) · 95% VaR breached on 6.05% of 248 days (expected ~5%)
| Rebalance | P5 | Median | P95 | Realized | In band | VaR 95 (1d) | Breaches |
|---|---|---|---|---|---|---|---|
| 2019-01-01 | -2.2441% | 8.427% | 19.1285% | 8.3941% | yes | 1.1051% | 3 / 60 |
| 2019-04-01 | -3.1086% | 7.7399% | 19.877% | -0.3266% | yes | 1.2619% | 7 / 62 |
| 2019-07-01 | -2.6788% | 8.7428% | 20.3255% | 3.2939% | yes | 1.3567% | 4 / 63 |
| 2019-10-01 | -2.7612% | 8.5212% | 19.9497% | 7.4556% | yes | 1.1312% | 1 / 63 |
| 2020-01-01 | no segment follows this rebalance — not scored | ||||||
Arm B
Portfolio book — rebalanced quarterly · 5 constructions · 15 names held · selection: reselect · 0% in cash
Projection accuracy — realized outcome fell inside the P5–P95 cone in 100% of 4 scored rebalances (an honest 90% band would contain ~90%) · 95% VaR breached on 4.44% of 248 days (expected ~5%)
| Rebalance | P5 | Median | P95 | Realized | In band | VaR 95 (1d) | Breaches |
|---|---|---|---|---|---|---|---|
| 2019-01-01 | -7.1764% | 3.9662% | 15.245% | 7.6573% | yes | 1.2935% | 2 / 60 |
| 2019-04-01 | -9.5006% | 4.8759% | 21.6402% | -2.198% | yes | 1.9859% | 5 / 62 |
| 2019-07-01 | -8.6268% | 4.7704% | 18.6959% | -2.5738% | yes | 1.6812% | 3 / 63 |
| 2019-10-01 | -10.4789% | 3.4575% | 18.0528% | 8.2046% | yes | 1.8159% | 1 / 63 |
| 2020-01-01 | no segment follows this rebalance — not scored | ||||||
Step 15 · 2020-01-02 → 2020-12-31
Arm A
Portfolio book — rebalanced quarterly · 4 constructions · 15 names held · selection: reselect · 0% in cash
Projection accuracy — realized outcome fell inside the P5–P95 cone in 75% of 4 scored rebalances (an honest 90% band would contain ~90%) · 95% VaR breached on 12.45% of 249 days (expected ~5%)
| Rebalance | P5 | Median | P95 | Realized | In band | VaR 95 (1d) | Breaches |
|---|---|---|---|---|---|---|---|
| 2020-01-01 | -3.3054% | 8.6655% | 23.4299% | -23.3751% | no | 1.4257% | 17 / 61 |
| 2020-04-01 | -13.5633% | 3.4241% | 23.8793% | 18.968% | yes | 2.1117% | 5 / 62 |
| 2020-07-01 | -11.6956% | 8.9073% | 31.864% | 12.3429% | yes | 2.1287% | 5 / 63 |
| 2020-10-01 | -14.2606% | 9.1343% | 35.9979% | 6.0301% | yes | 2.3275% | 4 / 63 |
Arm B
Portfolio book — rebalanced quarterly · 4 constructions · 15 names held · selection: reselect · 0% in cash
Projection accuracy — realized outcome fell inside the P5–P95 cone in 50% of 4 scored rebalances (an honest 90% band would contain ~90%) · 95% VaR breached on 10.04% of 249 days (expected ~5%)
| Rebalance | P5 | Median | P95 | Realized | In band | VaR 95 (1d) | Breaches |
|---|---|---|---|---|---|---|---|
| 2020-01-01 | -10.352% | 4.2631% | 22.9485% | -16.9508% | no | 1.9259% | 15 / 61 |
| 2020-04-01 | -19.5209% | 2.009% | 29.4768% | 33.561% | no | 3.0491% | 3 / 62 |
| 2020-07-01 | -18.116% | 7.7872% | 38.4981% | 10.1143% | yes | 2.9137% | 4 / 63 |
| 2020-10-01 | -17.3778% | 8.6517% | 39.4833% | 7.44% | yes | 3.2119% | 3 / 63 |
Step 16 · 2021-01-04 → 2021-12-31
Arm A
Portfolio book — rebalanced quarterly · 5 constructions · 10 names held · selection: reselect · 0% in cash
Projection accuracy — realized outcome fell inside the P5–P95 cone in 100% of 4 scored rebalances (an honest 90% band would contain ~90%) · 95% VaR breached on 4.84% of 248 days (expected ~5%)
| Rebalance | P5 | Median | P95 | Realized | In band | VaR 95 (1d) | Breaches |
|---|---|---|---|---|---|---|---|
| 2021-01-01 | -16.5787% | 14.9441% | 53.8021% | 7.4086% | yes | 3.7306% | 3 / 60 |
| 2021-04-01 | -16.2456% | 12.6694% | 51.8283% | 7.1321% | yes | 3.1823% | 1 / 62 |
| 2021-07-01 | -9.7778% | 12.7184% | 38.0952% | 1.1783% | yes | 2.3379% | 0 / 63 |
| 2021-10-01 | -2.9182% | 25.3487% | 58.2513% | 0.6549% | yes | 2.2418% | 8 / 63 |
| 2022-01-01 | no segment follows this rebalance — not scored | ||||||
Arm B
Portfolio book — rebalanced quarterly · 5 constructions · 15 names held · selection: reselect · 0% in cash
Projection accuracy — realized outcome fell inside the P5–P95 cone in 100% of 4 scored rebalances (an honest 90% band would contain ~90%) · 95% VaR breached on 2.02% of 248 days (expected ~5%)
| Rebalance | P5 | Median | P95 | Realized | In band | VaR 95 (1d) | Breaches |
|---|---|---|---|---|---|---|---|
| 2021-01-01 | -20.2737% | 10.5745% | 48.8382% | 11.5523% | yes | 3.2424% | 3 / 60 |
| 2021-04-01 | -16.868% | 7.7619% | 39.9% | 11.1796% | yes | 3.0946% | 0 / 62 |
| 2021-07-01 | -15.9582% | 10.0424% | 40.7135% | 4.3587% | yes | 3.0529% | 1 / 63 |
| 2021-10-01 | -14.3606% | 11.0219% | 40.681% | 3.3202% | yes | 2.4923% | 1 / 63 |
| 2022-01-01 | no segment follows this rebalance — not scored | ||||||
Step 17 · 2022-01-03 → 2022-12-30
Arm A
Portfolio book — rebalanced quarterly · 5 constructions · 10 names held · selection: reselect · 0% in cash
Projection accuracy — realized outcome fell inside the P5–P95 cone in 50% of 4 scored rebalances (an honest 90% band would contain ~90%) · 95% VaR breached on 10.93% of 247 days (expected ~5%)
| Rebalance | P5 | Median | P95 | Realized | In band | VaR 95 (1d) | Breaches |
|---|---|---|---|---|---|---|---|
| 2022-01-01 | -4.7424% | 20.1947% | 54.922% | -12.7099% | no | 2.465% | 13 / 61 |
| 2022-04-01 | -7.0308% | 11.6355% | 36.3134% | -17.5502% | no | 1.8248% | 10 / 61 |
| 2022-07-01 | -7.0763% | 10.9616% | 30.4509% | -1.2746% | yes | 1.9668% | 2 / 63 |
| 2022-10-01 | -8.893% | 12.0236% | 37.9079% | -1.6926% | yes | 2.3429% | 2 / 62 |
| 2023-01-01 | no segment follows this rebalance — not scored | ||||||
Arm B
Portfolio book — rebalanced quarterly · 5 constructions · 15 names held · selection: reselect · 0% in cash
Projection accuracy — realized outcome fell inside the P5–P95 cone in 75% of 4 scored rebalances (an honest 90% band would contain ~90%) · 95% VaR breached on 9.72% of 247 days (expected ~5%)
| Rebalance | P5 | Median | P95 | Realized | In band | VaR 95 (1d) | Breaches |
|---|---|---|---|---|---|---|---|
| 2022-01-01 | -12.4461% | 9.5724% | 39.9728% | -4.6385% | yes | 2.4489% | 6 / 61 |
| 2022-04-01 | -12.0635% | 9.7688% | 39.8308% | -19.2271% | no | 2.2849% | 13 / 61 |
| 2022-07-01 | -9.3367% | 7.3032% | 25.13% | -3.0904% | yes | 1.8566% | 3 / 63 |
| 2022-10-01 | -12.8218% | 6.5639% | 30.4124% | 11.8956% | yes | 2.4062% | 2 / 62 |
| 2023-01-01 | no segment follows this rebalance — not scored | ||||||
Step 18 · 2023-01-03 → 2023-12-29
Arm A
Portfolio book — rebalanced quarterly · 5 constructions · 9 names held · selection: reselect · 0% in cash
Projection accuracy — realized outcome fell inside the P5–P95 cone in 100% of 4 scored rebalances (an honest 90% band would contain ~90%) · 95% VaR breached on 4.47% of 246 days (expected ~5%)
| Rebalance | P5 | Median | P95 | Realized | In band | VaR 95 (1d) | Breaches |
|---|---|---|---|---|---|---|---|
| 2023-01-01 | -3.8949% | 10.3173% | 28.2399% | -0.0397% | yes | 1.6587% | 3 / 61 |
| 2023-04-01 | -5.8785% | 9.9704% | 30.3312% | -4.2684% | yes | 1.9488% | 4 / 61 |
| 2023-07-01 | -6.7553% | 8.2319% | 25.7369% | -1.2011% | yes | 1.7028% | 2 / 62 |
| 2023-10-01 | -7.8942% | 8.413% | 27.7284% | 9.3481% | yes | 1.748% | 2 / 62 |
| 2024-01-01 | no segment follows this rebalance — not scored | ||||||
Arm B
Portfolio book — rebalanced quarterly · 5 constructions · 15 names held · selection: reselect · 0% in cash
Projection accuracy — realized outcome fell inside the P5–P95 cone in 100% of 4 scored rebalances (an honest 90% band would contain ~90%) · 95% VaR breached on 0.81% of 246 days (expected ~5%)
| Rebalance | P5 | Median | P95 | Realized | In band | VaR 95 (1d) | Breaches |
|---|---|---|---|---|---|---|---|
| 2023-01-01 | -8.7743% | 9.0962% | 32.6209% | 2.2376% | yes | 2.1619% | 1 / 61 |
| 2023-04-01 | -16.9435% | 2.9937% | 30.2564% | 17.0383% | yes | 2.883% | 0 / 61 |
| 2023-07-01 | -18.7111% | 3.3509% | 31.5842% | -1.5418% | yes | 3.0471% | 0 / 62 |
| 2023-10-01 | -18.0775% | 1.7536% | 26.5446% | 7.4598% | yes | 2.6936% | 1 / 62 |
| 2024-01-01 | no segment follows this rebalance — not scored | ||||||
Step 19 · 2024-01-02 → 2024-12-31
Arm A
Portfolio book — rebalanced quarterly · 4 constructions · 15 names held · selection: reselect · 0% in cash
Projection accuracy — realized outcome fell inside the P5–P95 cone in 75% of 4 scored rebalances (an honest 90% band would contain ~90%) · 95% VaR breached on 7.26% of 248 days (expected ~5%)
| Rebalance | P5 | Median | P95 | Realized | In band | VaR 95 (1d) | Breaches |
|---|---|---|---|---|---|---|---|
| 2024-01-01 | -8.6399% | 9.2315% | 28.4819% | 19.6761% | yes | 1.9159% | 0 / 60 |
| 2024-04-01 | -2.2246% | 18.5581% | 43.9195% | -2.4372% | no | 2.0326% | 5 / 62 |
| 2024-07-01 | -2.0171% | 16.9205% | 37.3683% | 3.2432% | yes | 1.6628% | 11 / 63 |
| 2024-10-01 | -5.7652% | 5.5069% | 16.96% | 3.4819% | yes | 1.1848% | 2 / 63 |
Arm B
Portfolio book — rebalanced quarterly · 4 constructions · 15 names held · selection: reselect · 0% in cash
Projection accuracy — realized outcome fell inside the P5–P95 cone in 100% of 4 scored rebalances (an honest 90% band would contain ~90%) · 95% VaR breached on 2.82% of 248 days (expected ~5%)
| Rebalance | P5 | Median | P95 | Realized | In band | VaR 95 (1d) | Breaches |
|---|---|---|---|---|---|---|---|
| 2024-01-01 | -22.2608% | 3.4441% | 34.098% | 25.8653% | yes | 3.332% | 0 / 60 |
| 2024-04-01 | -16.8047% | 7.4812% | 39.0633% | 10.5029% | yes | 3.0571% | 1 / 62 |
| 2024-07-01 | -13.8337% | 10.5549% | 38.7729% | 0.2692% | yes | 2.6487% | 5 / 63 |
| 2024-10-01 | -12.7117% | 12.1075% | 40.8514% | 10.1974% | yes | 2.5262% | 1 / 63 |
Step 20 · 2025-01-02 → 2025-12-31
Arm A
Portfolio book — rebalanced quarterly · 5 constructions · 12 names held · selection: reselect · 0% in cash
Projection accuracy — realized outcome fell inside the P5–P95 cone in 75% of 4 scored rebalances (an honest 90% band would contain ~90%) · 95% VaR breached on 11.38% of 246 days (expected ~5%)
| Rebalance | P5 | Median | P95 | Realized | In band | VaR 95 (1d) | Breaches |
|---|---|---|---|---|---|---|---|
| 2025-01-01 | -4.4065% | 7.5785% | 19.0478% | 7.0354% | yes | 1.3114% | 5 / 59 |
| 2025-04-01 | -3.3314% | 6.0895% | 17.4236% | 5.8446% | yes | 1.0687% | 10 / 61 |
| 2025-07-01 | -0.1989% | 12.8637% | 26.2634% | 1.6633% | yes | 1.0889% | 5 / 63 |
| 2025-10-01 | -1.8927% | 13.477% | 29.5862% | -2.3119% | no | 1.2983% | 8 / 63 |
| 2026-01-01 | no segment follows this rebalance — not scored | ||||||
Arm B
Portfolio book — rebalanced quarterly · 5 constructions · 15 names held · selection: reselect · 0% in cash
Projection accuracy — realized outcome fell inside the P5–P95 cone in 75% of 4 scored rebalances (an honest 90% band would contain ~90%) · 95% VaR breached on 8.54% of 246 days (expected ~5%)
| Rebalance | P5 | Median | P95 | Realized | In band | VaR 95 (1d) | Breaches |
|---|---|---|---|---|---|---|---|
| 2025-01-01 | -6.3267% | 16.5561% | 40.5869% | -19.0073% | no | 2.38% | 9 / 59 |
| 2025-04-01 | -6.2785% | 7.2711% | 24.3062% | 11.4676% | yes | 1.6414% | 6 / 61 |
| 2025-07-01 | -10.3755% | 13.1413% | 39.9334% | 16.247% | yes | 2.4433% | 0 / 63 |
| 2025-10-01 | -10.916% | 15.5338% | 46.4517% | 16.3821% | yes | 2.8031% | 6 / 63 |
| 2026-01-01 | no segment follows this rebalance — not scored | ||||||