


Greenblatt's Value-Weighted Index Taken Apart: Twenty Years of the Thirty Cheapest S&P 500 Companies
Joel Greenblatt, the investor behind the Magic Formula, made a second argument in a later book, The Big Secret for the Small Investor. An index fund, he wrote, does better when it splits its money by how cheap each company is than when it splits it by each company's size, the way the S&P 500 does, or equally. A company that costs half as much for the same profit gets twice the money.
We tested a version of the idea on a portfolio a person can hold: Greenblatt weighted a whole index, and we took only its thirty cheapest companies. Every January for twenty years we took the S&P 500 as it stood that day, picked the thirty companies that were cheapest against the profit their business makes, and split the money among those thirty in three ways: by how cheap each one was, equally, and by size. We held each portfolio for the year, with dividends and after trading costs, and measured it against the equal-weight S&P 500. Then we measured the same years again with two changes: financial companies left out, and a limit on how much of the money one company can hold.
Among the same thirty companies the order Greenblatt gave for a whole index held: weighting by how cheap ended first, equal weights second and weighting by size last, though with the mildest falls. Weighting by how cheap beat equal weights in every version we ran. In the first run, locked year by year before it ran, it also beat the equal-weight S&P 500, but that lead rests on a price in our data: in one year a price adjusted for a spin-off years later made one company look far cheaper than it was, and with no limit per company it took most of the money. With a limit per company, it stayed ahead only because of the banks among the thirty, ranked by a measure that says little for a bank. Each version that still beat the index keeps one of the two; with the banks out and the limit on, weighting by how cheap ended a little behind it. The thirty cheapest in equal weights never beat the index.
What Greenblatt's weighting is
Joel Greenblatt has run money since the eighties and has taught at Columbia Business School for many years. Most readers know him from The Little Book That Beats the Market and its Magic Formula: buy good companies at cheap prices. In The Big Secret for the Small Investor he turned to the index fund. An S&P 500 fund splits its money by the size of each company, so the more a company's price climbs, the more of the money it holds, whether its business earns more or not. An equal-weight fund gives every company the same share and so stops chasing the price. Greenblatt's answer goes one step further: split the money by how cheap each company is. His firm later built funds on the idea, and Robert Arnott's fundamental index, which weights companies by their sales, cash flow, dividends and book value instead of their market price, is a cousin of it.
The measure of cheap we used is the one many value investors use for whole companies: enterprise value to EBITDA. Enterprise value is what the whole company would cost to buy: its shares at the market price, plus its debt, minus its cash. EBITDA is the profit its business makes before interest, taxes and the write-down of what it owns. Both come from each company's latest quarterly statement, its shares priced at the end of that quarter, so the profit is that one quarter's, not a year's, and a business with busy and quiet seasons ranks on whichever quarter came last. A company at a low multiple costs little for each dollar of profit.
People usually read Greenblatt's weighting as a way to buy more of the bargains. It does that, and underneath it is also a way to put much of the money into a few companies: the cheaper a company looks, the more it gets, and nothing in the rule stops one company from looking very cheap. Greenblatt's own Magic Formula leaves financial companies out, because for a bank the measure means something else. A bank's raw material is the money it borrows from its depositors, and its cash can come close to the price of the whole bank, so its enterprise value comes out near nothing and the bank looks almost free.
The rules, step by step
Every year, on the first of January:
1. Take the S&P 500 as it stood that day, rebuilt from the index's change log.
2. Read each member's latest quarterly statement filed on or before that day, as first filed, by the filing dates in our data (a few are wrong, as the Limitations say), and its last close before it, the last close of December.
3. Rank the members by enterprise value to EBITDA from that statement, cheapest first. A value at or below zero, from either a negative EBITDA or a negative enterprise value, not both, counts as the dearest, so it never reaches the thirty and never gets a negative share. Keep the 30 cheapest among the members with a price and a market value that day.
4. Split the money among the same 30 companies in three ways:
• By how cheap: each company's share follows its EBITDA to enterprise value, so a company twice as cheap gets twice the money.
• Equal weights: one thirtieth each.
• By size: each company's share follows its market value at December's last close.
5. Buy them at the first close of January and hold them to the last close of December with no trading in between, dividends included, paying 0.1% of the amount on every purchase and every sale.
6. Start again the next January.
The yardstick is the equal-weight S&P 500 (RSP), bought at the first close of January and held to the last, with its dividends and no trading costs.
The first run, written down and locked year by year before it ran, had two races: by how cheap against equal weights, and by how cheap against by size. After it ran, we measured three more versions of the same twenty years on the same engine and data: financial companies left out, a limit of 15% of the money in one company, and both. A version with financial companies left out is compared with equal weights of its own thirty.
What we found, in short
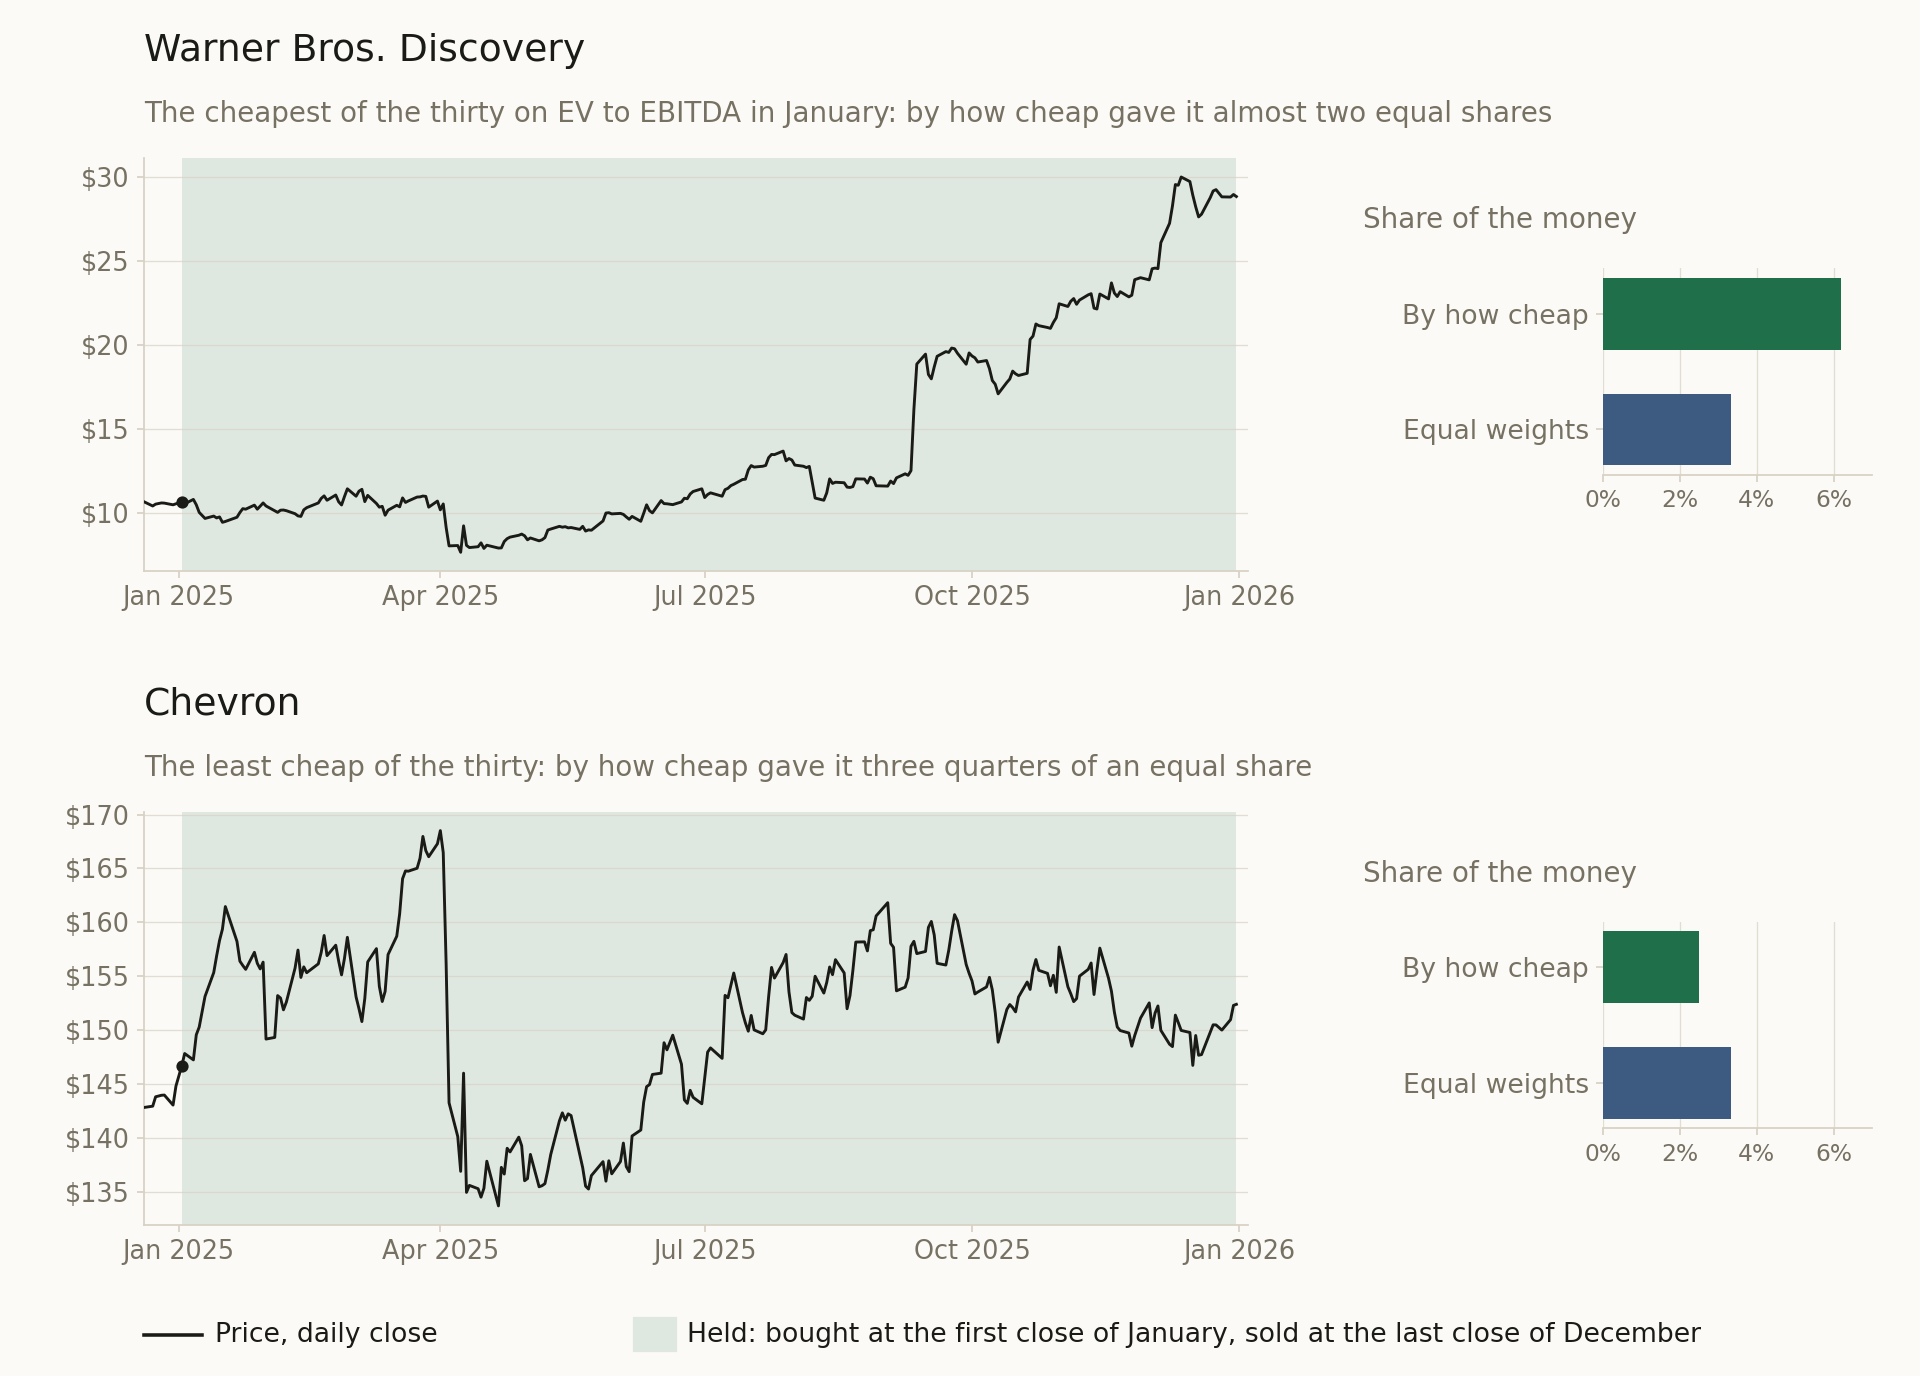
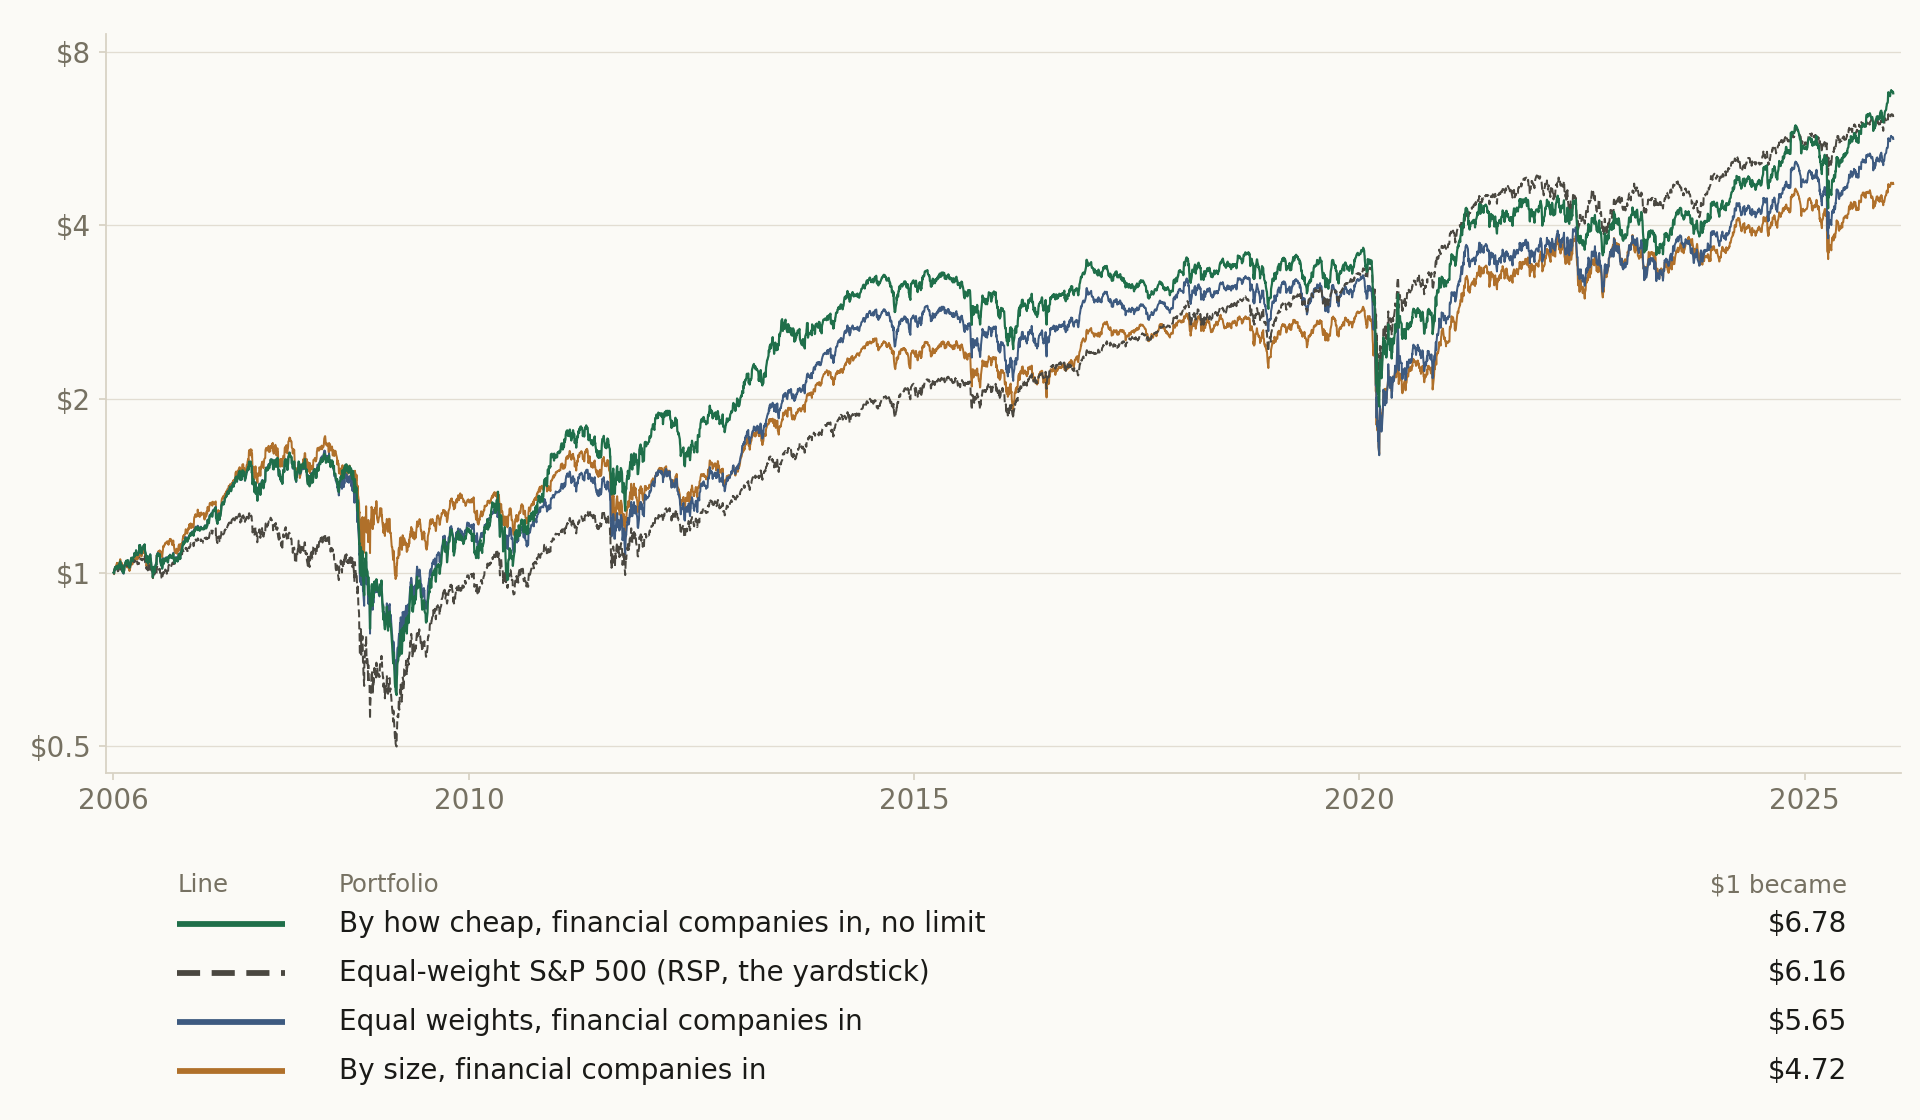
Did weighting by how cheap beat equal weights of the same thirty companies? Yes, in every version we ran (Figure 2, Table 1). Figure 1 shows how the money moves: the cheapest of the thirty gets more than an equal share, the least cheap gets less.
Did it beat the equal-weight S&P 500? In the first run, yes (Figure 2). But that lead rests on a faulty price, and the version with a limit per company stays ahead only because of the banks: two problems, one in the measure and one in our data, and each moved the result by a large step in a single year.
The first is the banks. A bank's cash can come close to the price of the whole bank, so on this measure it looks almost free. In one January a single bank, Zions, took most of the money that way, and that year the portfolio trailed equal weights of the same thirty by a wide margin. Zions is a fine bank, but it was never most of a sensible portfolio. So with no limit per company the banks cost the portfolio money. With a limit the sign turns: the banks added, and leaving them out is what took the portfolio from ahead of the index to behind it (Table 1).
The second is a price. In another January FMC Technologies took most of the money, because our price for it then is adjusted for a spin-off that came years later, which made the company look far smaller, and so far cheaper, than it was on the day. With no limit per company nothing held it back, and that year the portfolio ran far ahead of equal weights. This is the larger of the two steps, and the version without banks but with no limit, the best in Table 1, still carries it.
So each version that still beat the index keeps one of the two problems: the version with a limit keeps the banks, and the version without banks keeps FMC Technologies' price. With the banks out and the faulty prices held to the limit, weighting by how cheap ended a little behind the index, and still ahead of equal weights of its own thirty (Table 1).
Did the thirty cheapest beat the equal-weight S&P 500 when each got the same share? No, in every version (Table 1).
What about weighting by size, the way an ordinary index fund splits its money? It ended last of the three, behind equal weights, the order Greenblatt gave for a whole index. It also fell the least in the financial crisis: the biggest of the cheap companies held up better in the crash and grew less in the years between (Figure 2, Table 1).
1 Methodology, in detail (click to open)
1 Methodology
Universe: the S&P 500's members on each first of January, 2006 to 2025, rebuilt from the index's change log. Fundamentals: each member's latest quarterly statement filed on or before the first of January, as first filed by the filing dates in our data, its enterprise value priced at that quarter's end and its EBITDA that quarter's alone, not twelve months'; market value from our own daily prices at the last close before it. Ranking: the platform's Value Factor on enterprise value to EBITDA, a value at or below zero ranked dearest (the card's negatives setting: from 11 to 40 members a January, 421 member-years, 377 of them on a negative EBITDA and 44 on a negative enterprise value, nearly all banks; twice a bank had both negative, which reads as an ordinary value, and neither was among the thirty); Factor Select keeps the 30 cheapest among the members with a price and a market value at December's last close, the same 30 in every weighting. Weighting: Portfolio Σ, By how cheap (each weight in proportion to EBITDA to enterprise value), Equal, or By size (market value at December's last close); no limit per company in the first run (Max weight 0). Holding: the Portfolio Forward Test, bought at the first close of January (the next close after the first of January) and held to the last close of December with no rebalance inside it, dividends credited on the ex-date, 0.1% on each purchase and each sale (the Transaction Cost card). Yardstick: RSP, the equal-weight S&P 500, bought at the first close of January and held to the last, with its dividends and no trading costs. First run: two races over 20 one-year runs, each year written down and locked before it ran; by how cheap against equal weights ran all 20 years; by how cheap against by size ran all 20 in its second run, locked afresh after its first stopped in January 2012 on a fault in the platform; the first run's six years, the same as the second's, stay on the record. Measured versions, run on the live engine on 31 October 2026: financial companies out (each year's list without the members filed under financial services, 65 to 87 a year), a limit of 15% in one company (Portfolio Σ Max weight 0.15, the card's default), and both. Two control years, 2006 and 2013, run the same way on the full list, reproduce the first run exactly, and the equal-weight portfolio of the limit-only version matches the first run's equal weights in all 20 years.
2 Results
Findings
Table 1 sets every version and the yardstick side by side over the twenty years.
2.1 Headline
Table 1. Every version from 2006 to 2025: what $1 became, the return a year, in how many of the 20 years it beat equal weights and the equal-weight S&P 500, and its worst year. A version with financial companies out is compared with Equal weights, financial companies out. Locked: written down and locked year by year before it ran. Measured: run once afterwards on the same engine and data. By size, financial companies in (locked) ran 2006 to 2011: $1 became $1.40 by the end of 2011, against $1.67 by how cheap, $1.35 in equal weights and $1.16 in the equal-weight S&P 500 over the same six years; by how cheap beat it in 3 of the 6 years.
| Version | $1 became | A year | Years ahead of equal weights | Years ahead of the equal-weight S&P 500 | Worst year |
|---|---|---|---|---|---|
| By how cheap, financial companies in, no limit (locked) | $6.78 | 10.0% | 13 of 20 | 11 of 20 | −39.8% (2008) |
| Equal weights, financial companies in (locked) | $5.65 | 9.0% | 7 of 20 | −40.3% (2008) | |
| By how cheap, financial companies in, with a limit per company ( | $6.44 | 9.8% | 14 of 20 | 10 of 20 | −39.8% (2008) |
| By how cheap, financial companies out, no limit (measured) | $7.07 | 10.3% | 12 of 20 | 12 of 20 | −40.4% (2008) |
| By how cheap, financial companies out, with a limit per company | $5.81 | 9.2% | 12 of 20 | 11 of 20 | −40.4% (2008) |
| Equal weights, financial companies out (measured) | $5.12 | 8.5% | 8 of 20 | −40.5% (2008) | |
| Equal-weight S&P 500 (RSP, the yardstick) | $6.16 | 9.5% | −39.1% (2008) |
Sections 2.2 to 4, the full record: every year, every test, and how each one was run (click to open)
2.2 Per-step results
| # | Out-of-sample window | Weighted by cheapness SR | Equal weights SR | By size, financial companies in SR | By size, the run stopped in January 2012 SR |
|---|---|---|---|---|---|
| 1 | 2006-01-03 → 2006-12-29 | 1.27 | 1.27 | 1.60 | 1.60 |
| 2 | 2007-01-03 → 2007-12-31 | 1.48 | 1.51 | 1.48 | 1.48 |
| 3 | 2008-01-02 → 2008-12-31 | -1.01 | -1.03 | -0.33 | -0.33 |
| 4 | 2009-01-02 → 2009-12-31 | 0.74 | 0.86 | 0.22 | 0.22 |
| 5 | 2010-01-04 → 2010-12-31 | 1.10 | 0.76 | 0.74 | 0.74 |
| 6 | 2011-01-03 → 2011-12-30 | 0.26 | 0.07 | -0.10 | -0.10 |
| 7 | 2012-01-03 → 2012-12-31 | 0.92 | 0.74 | 0.51 | n/a |
| 8 | 2013-01-02 → 2013-12-31 | 1.73 | 3.15 | 2.87 | n/a |
| 9 | 2014-01-02 → 2014-12-31 | 1.08 | 1.07 | 0.67 | n/a |
| 10 | 2015-01-02 → 2015-12-31 | -0.50 | -0.49 | -0.35 | n/a |
| 11 | 2016-01-04 → 2016-12-30 | 0.95 | 1.04 | 0.94 | n/a |
| 12 | 2017-01-03 → 2017-12-29 | -0.10 | 0.29 | 0.50 | n/a |
| 13 | 2018-01-02 → 2018-12-31 | -0.50 | -0.59 | -0.80 | n/a |
| 14 | 2019-01-02 → 2019-12-31 | 1.11 | 1.07 | 1.34 | n/a |
| 15 | 2020-01-02 → 2020-12-31 | -0.01 | -0.10 | -0.11 | n/a |
| 16 | 2021-01-04 → 2021-12-31 | 1.42 | 1.43 | 1.60 | n/a |
| 17 | 2022-01-03 → 2022-12-30 | -0.29 | -0.09 | 0.20 | n/a |
| 18 | 2023-01-03 → 2023-12-29 | 0.68 | 0.67 | 0.29 | n/a |
| 19 | 2024-01-02 → 2024-12-31 | 1.39 | 1.35 | 1.15 | n/a |
| 20 | 2025-01-02 → 2025-12-31 | 1.00 | 0.84 | 0.58 | n/a |
2.3 Search accounting
No search record exists for this design. It was not promoted from a recorded evolving search, so the number of alternatives tried before it, on paper, in another tool, or in the author's head, is unknown. Unknown is a different fact from one: a study with no lineage is not a strategy with one trial, it is a strategy with an unrecorded number of them. Accordingly no count of alternatives tried is claimed, and nothing in this paper is corrected for a search that was never recorded; the number that stands is the raw out-of-sample result plus this disclosure. The registered per-step record below (§4) still guarantees each window's hypothesis was hashed and registered before that window was scored.
2.4 The comparison
Both arms trade the same registered windows, so their returns can be PAIRED: inside each window the two return series are inner-joined date by date and the difference rWeighted by cheapness − rEqual weights is the object under test. Because this is ONE pre-declared contrast, frozen at registration before any window was scored, the paired statistic needs no multiple-testing deflation, and the per-arm pooled numbers above are likewise uncorrected, because this design has no recorded search to correct against (§2.3). The paired contrast carries that gap differently from the arm levels: it was declared before each window ran and it is scored on the difference, so no window could be read first and scored after. What the timestamps cannot speak to is how this contrast came to be the declared one, which is the limit §2.3 states.
In the table: Arm A = Weighted by cheapness · Arm B = Equal weights.
| # | Window | Paired bars | Arm A | Arm B | Δ | Leader | By size, financial companies in | By size, the run stopped in January 2012 |
|---|---|---|---|---|---|---|---|---|
| 1 | 2006-01-04 → 2006-12-29 | 250 | +19.2% | +19.4% | -0.2 pp | Arm B | +26.2% | +26.2% |
| 2 | 2007-01-04 → 2007-12-31 | 250 | +33.2% | +33.0% | +0.1 pp | Arm A | +33.8% | +33.8% |
| 3 | 2008-01-03 → 2008-12-31 | 252 | -39.8% | -40.3% | +0.5 pp | Arm A | -23.4% | -23.4% |
| 4 | 2009-01-05 → 2009-12-31 | 251 | +23.2% | +26.9% | -3.7 pp | Arm B | +2.4% | +2.4% |
| 5 | 2010-01-05 → 2010-12-31 | 251 | +37.7% | +14.7% | +22.9 pp | Arm A | +13.3% | +13.3% |
| 6 | 2011-01-04 → 2011-12-30 | 251 | +3.4% | -2.2% | +5.6 pp | Arm A | -6.6% | -6.6% |
| 7 | 2012-01-04 → 2012-12-31 | 249 | +17.0% | +12.7% | +4.3 pp | Arm A | +7.3% | n/a |
| 8 | 2013-01-03 → 2013-12-31 | 251 | +40.9% | +58.2% | -17.3 pp | Arm B | +48.0% | n/a |
| 9 | 2014-01-03 → 2014-12-31 | 251 | +15.1% | +14.7% | +0.4 pp | Arm A | +7.5% | n/a |
| 10 | 2015-01-05 → 2015-12-31 | 251 | -10.5% | -10.2% | -0.3 pp | Arm B | -7.2% | n/a |
| 11 | 2016-01-05 → 2016-12-30 | 251 | +18.8% | +21.3% | -2.5 pp | Arm B | +17.2% | n/a |
| 12 | 2017-01-04 → 2017-12-29 | 250 | -1.6% | +2.4% | -4.0 pp | Arm B | +4.3% | n/a |
| 13 | 2018-01-03 → 2018-12-31 | 250 | -9.7% | -10.7% | +0.9 pp | Arm A | -12.9% | n/a |
| 14 | 2019-01-03 → 2019-12-31 | 251 | +19.0% | +17.0% | +2.1 pp | Arm A | +19.5% | n/a |
| 15 | 2020-01-03 → 2020-12-31 | 252 | -9.7% | -13.7% | +4.0 pp | Arm A | -11.0% | n/a |
| 16 | 2021-01-05 → 2021-12-31 | 251 | +32.0% | +31.2% | +0.8 pp | Arm A | +36.1% | n/a |
| 17 | 2022-01-04 → 2022-12-30 | 250 | -9.5% | -5.8% | -3.7 pp | Arm B | +1.7% | n/a |
| 18 | 2023-01-04 → 2023-12-29 | 249 | +12.7% | +12.4% | +0.2 pp | Arm A | +3.8% | n/a |
| 19 | 2024-01-03 → 2024-12-31 | 251 | +25.5% | +23.3% | +2.2 pp | Arm A | +17.4% | n/a |
| 20 | 2025-01-03 → 2025-12-31 | 249 | +24.6% | +18.8% | +5.8 pp | Arm A | +11.1% | n/a |
Paired Sharpe of the difference track: 0.19 · block bootstrap (2000 paths, block 10, seed 1234): P(Weighted by cheapness beats Equal weights) = 80.3%.
Window win-rate. Weighted by cheapness led 13 of 20 windows (65.0%), Equal weights led 7, and the mean window gap of +0.90 pp points the same way. Widest single window: 2010 at +22.9 pp.
| Period | Windows | Weighted by cheapness | Equal weights | Mean gap | Weighted by cheapness led |
|---|---|---|---|---|---|
| All windows | 20 | +12.06% | +11.15% | +0.90 pp | 13/20 |
| Before 2010 | 4 | +8.91% | +9.74% | -0.83 pp | 2/4 |
| 2010 onward | 16 | +12.84% | +11.51% | +1.34 pp | 11/16 |
The two eras disagree by 2.17 pp. The pooled figure is therefore not a standing property of either method, it is dominated by the later period. Read the two rows, not the average.
3 The circuit
The strategy is a circuit of platform primitives, frozen when the study is registered. Below is the circuit as wired on the canvas, the objective it encodes and how the search runs through it, followed by the mathematics each primitive actually computes, the same formulas the execution engine runs. The complete parameterisation is preserved in the study ledger (Appendix A).
The sentence below is the registration record, generated when the circuit was registered and printed verbatim; the authored description of the design is Section 1.
A COMPARATIVE study: Weighted by cheapness vs Equal weights, walked on the same registered out-of-sample windows. Weighted by cheapness: S&P 500, rebalanced none across the selected basket, and run out-of-sample from the anchor: anything the design estimates from history, where it estimates at all, is re-estimated at each anchor from pre-anchor data only, and the walk advances through registered out-of-sample windows; its disposition is the realized forward path versus the benchmark. Equal weights: S&P 500, rebalanced none across the selected basket, and run out-of-sample from the anchor: anything the design estimates from history, where it estimates at all, is re-estimated at each anchor from pre-anchor data only, and the walk advances through registered out-of-sample windows; its disposition is the realized forward path versus the benchmark. The arms differ in: Portfolio Σ, Weighting: By how cheap → Equal weights. The contrast under test: whether Weighted by cheapness generates better risk-adjusted returns than Equal weights over the identical out-of-sample windows.
Every block in this study is a card from the platform's catalog: the Universe card's S&P 500 as it stood each January, the Fundamentals Loader, the Value Factor on enterprise value to EBITDA, the Factor Composite, Factor Select's thirty cheapest, Portfolio Σ's weighting, and the Portfolio Forward Test with its Transaction Cost card.
Envelopes show counts, ratios, dates, and the parameters the author chose. Full price and per-name data series are not republished: the underlying market data is licensed to QuanterLab. Point figures quoted in the prose, a named holding's return over a stated span, are summary facts derived from public market prices, not redistributed series.
The objective and the search
Weighted by cheapness
| Universe | S&P 500 index constituents. |
|---|---|
| Validation & out-of-sample | portfolio forward test (holds the weights it is given, re-set at each rebalance) (1y horizon from the anchor, none rebalance, each decision traded at the next day's close, dividends counted); overlays: Transaction Cost. |
| Other components | Combine: Portfolio Σ; Factor models: Factor Composite, Factor Select, Fundamentals Loader (PIT), Value Factor. |
Equal weights
The specification is identical to Weighted by cheapness's table above, row for row; the one registered difference between the arms is itemized below.
What differs between the arms, one difference; the comparison is clean:
- paramPortfolio Σ, Weighting: By how cheap → Equal weights
Companion book. By size, financial companies in comes from a companion run whose one change against this study's Weighted by cheapness arm is Portfolio Builder, scheme: cheapness → cap_weighted. Its results run through this paper's tables under its own name.
Companion book. By size, the run stopped in January 2012 comes from a companion run whose one change against this study's Weighted by cheapness arm is Portfolio Builder, scheme: cheapness → cap_weighted. Its results run through this paper's tables under its own name.
Everything else is held identical, so an out-of-sample gap between the arms is attributable to this one change.
Cost elements are wired into the circuit, the realised drag is reported per step in Appendix B.
Show the mathematics, 8 primitives, formulas and parity notes
3.1 Universe
The starting set of tickers, resolved point-in-time from the index change-log, so names delisted or removed later still compete on the dates they traded.
Before any math, you need a list of stocks. An index preset (S&P 500, Nasdaq-100, Dow 30) is reconstructed as it stood ON your anchor date by replaying the historical add/drop change-log backwards, so a 2018 backtest sees the 2018 membership, not today's winners.
Start from today's constituents and un-apply every membership change after the anchor t:
\mathcal{U}(t) = \mathcal{U}_{\text{now}} \;\ominus\; \{\text{adds after } t\} \;\oplus\; \{\text{drops after } t\}3.2 Factor Loader
Point-in-time fundamentals, never let the user see a number before the SEC did.
Loads ~23 fundamental metrics (valuation, quality, growth) per name, but with one inviolable rule: a financial statement becomes visible only on or after its SEC acceptedDate. A 2020 backtest sees only what was actually filed by 2020, no look-ahead, ever.
\text{visible}(f, t) \iff \text{acceptedDate}(f) \le t3.3 Factor Value
Value, how cheap is the stock, cross-sectionally?
Blends cheapness metrics, P/E, P/B, P/S, EV/EBITDA (lower is better) plus free-cash-flow and earnings yields (higher is better). Each metric is z-scored across the universe, winsorized against outliers, weighted by the importance you set (Off/Low/Med/High), and averaged.
z_{i,k} = \pm\,\frac{x_{i,k} - \bar x_k}{s_k}\text{Value}_i = \frac{\sum_k \omega_k\,z_{i,k}}{\sum_k \omega_k}, \quad \omega \in \{0,\,0.5,\,1,\,2\}3.4 Factor Composite
The weighting console, blend Value, Quality, Momentum, Growth into one 0–100 score.
Where the four factor families become a single ranking. Each family score is standardized across the universe, blended with your slider weights (or the radar's suggested tilt), and min-max scaled to 0–100. Winsorizing tames outliers; z-score or percentile normalization is your choice.
z_{i,f} = \frac{x_{i,f} - \bar x_f}{s_f}\quad(\text{clipped at the 1st / 99th percentile})C_i = \sum_f W_f\,z_{i,f}, \qquad \text{score}_i = 100\cdot\frac{C_i - \min_j C_j}{\max_j C_j - \min_j C_j}3.5 Factor Top Tier
The cut out of the factor lane, keep the top-ranked names.
Takes the composite-ranked factor set and keeps the best N, carrying the composite score, the four family scores and the point-in-time market cap for each survivor. Feed 10–20 to a direct portfolio, or 30–100 as an optimizer pool.
\{\, i : \operatorname{rank}(C_i) \le N\,\}, \quad C_i = \text{composite score}3.6 Portfolio Builder
From "which names" to "how much of each", the weighting rules.
Turns a basket into capital weights by a simple rule: equal weight, score-weighted, inverse-volatility, or cap-weighted. An optional max-weight cap waterfills the excess onto the under-cap names so nothing is over-concentrated.
w_i^{\text{eq}}=\tfrac1N,\quad w_i^{\text{score}}\propto \text{score}_i,\quad w_i^{\text{ivol}}\propto \tfrac{1}{\sigma_i},\quad w_i^{\text{cap}}\propto \text{mktcap}_iClip any weight above the cap, redistribute the excess proportionally to names still under the cap, and repeat until none exceed it (≤ 24 rounds).
w_i \leftarrow \min(w_i, w_{\max}); \;\; \text{redistribute excess} \propto w_j\,[w_j < w_{\max}]3.7 Portfolio Backtest
Replay the portfolio forward, rebalanced, point-in-time, with costs.
Holds the basket and rebalances on schedule, re-selecting and re-optimizing point-in-time at each rebalance (so it only ever uses information available then), and reports the equity curve, Sharpe, drawdown and trade stats, optionally net of cost and risk overlays.
E_t = E_{t-1}\big(1 + \mathbf w_{t}^{\top}\mathbf r_t - \text{costs}_t\big)\text{DD}_t = \frac{E_t}{\max_{\tau\le t}E_\tau} - 1, \qquad \text{MaxDD} = \min_t \text{DD}_t\text{charge}_t \;=\; \text{loan}_t \cdot \frac{\text{spread}}{252}, \qquad \text{loan}_t = \begin{cases}\max(0,\,-\text{cash}_t) & \text{institutional (netted)}\\ \max(0,\,\text{long MV}_t - E_t) & \text{retail (no netting)}\end{cases}\mathbf w_k = \{\, w_{k,i} : i \in \text{held} \,\}, \qquad \text{cash}_k = 1 - \textstyle\sum_{i \in \text{held}} w_{k,i}3.8 Transaction Cost
Charge for trading, slippage + commission on every turn.
Real trading isn't free. This deducts a cost proportional to how much you trade (turnover), in basis points, so the backtest reflects net, not gross, performance.
\text{cost}_t = \frac{\text{bps}}{10{,}000}\;\times\;\text{turnover}_t, \qquad \text{turnover}_t = \tfrac12\sum_i \lvert w_{i,t}-w_{i,t^-}\rvert4 Projection calibration, pooled across the walk
Every rebalance carried a Monte Carlo cone and a 95% VaR estimated before the segment it is scored against. Two questions, pooled over the whole study: did realized outcomes land inside the band as often as the band claims, and were VaR breaches as frequent as 5%?
This section is produced by the forward tester itself: every portfolio backtest fits the cone and the VaR estimate at each rebalance and scores them against the segment that followed. It does not require, and this circuit does not contain, a Monte Carlo primitive; that primitive is a separate, standalone analysis.
| Arm | Steps | Rebalances | In band | Coverage | Expected | VaR days | Breach rate | Expected |
|---|---|---|---|---|---|---|---|---|
| Weighted by cheapness | 20 | 20 | 18 / 20 | 90.0% ±6.71 | 90.0% | 5011 | 5.83% ±0.331 | 5.0% |
| Equal weights | 20 | 20 | 18 / 20 | 90.0% ±6.71 | 90.0% | 5011 | 5.93% ±0.334 | 5.0% |
| By size, financial companies in (companion run) | 20 | 20 | 17 / 20 | 85.0% ±7.98 | 90.0% | 5011 | 5.31% ±0.317 | 5.0% |
| By size, the run stopped in January 2012 (companion run) | 6 | 6 | 5 / 6 | 83.3% ±15.21 | 90.0% | 1505 | 6.45% ±0.633 | 5.0% |
± values are binomial standard errors on the estimate. A coverage figure below the expected band means the projection was over-confident; a breach rate above 5% means the same of the risk model. Both forecasts used only data prior to the segment scored.
5 Discussion
5.1 Interpretation
Inside the cheap end of the market Greenblatt's weighting did what he said it would. More money in the cheaper companies earned more than the same money spread evenly, with financial companies in or out, with a limit or without, and the even split earned more than the split by size. Against the index, the thirty cheapest in equal weights never came out ahead, and weighting them by how cheap came out ahead only while the banks were in or FMC Technologies' faulty price had no limit. One explanation that fits: on this measure the cheapest companies are often cheap because the market expects their profit to fall, oil producers near the top of a cycle, media companies losing their audience, makers of memory chips in a slump. Greenblatt's Magic Formula buys a cheap company only when it also earns a high return on the money it uses, to keep out the ones that are cheap for a reason, and his index weighting spreads the money over the whole index. Our portfolio does neither: it holds only the cheapest thirty and asks only how to split the money among them.
The limit is the part a reader can take away. Weighting by how cheap has no brake of its own, so a bank's accounts or one faulty price can hand a single company most of the money. With a limit per company the portfolio keeps the idea and loses the accidents, and it still beat equal weights of the same thirty.
5.2 Limitations
The versions with financial companies left out or with a limit per company were measured on the same engine and data after the first run, and were not locked before they ran; a locked run of them would give them the standing of the first. Our prices are adjusted for spin-offs that came years later, which makes some companies look smaller, and so cheaper, than they were on the day: FMC Technologies in 2010, 2011 and 2017, Manitowoc in 2009 and Western Digital in 2012 and 2013 are among them, and the limit of 15% keeps any one of them from holding more than that. Some statements in our data carry a filing date before, or within days of, the end of the quarter they report, so in 14 of the twenty Januaries, from 2006 to 2020, between one and seven of the thirty were ranked on a quarter that was not yet published, 42 of the 600 picks in all. In our data many companies that later left the index lack statements, a market value or a sector on some dates: of the roughly five hundred members each January, from 356 in 2006 to 498 in 2025 had the figures the ranking needs, and among those up to 34 a year, none from 2021 on, had no market value and were passed over, a choice made with knowledge from after the pick that bears on every comparison with the equal-weight S&P 500, which holds them all; in one January our data gives one of the thirty, Avon, a market value about a million times too small, so weighting by size gave it nothing and the size version held twenty-nine; and 13 departed financial companies with no sector were left out by name. Greenblatt's own value-weighted index spreads its money over the whole index; this test weights only the thirty cheapest.
Try it yourself
Open the study's circuit in the lab and change one card at a time: Portfolio Σ's weighting from By how cheap to Equal weights or By market value (the size version), its Max weight from 0 (no limit) to 0.15, or Factor Select's Top N from 30 to another number.
Computed, not featured
The run produced the results below. The author chose not to feature them in this paper; they were computed all the same, are part of the frozen record, and are reproducible from the study's frozen circuit.
- The measurement ladder, 20 windows. The forward tester, per window: the same walk chained price-only, with dividends and net of costs, against the benchmark measured both ways.
References
- Greenblatt, J. (2006). The Little Book That Beats the Market. John Wiley & Sons.
- Greenblatt, J. (2011). The Big Secret for the Small Investor: A New Route to Long-Term Investment Success. Crown Business.
- Arnott, R. D., Hsu, J., and Moore, P. (2005). Fundamental indexation. Financial Analysts Journal, 61(2), 83-99.
- Loughran, T., and Wellman, J. W. (2011). New evidence on the relation between the enterprise multiple and average stock returns. Journal of Financial and Quantitative Analysis, 46(6), 1629-1650.
- Gray, W. R., and Vogel, J. R. (2012). Analyzing valuation measures: A performance horse race over the past 40 years. The Journal of Portfolio Management, 39(1), 112-121.
- DeMiguel, V., Garlappi, L., and Uppal, R. (2009). Optimal versus naive diversification: How inefficient is the 1/N portfolio strategy? The Review of Financial Studies, 22(5), 1915-1953.
Appendix A Reproducibility in QuanterLab
Each step is backed by a frozen run report. The study is re-derivable from the ledger below.
| # | Commit | Report | Anchor | OOS window |
|---|---|---|---|---|
| 1 | a202b4d487ed | 15325 | 2006-01-01 | 2006-01-03 → 2006-12-29 |
| 2 | d34c7ef46989 | 15327 | 2007-01-01 | 2007-01-03 → 2007-12-31 |
| 3 | 53f94b78b636 | 15329 | 2008-01-01 | 2008-01-02 → 2008-12-31 |
| 4 | f04b057a0042 | 15331 | 2009-01-01 | 2009-01-02 → 2009-12-31 |
| 5 | 061f56adb1b6 | 15333 | 2010-01-01 | 2010-01-04 → 2010-12-31 |
| 6 | 751c422dfef6 | 15335 | 2011-01-01 | 2011-01-03 → 2011-12-30 |
| 7 | 76cb41c12d90 | 15337 | 2012-01-01 | 2012-01-03 → 2012-12-31 |
| 8 | a3f15f302367 | 15338 | 2013-01-01 | 2013-01-02 → 2013-12-31 |
| 9 | 229049f6206f | 15339 | 2014-01-01 | 2014-01-02 → 2014-12-31 |
| 10 | d0d179dcbf9c | 15340 | 2015-01-01 | 2015-01-02 → 2015-12-31 |
| 11 | b39971665489 | 15341 | 2016-01-01 | 2016-01-04 → 2016-12-30 |
| 12 | d9dde18d9bbe | 15342 | 2017-01-01 | 2017-01-03 → 2017-12-29 |
| 13 | 7fd10898b34d | 15343 | 2018-01-01 | 2018-01-02 → 2018-12-31 |
| 14 | 4008bfe8bca9 | 15344 | 2019-01-01 | 2019-01-02 → 2019-12-31 |
| 15 | 086b9c26828b | 15345 | 2020-01-01 | 2020-01-02 → 2020-12-31 |
| 16 | 174dd1a25dd5 | 15346 | 2021-01-01 | 2021-01-04 → 2021-12-31 |
| 17 | beba46fa69ff | 15347 | 2022-01-01 | 2022-01-03 → 2022-12-30 |
| 18 | 9c027f57e0a5 | 15348 | 2023-01-01 | 2023-01-03 → 2023-12-29 |
| 19 | 4a2a5495da41 | 15349 | 2024-01-01 | 2024-01-02 → 2024-12-31 |
| 20 | 689fd4ae5f60 | 15350 | 2025-01-01 | 2025-01-02 → 2025-12-31 |
The methods the platform implements, for every study made on it, rest on these works.
- Gelman, A., & Loken, E. (2013). The garden of forking paths: Why multiple comparisons can be a problem, even when there is no “fishing expedition.” Working paper, Columbia University.
- Harvey, C. R., Liu, Y., & Zhu, H. (2016). … and the Cross-Section of Expected Returns. Review of Financial Studies, 29(1), 5–68. doi:10.1093/rfs/hhv059
- Lo, A. W. (2002). The Statistics of Sharpe Ratios. Financial Analysts Journal, 58(4), 36–52. doi:10.2469/faj.v58.n4.2453
Appendix A2 Registration record
What this record does and does not establish. Every window in this study is historical: the data existed before the study began, so this is sequential registration on past windows, not pre-registration in the clinical-trial sense, and no procedure could make it so. What the platform does enforce is order, each step's specification was frozen and hashed before that step was scored, and the walk cannot advance past a step that was never run or close one with a result registered for a different window. The two timestamp columns below are the evidence: read them together and each registration precedes its own run, and each run precedes the next registration. A study whose registrations all post-date its runs would show it here. Wall-clock spacing between registrations varies with the author's schedule and queue latency; the ordering, not the tempo, is the claim.
“A COMPARATIVE study: Weighted by cheapness vs Equal weights, walked on the same registered out-of-sample windows. Weighted by cheapness: S&P 500, rebalanced none across the selected basket, and run out-of-sample from the anchor: anything the design estimates from history, where it estimates at all, is re-estimated at each anchor from pre-anchor data only, and the walk advances through registered out-of-sample windows; its disposition is the realized forward path versus the benchmark. Equal weights: S&P 500, rebalanced none across the selected basket, and run out-of-sample from the anchor: anything the design estimates from history, where it estimates at all, is re-estimated at each anchor from pre-anchor data only, and the walk advances through registered out-of-sample windows; its disposition is the realized forward path versus the benchmark. The arms differ in: Portfolio Σ, Weighting: By how cheap → Equal weights. The contrast under test: whether Weighted by cheapness generates better risk-adjusted returns than Equal weights over the identical out-of-sample windows.”
The same hypothesis was registered independently at every step, hashed before each step's out-of-sample window was scored:
| # | Anchor | Registered at (UTC) | Run completed (UTC) |
|---|---|---|---|
| 1 | 2006-01-01 | 2026-10-31 00:16:46 | 2026-10-31 00:24:11 |
| 2 | 2007-01-01 | 2026-10-31 00:24:11 | 2026-10-31 00:32:01 |
| 3 | 2008-01-01 | 2026-10-31 00:32:01 | 2026-10-31 00:39:26 |
| 4 | 2009-01-01 | 2026-10-31 00:39:26 | 2026-10-31 00:46:04 |
| 5 | 2010-01-01 | 2026-10-31 00:46:04 | 2026-10-31 00:52:06 |
| 6 | 2011-01-01 | 2026-10-31 00:52:06 | 2026-10-31 00:58:08 |
| 7 | 2012-01-01 | 2026-10-31 00:58:08 | 2026-10-31 01:04:23 |
| 8 | 2013-01-01 | 2026-10-31 01:04:23 | 2026-10-31 01:08:24 |
| 9 | 2014-01-01 | 2026-10-31 01:08:24 | 2026-10-31 01:12:01 |
| 10 | 2015-01-01 | 2026-10-31 01:12:01 | 2026-10-31 01:15:26 |
| 11 | 2016-01-01 | 2026-10-31 01:15:26 | 2026-10-31 01:19:03 |
| 12 | 2017-01-01 | 2026-10-31 01:19:03 | 2026-10-31 01:22:28 |
| 13 | 2018-01-01 | 2026-10-31 01:22:28 | 2026-10-31 01:25:54 |
| 14 | 2019-01-01 | 2026-10-31 01:25:54 | 2026-10-31 01:28:55 |
| 15 | 2020-01-01 | 2026-10-31 01:28:55 | 2026-10-31 01:31:55 |
| 16 | 2021-01-01 | 2026-10-31 01:31:56 | 2026-10-31 01:36:45 |
| 17 | 2022-01-01 | 2026-10-31 01:36:45 | 2026-10-31 01:40:58 |
| 18 | 2023-01-01 | 2026-10-31 01:40:58 | 2026-10-31 01:43:49 |
| 19 | 2024-01-01 | 2026-10-31 01:43:49 | 2026-10-31 01:46:38 |
| 20 | 2025-01-01 | 2026-10-31 01:46:38 | 2026-10-31 01:49:27 |
The companion comparisons
This paper reads 2 more registered studies beside its own. Each one’s registration is printed here from their own record, in the same form as the table above: the hypothesis as it was registered, the day it was first locked, the time each window was registered and run, and what each window returned.
By size, financial companies in
Its hypothesis was first locked on 31 October 2026, before its first window was run that day.
The same hypothesis was registered again, unchanged, at each of its 20 windows:
“A COMPARATIVE study: Weighted by cheapness vs Weighted by company size, walked on the same registered out-of-sample windows. Weighted by cheapness: S&P 500, rebalanced none across the selected basket, and run out-of-sample from the anchor: anything the design estimates from history, where it estimates at all, is re-estimated at each anchor from pre-anchor data only, and the walk advances through registered out-of-sample windows; its disposition is the realized forward path versus the benchmark. Weighted by company size: S&P 500, rebalanced none across the selected basket, and run out-of-sample from the anchor: anything the design estimates from history, where it estimates at all, is re-estimated at each anchor from pre-anchor data only, and the walk advances through registered out-of-sample windows; its disposition is the realized forward path versus the benchmark. The arms differ in: Portfolio Σ, Weighting: By how cheap → By market value. The contrast under test: whether Weighted by cheapness generates better risk-adjusted returns than Weighted by company size over the identical out-of-sample windows.”
| # | Anchor | Registered at (UTC) | Run completed (UTC) |
|---|---|---|---|
| 1 | 2006-01-01 | 2026-10-31 10:37:11 | 2026-10-31 10:43:24 |
| 2 | 2007-01-01 | 2026-10-31 10:43:25 | 2026-10-31 10:48:26 |
| 3 | 2008-01-01 | 2026-10-31 10:48:26 | 2026-10-31 10:53:51 |
| 4 | 2009-01-01 | 2026-10-31 10:53:51 | 2026-10-31 10:58:28 |
| 5 | 2010-01-01 | 2026-10-31 10:58:28 | 2026-10-31 11:02:53 |
| 6 | 2011-01-01 | 2026-10-31 11:02:53 | 2026-10-31 11:06:53 |
| 7 | 2012-01-01 | 2026-10-31 11:06:54 | 2026-10-31 11:24:17 |
| 8 | 2013-01-01 | 2026-10-31 11:24:18 | 2026-10-31 11:28:06 |
| 9 | 2014-01-01 | 2026-10-31 11:28:07 | 2026-10-31 11:31:43 |
| 10 | 2015-01-01 | 2026-10-31 11:31:44 | 2026-10-31 11:35:08 |
| 11 | 2016-01-01 | 2026-10-31 11:35:08 | 2026-10-31 11:38:45 |
| 12 | 2017-01-01 | 2026-10-31 11:38:45 | 2026-10-31 11:42:11 |
| 13 | 2018-01-01 | 2026-10-31 11:42:11 | 2026-10-31 11:45:35 |
| 14 | 2019-01-01 | 2026-10-31 11:45:36 | 2026-10-31 11:48:38 |
| 15 | 2020-01-01 | 2026-10-31 11:48:38 | 2026-10-31 11:51:39 |
| 16 | 2021-01-01 | 2026-10-31 11:51:39 | 2026-10-31 11:55:04 |
| 17 | 2022-01-01 | 2026-10-31 11:55:04 | 2026-10-31 11:58:05 |
| 18 | 2023-01-01 | 2026-10-31 11:58:05 | 2026-10-31 12:01:06 |
| 19 | 2024-01-01 | 2026-10-31 12:01:06 | 2026-10-31 12:03:55 |
| 20 | 2025-01-01 | 2026-10-31 12:03:55 | 2026-10-31 12:06:44 |
| # | Anchor | Weighted by cheapness | Weighted by company size |
|---|---|---|---|
| 1 | 2006-01-01 | +19.2% | +26.2% |
| 2 | 2007-01-01 | +33.2% | +33.8% |
| 3 | 2008-01-01 | -39.8% | -23.4% |
| 4 | 2009-01-01 | +23.2% | +2.4% |
| 5 | 2010-01-01 | +37.7% | +13.3% |
| 6 | 2011-01-01 | +3.4% | -6.6% |
| 7 | 2012-01-01 | +17.0% | +7.3% |
| 8 | 2013-01-01 | +40.9% | +48.0% |
| 9 | 2014-01-01 | +15.1% | +7.5% |
| 10 | 2015-01-01 | -10.5% | -7.2% |
| 11 | 2016-01-01 | +18.8% | +17.2% |
| 12 | 2017-01-01 | -1.6% | +4.3% |
| 13 | 2018-01-01 | -9.7% | -12.9% |
| 14 | 2019-01-01 | +19.0% | +19.5% |
| 15 | 2020-01-01 | -9.7% | -11.0% |
| 16 | 2021-01-01 | +32.0% | +36.1% |
| 17 | 2022-01-01 | -9.5% | +1.7% |
| 18 | 2023-01-01 | +12.7% | +3.8% |
| 19 | 2024-01-01 | +25.5% | +17.4% |
| 20 | 2025-01-01 | +24.6% | +11.1% |
By size, the run stopped in January 2012
Its hypothesis was first locked on 31 October 2026, before its first window was run that day.
The same hypothesis was registered again, unchanged, at each of its 6 windows:
“A COMPARATIVE study: Weighted by cheapness vs Weighted by company size, walked on the same registered out-of-sample windows. Weighted by cheapness: S&P 500, rebalanced none across the selected basket, and run out-of-sample from the anchor: anything the design estimates from history, where it estimates at all, is re-estimated at each anchor from pre-anchor data only, and the walk advances through registered out-of-sample windows; its disposition is the realized forward path versus the benchmark. Weighted by company size: S&P 500, rebalanced none across the selected basket, and run out-of-sample from the anchor: anything the design estimates from history, where it estimates at all, is re-estimated at each anchor from pre-anchor data only, and the walk advances through registered out-of-sample windows; its disposition is the realized forward path versus the benchmark. The arms differ in: Portfolio Σ, Weighting: By how cheap → By market value. The contrast under test: whether Weighted by cheapness generates better risk-adjusted returns than Weighted by company size over the identical out-of-sample windows.”
| # | Anchor | Registered at (UTC) | Run completed (UTC) |
|---|---|---|---|
| 1 | 2006-01-01 | 2026-10-31 00:20:48 | 2026-10-31 00:28:37 |
| 2 | 2007-01-01 | 2026-10-31 00:28:37 | 2026-10-31 00:35:50 |
| 3 | 2008-01-01 | 2026-10-31 00:35:50 | 2026-10-31 00:42:16 |
| 4 | 2009-01-01 | 2026-10-31 00:42:16 | 2026-10-31 00:48:17 |
| 5 | 2010-01-01 | 2026-10-31 00:48:17 | 2026-10-31 00:54:07 |
| 6 | 2011-01-01 | 2026-10-31 00:54:07 | 2026-10-31 00:59:45 |
| # | Anchor | Weighted by cheapness | Weighted by company size |
|---|---|---|---|
| 1 | 2006-01-01 | +19.2% | +26.2% |
| 2 | 2007-01-01 | +33.2% | +33.8% |
| 3 | 2008-01-01 | -39.8% | -23.4% |
| 4 | 2009-01-01 | +23.2% | +2.4% |
| 5 | 2010-01-01 | +37.7% | +13.3% |
| 6 | 2011-01-01 | +3.4% | -6.6% |
Appendix B Per-step diagnostics
Realized in the projection tables below is the risk engine scoring its own forecast: the buy-and-hold return of the segment that followed each rebalance, on the same gross basis the cone was projected on. It is deliberately not the charged, calendar-window total return the study’s tables print, so the two will not reconcile line by line; the cone and its outcome share one basis, which is what a calibration test requires. Each row names its segment’s span so a boundary session is visible.
Names held is the union across the window: the count of distinct instruments the book touched between the window’s first and last session, not the number it held at one time. A book that rotates monthly touches more names than it holds.
What each step's run actually did beyond its return: the portfolio book's rebalancing and cost drag. Harvested from the frozen run reports, present where the circuit produced them. Cost drag is the gap between the step's return before and after its trading costs, in percentage points of the step's starting capital, so on a book that trades every session and compounds it can exceed the step's own net return.
Open the full per-step grid (20 steps: every rebalance, per window)
Step 1 · 2006-01-03 → 2006-12-29
Weighted by cheapness
Portfolio book, rebalanced none · 1 constructions · 30 names held · selection: reselect · 0.4% in cash · turnover 1.0× · cost drag 0.1%
Projection accuracy, realized outcome fell inside the P5–P95 cone in 100.0% of 1 scored rebalances (a well-calibrated 90% band contains ~90.0%) · 95% VaR breached on 4.4% of 250 days (expected ~5.0%)
| Rebalance | P5 | Median | P95 | Realized | In band | VaR 95 (1d) | Breaches |
|---|---|---|---|---|---|---|---|
| 2006-01-01 → window end | -4.9385% | 22.2632% | 57.9579% | 19.7376% | yes | 1.7383% | 11 / 250 |
Equal weights
Portfolio book, rebalanced none · 1 constructions · 30 names held · selection: reselect · 0.4% in cash · turnover 1.0× · cost drag 0.1%
Projection accuracy, realized outcome fell inside the P5–P95 cone in 100.0% of 1 scored rebalances (a well-calibrated 90% band contains ~90.0%) · 95% VaR breached on 3.6% of 250 days (expected ~5.0%)
| Rebalance | P5 | Median | P95 | Realized | In band | VaR 95 (1d) | Breaches |
|---|---|---|---|---|---|---|---|
| 2006-01-01 → window end | -5.3549% | 21.9601% | 57.8726% | 19.7402% | yes | 1.7951% | 9 / 250 |
Step 2 · 2007-01-03 → 2007-12-31
Weighted by cheapness
Portfolio book, rebalanced none · 1 constructions · 30 names held · selection: reselect · 0.4% in cash · turnover 1.0× · cost drag 0.1%
Projection accuracy, realized outcome fell inside the P5–P95 cone in 100.0% of 1 scored rebalances (a well-calibrated 90% band contains ~90.0%) · 95% VaR breached on 10.4% of 250 days (expected ~5.0%)
| Rebalance | P5 | Median | P95 | Realized | In band | VaR 95 (1d) | Breaches |
|---|---|---|---|---|---|---|---|
| 2007-01-01 → window end | -1.6553% | 26.2189% | 62.7182% | 29.1744% | yes | 1.6389% | 26 / 250 |
Equal weights
Portfolio book, rebalanced none · 1 constructions · 30 names held · selection: reselect · 0.4% in cash · turnover 1.0× · cost drag 0.1%
Projection accuracy, realized outcome fell inside the P5–P95 cone in 100.0% of 1 scored rebalances (a well-calibrated 90% band contains ~90.0%) · 95% VaR breached on 9.2% of 250 days (expected ~5.0%)
| Rebalance | P5 | Median | P95 | Realized | In band | VaR 95 (1d) | Breaches |
|---|---|---|---|---|---|---|---|
| 2007-01-01 → window end | -1.6491% | 25.8569% | 61.7675% | 28.8505% | yes | 1.6557% | 23 / 250 |
Step 3 · 2008-01-02 → 2008-12-31
Weighted by cheapness
Portfolio book, rebalanced none · 1 constructions · 30 names held · selection: reselect · 0.4% in cash · turnover 1.0× · cost drag 0.1%
Projection accuracy, realized outcome fell inside the P5–P95 cone in 0.0% of 1 scored rebalances (a well-calibrated 90% band contains ~90.0%) · 95% VaR breached on 20.63% of 252 days (expected ~5.0%)
| Rebalance | P5 | Median | P95 | Realized | In band | VaR 95 (1d) | Breaches |
|---|---|---|---|---|---|---|---|
| 2008-01-01 → window end | -10.921% | 14.5764% | 45.3776% | -40.7905% | no | 1.6489% | 52 / 252 |
Equal weights
Portfolio book, rebalanced none · 1 constructions · 30 names held · selection: reselect · 0.4% in cash · turnover 1.0× · cost drag 0.1%
Projection accuracy, realized outcome fell inside the P5–P95 cone in 0.0% of 1 scored rebalances (a well-calibrated 90% band contains ~90.0%) · 95% VaR breached on 22.62% of 252 days (expected ~5.0%)
| Rebalance | P5 | Median | P95 | Realized | In band | VaR 95 (1d) | Breaches |
|---|---|---|---|---|---|---|---|
| 2008-01-01 → window end | -10.9046% | 14.5452% | 45.2753% | -41.5324% | no | 1.593% | 57 / 252 |
Step 4 · 2009-01-02 → 2009-12-31
Weighted by cheapness
Portfolio book, rebalanced none · 1 constructions · 30 names held · selection: reselect · 0.4% in cash · turnover 1.0× · cost drag 0.1%
Projection accuracy, realized outcome fell inside the P5–P95 cone in 100.0% of 1 scored rebalances (a well-calibrated 90% band contains ~90.0%) · 95% VaR breached on 7.97% of 251 days (expected ~5.0%)
| Rebalance | P5 | Median | P95 | Realized | In band | VaR 95 (1d) | Breaches |
|---|---|---|---|---|---|---|---|
| 2009-01-01 → window end | -55.0268% | -14.733% | 63.2407% | 28.6882% | yes | 3.8053% | 20 / 251 |
Equal weights
Portfolio book, rebalanced none · 1 constructions · 30 names held · selection: reselect · 0.4% in cash · turnover 1.0× · cost drag 0.1%
Projection accuracy, realized outcome fell inside the P5–P95 cone in 100.0% of 1 scored rebalances (a well-calibrated 90% band contains ~90.0%) · 95% VaR breached on 7.17% of 251 days (expected ~5.0%)
| Rebalance | P5 | Median | P95 | Realized | In band | VaR 95 (1d) | Breaches |
|---|---|---|---|---|---|---|---|
| 2009-01-01 → window end | -52.4702% | -11.9838% | 64.522% | 29.1173% | yes | 3.5822% | 18 / 251 |
Step 5 · 2010-01-04 → 2010-12-31
Weighted by cheapness
Portfolio book, rebalanced none · 1 constructions · 30 names held · selection: reselect · 0.4% in cash · turnover 1.0× · cost drag 0.1%
Projection accuracy, realized outcome fell inside the P5–P95 cone in 100.0% of 1 scored rebalances (a well-calibrated 90% band contains ~90.0%) · 95% VaR breached on 0.8% of 251 days (expected ~5.0%)
| Rebalance | P5 | Median | P95 | Realized | In band | VaR 95 (1d) | Breaches |
|---|---|---|---|---|---|---|---|
| 2010-01-01 → window end | -60.1344% | -0.0016% | 154.3627% | 39.553% | yes | 5.6957% | 2 / 251 |
Equal weights
Portfolio book, rebalanced none · 1 constructions · 30 names held · selection: reselect · 0.4% in cash · turnover 1.0× · cost drag 0.1%
Projection accuracy, realized outcome fell inside the P5–P95 cone in 100.0% of 1 scored rebalances (a well-calibrated 90% band contains ~90.0%) · 95% VaR breached on 0.4% of 251 days (expected ~5.0%)
| Rebalance | P5 | Median | P95 | Realized | In band | VaR 95 (1d) | Breaches |
|---|---|---|---|---|---|---|---|
| 2010-01-01 → window end | -50.1541% | -4.8632% | 83.3711% | 14.2036% | yes | 4.071% | 1 / 251 |
Step 6 · 2011-01-03 → 2011-12-30
Weighted by cheapness
Portfolio book, rebalanced none · 1 constructions · 30 names held · selection: reselect · 0.4% in cash · turnover 1.0× · cost drag 0.1%
Projection accuracy, realized outcome fell inside the P5–P95 cone in 100.0% of 1 scored rebalances (a well-calibrated 90% band contains ~90.0%) · 95% VaR breached on 2.79% of 251 days (expected ~5.0%)
| Rebalance | P5 | Median | P95 | Realized | In band | VaR 95 (1d) | Breaches |
|---|---|---|---|---|---|---|---|
| 2011-01-01 → window end | -28.2446% | 35.9825% | 160.2125% | 0.4572% | yes | 3.7943% | 7 / 251 |
Equal weights
Portfolio book, rebalanced none · 1 constructions · 30 names held · selection: reselect · 0.4% in cash · turnover 1.0× · cost drag 0.1%
Projection accuracy, realized outcome fell inside the P5–P95 cone in 100.0% of 1 scored rebalances (a well-calibrated 90% band contains ~90.0%) · 95% VaR breached on 3.19% of 251 days (expected ~5.0%)
| Rebalance | P5 | Median | P95 | Realized | In band | VaR 95 (1d) | Breaches |
|---|---|---|---|---|---|---|---|
| 2011-01-01 → window end | -27.6815% | 29.7834% | 134.9885% | -6.2215% | yes | 3.6531% | 8 / 251 |
Step 7 · 2012-01-03 → 2012-12-31
Weighted by cheapness
Portfolio book, rebalanced none · 1 constructions · 30 names held · selection: reselect · 0.4% in cash · turnover 1.0× · cost drag 0.1%
Projection accuracy, realized outcome fell inside the P5–P95 cone in 100.0% of 1 scored rebalances (a well-calibrated 90% band contains ~90.0%) · 95% VaR breached on 1.2% of 249 days (expected ~5.0%)
| Rebalance | P5 | Median | P95 | Realized | In band | VaR 95 (1d) | Breaches |
|---|---|---|---|---|---|---|---|
| 2012-01-01 → window end | -31.6507% | 9.767% | 72.4342% | 13.767% | yes | 3.0053% | 3 / 249 |
Equal weights
Portfolio book, rebalanced none · 1 constructions · 30 names held · selection: reselect · 0.4% in cash · turnover 1.0× · cost drag 0.1%
Projection accuracy, realized outcome fell inside the P5–P95 cone in 100.0% of 1 scored rebalances (a well-calibrated 90% band contains ~90.0%) · 95% VaR breached on 1.2% of 249 days (expected ~5.0%)
| Rebalance | P5 | Median | P95 | Realized | In band | VaR 95 (1d) | Breaches |
|---|---|---|---|---|---|---|---|
| 2012-01-01 → window end | -30.4437% | 11.0523% | 73.4808% | 9.1449% | yes | 3.2578% | 3 / 249 |
Step 8 · 2013-01-02 → 2013-12-31
Weighted by cheapness
Portfolio book, rebalanced none · 1 constructions · 30 names held · selection: reselect · 0.4% in cash · turnover 1.0× · cost drag 0.1%
Projection accuracy, realized outcome fell inside the P5–P95 cone in 100.0% of 1 scored rebalances (a well-calibrated 90% band contains ~90.0%) · 95% VaR breached on 0.8% of 251 days (expected ~5.0%)
| Rebalance | P5 | Median | P95 | Realized | In band | VaR 95 (1d) | Breaches |
|---|---|---|---|---|---|---|---|
| 2013-01-01 → window end | -42.6365% | 1.4606% | 81.0179% | 40.2454% | yes | 3.2271% | 2 / 251 |
Equal weights
Portfolio book, rebalanced none · 1 constructions · 30 names held · selection: reselect · 0.4% in cash · turnover 1.0× · cost drag 0.1%
Projection accuracy, realized outcome fell inside the P5–P95 cone in 100.0% of 1 scored rebalances (a well-calibrated 90% band contains ~90.0%) · 95% VaR breached on 1.59% of 251 days (expected ~5.0%)
| Rebalance | P5 | Median | P95 | Realized | In band | VaR 95 (1d) | Breaches |
|---|---|---|---|---|---|---|---|
| 2013-01-01 → window end | -31.2351% | 3.2156% | 55.8846% | 55.3993% | yes | 2.4612% | 4 / 251 |
Step 9 · 2014-01-02 → 2014-12-31
Weighted by cheapness
Portfolio book, rebalanced none · 1 constructions · 30 names held · selection: reselect · 0.4% in cash · turnover 1.0× · cost drag 0.1%
Projection accuracy, realized outcome fell inside the P5–P95 cone in 100.0% of 1 scored rebalances (a well-calibrated 90% band contains ~90.0%) · 95% VaR breached on 5.18% of 251 days (expected ~5.0%)
| Rebalance | P5 | Median | P95 | Realized | In band | VaR 95 (1d) | Breaches |
|---|---|---|---|---|---|---|---|
| 2014-01-01 → window end | -5.8149% | 22.8732% | 60.9483% | 10.4183% | yes | 1.6417% | 13 / 251 |
Equal weights
Portfolio book, rebalanced none · 1 constructions · 30 names held · selection: reselect · 0.4% in cash · turnover 1.0× · cost drag 0.1%
Projection accuracy, realized outcome fell inside the P5–P95 cone in 100.0% of 1 scored rebalances (a well-calibrated 90% band contains ~90.0%) · 95% VaR breached on 5.18% of 251 days (expected ~5.0%)
| Rebalance | P5 | Median | P95 | Realized | In band | VaR 95 (1d) | Breaches |
|---|---|---|---|---|---|---|---|
| 2014-01-01 → window end | -6.4567% | 21.1123% | 57.4229% | 9.613% | yes | 1.6036% | 13 / 251 |
Step 10 · 2015-01-02 → 2015-12-31
Weighted by cheapness
Portfolio book, rebalanced none · 1 constructions · 30 names held · selection: reselect · 0.4% in cash · turnover 1.0× · cost drag 0.1%
Projection accuracy, realized outcome fell inside the P5–P95 cone in 0.0% of 1 scored rebalances (a well-calibrated 90% band contains ~90.0%) · 95% VaR breached on 10.76% of 251 days (expected ~5.0%)
| Rebalance | P5 | Median | P95 | Realized | In band | VaR 95 (1d) | Breaches |
|---|---|---|---|---|---|---|---|
| 2015-01-01 → window end | -1.6448% | 24.2059% | 57.408% | -18.1474% | no | 1.4403% | 27 / 251 |
Equal weights
Portfolio book, rebalanced none · 1 constructions · 30 names held · selection: reselect · 0.4% in cash · turnover 1.0× · cost drag 0.1%
Projection accuracy, realized outcome fell inside the P5–P95 cone in 0.0% of 1 scored rebalances (a well-calibrated 90% band contains ~90.0%) · 95% VaR breached on 10.76% of 251 days (expected ~5.0%)
| Rebalance | P5 | Median | P95 | Realized | In band | VaR 95 (1d) | Breaches |
|---|---|---|---|---|---|---|---|
| 2015-01-01 → window end | -2.2848% | 23.2% | 55.8793% | -17.7247% | no | 1.4579% | 27 / 251 |
Step 11 · 2016-01-04 → 2016-12-30
Weighted by cheapness
Portfolio book, rebalanced none · 1 constructions · 30 names held · selection: reselect · 0.4% in cash · turnover 1.0× · cost drag 0.1%
Projection accuracy, realized outcome fell inside the P5–P95 cone in 100.0% of 1 scored rebalances (a well-calibrated 90% band contains ~90.0%) · 95% VaR breached on 7.57% of 251 days (expected ~5.0%)
| Rebalance | P5 | Median | P95 | Realized | In band | VaR 95 (1d) | Breaches |
|---|---|---|---|---|---|---|---|
| 2016-01-01 → window end | -24.4394% | 0.6342% | 34.6129% | 17.723% | yes | 1.8194% | 19 / 251 |
Equal weights
Portfolio book, rebalanced none · 1 constructions · 30 names held · selection: reselect · 0.4% in cash · turnover 1.0× · cost drag 0.1%
Projection accuracy, realized outcome fell inside the P5–P95 cone in 100.0% of 1 scored rebalances (a well-calibrated 90% band contains ~90.0%) · 95% VaR breached on 7.57% of 251 days (expected ~5.0%)
| Rebalance | P5 | Median | P95 | Realized | In band | VaR 95 (1d) | Breaches |
|---|---|---|---|---|---|---|---|
| 2016-01-01 → window end | -24.8226% | -0.8799% | 31.2381% | 21.2134% | yes | 1.8403% | 19 / 251 |
Step 12 · 2017-01-03 → 2017-12-29
Weighted by cheapness
Portfolio book, rebalanced none · 1 constructions · 30 names held · selection: reselect · 0.4% in cash · turnover 1.0× · cost drag 0.1%
Projection accuracy, realized outcome fell inside the P5–P95 cone in 100.0% of 1 scored rebalances (a well-calibrated 90% band contains ~90.0%) · 95% VaR breached on 0.0% of 250 days (expected ~5.0%)
| Rebalance | P5 | Median | P95 | Realized | In band | VaR 95 (1d) | Breaches |
|---|---|---|---|---|---|---|---|
| 2017-01-01 → window end | -30.2835% | -3.5174% | 34.3031% | -1.8909% | yes | 2.122% | 0 / 250 |
Equal weights
Portfolio book, rebalanced none · 1 constructions · 30 names held · selection: reselect · 0.4% in cash · turnover 1.0× · cost drag 0.1%
Projection accuracy, realized outcome fell inside the P5–P95 cone in 100.0% of 1 scored rebalances (a well-calibrated 90% band contains ~90.0%) · 95% VaR breached on 0.0% of 250 days (expected ~5.0%)
| Rebalance | P5 | Median | P95 | Realized | In band | VaR 95 (1d) | Breaches |
|---|---|---|---|---|---|---|---|
| 2017-01-01 → window end | -27.3304% | -1.7669% | 33.5069% | 1.2018% | yes | 1.9346% | 0 / 250 |
Step 13 · 2018-01-02 → 2018-12-31
Weighted by cheapness
Portfolio book, rebalanced none · 1 constructions · 30 names held · selection: reselect · 0.4% in cash · turnover 1.0× · cost drag 0.1%
Projection accuracy, realized outcome fell inside the P5–P95 cone in 100.0% of 1 scored rebalances (a well-calibrated 90% band contains ~90.0%) · 95% VaR breached on 6.8% of 250 days (expected ~5.0%)
| Rebalance | P5 | Median | P95 | Realized | In band | VaR 95 (1d) | Breaches |
|---|---|---|---|---|---|---|---|
| 2018-01-01 → window end | -18.0555% | 6.0816% | 37.9638% | -10.7297% | yes | 1.7674% | 17 / 250 |
Equal weights
Portfolio book, rebalanced none · 1 constructions · 30 names held · selection: reselect · 0.4% in cash · turnover 1.0× · cost drag 0.1%
Projection accuracy, realized outcome fell inside the P5–P95 cone in 100.0% of 1 scored rebalances (a well-calibrated 90% band contains ~90.0%) · 95% VaR breached on 7.2% of 250 days (expected ~5.0%)
| Rebalance | P5 | Median | P95 | Realized | In band | VaR 95 (1d) | Breaches |
|---|---|---|---|---|---|---|---|
| 2018-01-01 → window end | -15.8138% | 7.6203% | 38.1829% | -11.9119% | yes | 1.6409% | 18 / 250 |
Step 14 · 2019-01-02 → 2019-12-31
Weighted by cheapness
Portfolio book, rebalanced none · 1 constructions · 30 names held · selection: reselect · 0.4% in cash · turnover 1.0× · cost drag 0.1%
Projection accuracy, realized outcome fell inside the P5–P95 cone in 100.0% of 1 scored rebalances (a well-calibrated 90% band contains ~90.0%) · 95% VaR breached on 5.58% of 251 days (expected ~5.0%)
| Rebalance | P5 | Median | P95 | Realized | In band | VaR 95 (1d) | Breaches |
|---|---|---|---|---|---|---|---|
| 2019-01-01 → window end | -18.6574% | 4.2397% | 34.0863% | 14.1549% | yes | 1.5835% | 14 / 251 |
Equal weights
Portfolio book, rebalanced none · 1 constructions · 30 names held · selection: reselect · 0.4% in cash · turnover 1.0× · cost drag 0.1%
Projection accuracy, realized outcome fell inside the P5–P95 cone in 100.0% of 1 scored rebalances (a well-calibrated 90% band contains ~90.0%) · 95% VaR breached on 5.18% of 251 days (expected ~5.0%)
| Rebalance | P5 | Median | P95 | Realized | In band | VaR 95 (1d) | Breaches |
|---|---|---|---|---|---|---|---|
| 2019-01-01 → window end | -18.2415% | 3.4838% | 31.4519% | 12.4961% | yes | 1.4957% | 13 / 251 |
Step 15 · 2020-01-02 → 2020-12-31
Weighted by cheapness
Portfolio book, rebalanced none · 1 constructions · 30 names held · selection: reselect · 0.4% in cash · turnover 1.0× · cost drag 0.1%
Projection accuracy, realized outcome fell inside the P5–P95 cone in 100.0% of 1 scored rebalances (a well-calibrated 90% band contains ~90.0%) · 95% VaR breached on 18.65% of 252 days (expected ~5.0%)
| Rebalance | P5 | Median | P95 | Realized | In band | VaR 95 (1d) | Breaches |
|---|---|---|---|---|---|---|---|
| 2020-01-01 → window end | -23.0361% | 5.6328% | 42.5173% | -8.8912% | yes | 2.0435% | 47 / 252 |
Equal weights
Portfolio book, rebalanced none · 1 constructions · 30 names held · selection: reselect · 0.4% in cash · turnover 1.0× · cost drag 0.1%
Projection accuracy, realized outcome fell inside the P5–P95 cone in 100.0% of 1 scored rebalances (a well-calibrated 90% band contains ~90.0%) · 95% VaR breached on 20.63% of 252 days (expected ~5.0%)
| Rebalance | P5 | Median | P95 | Realized | In band | VaR 95 (1d) | Breaches |
|---|---|---|---|---|---|---|---|
| 2020-01-01 → window end | -24.3134% | 3.8698% | 40.1259% | -10.7975% | yes | 2.0057% | 52 / 252 |
Step 16 · 2021-01-04 → 2021-12-31
Weighted by cheapness
Portfolio book, rebalanced none · 1 constructions · 30 names held · selection: reselect · 0.4% in cash · turnover 1.0× · cost drag 0.1%
Projection accuracy, realized outcome fell inside the P5–P95 cone in 100.0% of 1 scored rebalances (a well-calibrated 90% band contains ~90.0%) · 95% VaR breached on 0.0% of 251 days (expected ~5.0%)
| Rebalance | P5 | Median | P95 | Realized | In band | VaR 95 (1d) | Breaches |
|---|---|---|---|---|---|---|---|
| 2021-01-01 → window end | -44.8282% | 5.0115% | 101.8373% | 35.2386% | yes | 3.6884% | 0 / 251 |
Equal weights
Portfolio book, rebalanced none · 1 constructions · 30 names held · selection: reselect · 0.4% in cash · turnover 1.0× · cost drag 0.1%
Projection accuracy, realized outcome fell inside the P5–P95 cone in 100.0% of 1 scored rebalances (a well-calibrated 90% band contains ~90.0%) · 95% VaR breached on 0.0% of 251 days (expected ~5.0%)
| Rebalance | P5 | Median | P95 | Realized | In band | VaR 95 (1d) | Breaches |
|---|---|---|---|---|---|---|---|
| 2021-01-01 → window end | -44.3103% | 3.867% | 95.5655% | 34.9633% | yes | 3.5755% | 0 / 251 |
Step 17 · 2022-01-03 → 2022-12-30
Weighted by cheapness
Portfolio book, rebalanced none · 1 constructions · 30 names held · selection: reselect · 0.4% in cash · turnover 1.0× · cost drag 0.1%
Projection accuracy, realized outcome fell inside the P5–P95 cone in 100.0% of 1 scored rebalances (a well-calibrated 90% band contains ~90.0%) · 95% VaR breached on 2.4% of 250 days (expected ~5.0%)
| Rebalance | P5 | Median | P95 | Realized | In band | VaR 95 (1d) | Breaches |
|---|---|---|---|---|---|---|---|
| 2022-01-01 → window end | -32.5744% | 21.2241% | 120.2464% | -10.9427% | yes | 3.0893% | 6 / 250 |
Equal weights
Portfolio book, rebalanced none · 1 constructions · 30 names held · selection: reselect · 0.4% in cash · turnover 1.0× · cost drag 0.1%
Projection accuracy, realized outcome fell inside the P5–P95 cone in 100.0% of 1 scored rebalances (a well-calibrated 90% band contains ~90.0%) · 95% VaR breached on 2.4% of 250 days (expected ~5.0%)
| Rebalance | P5 | Median | P95 | Realized | In band | VaR 95 (1d) | Breaches |
|---|---|---|---|---|---|---|---|
| 2022-01-01 → window end | -35.7518% | 21.2181% | 131.3155% | -8.2706% | yes | 3.3856% | 6 / 250 |
Step 18 · 2023-01-03 → 2023-12-29
Weighted by cheapness
Portfolio book, rebalanced none · 1 constructions · 30 names held · selection: reselect · 0.4% in cash · turnover 1.0× · cost drag 0.1%
Projection accuracy, realized outcome fell inside the P5–P95 cone in 100.0% of 1 scored rebalances (a well-calibrated 90% band contains ~90.0%) · 95% VaR breached on 1.61% of 249 days (expected ~5.0%)
| Rebalance | P5 | Median | P95 | Realized | In band | VaR 95 (1d) | Breaches |
|---|---|---|---|---|---|---|---|
| 2023-01-01 → window end | -7.6502% | 52.0294% | 144.5301% | 11.9932% | yes | 2.9435% | 4 / 249 |
Equal weights
Portfolio book, rebalanced none · 1 constructions · 30 names held · selection: reselect · 0.4% in cash · turnover 1.0× · cost drag 0.1%
Projection accuracy, realized outcome fell inside the P5–P95 cone in 100.0% of 1 scored rebalances (a well-calibrated 90% band contains ~90.0%) · 95% VaR breached on 1.61% of 249 days (expected ~5.0%)
| Rebalance | P5 | Median | P95 | Realized | In band | VaR 95 (1d) | Breaches |
|---|---|---|---|---|---|---|---|
| 2023-01-01 → window end | -7.9281% | 50.8759% | 141.6123% | 12.1309% | yes | 2.8424% | 4 / 249 |
Step 19 · 2024-01-02 → 2024-12-31
Weighted by cheapness
Portfolio book, rebalanced none · 1 constructions · 30 names held · selection: reselect · 0.4% in cash · turnover 1.0× · cost drag 0.1%
Projection accuracy, realized outcome fell inside the P5–P95 cone in 100.0% of 1 scored rebalances (a well-calibrated 90% band contains ~90.0%) · 95% VaR breached on 1.59% of 251 days (expected ~5.0%)
| Rebalance | P5 | Median | P95 | Realized | In band | VaR 95 (1d) | Breaches |
|---|---|---|---|---|---|---|---|
| 2024-01-01 → window end | -29.8745% | 7.182% | 64.8795% | 20.6549% | yes | 2.6785% | 4 / 251 |
Equal weights
Portfolio book, rebalanced none · 1 constructions · 30 names held · selection: reselect · 0.4% in cash · turnover 1.0× · cost drag 0.1%
Projection accuracy, realized outcome fell inside the P5–P95 cone in 100.0% of 1 scored rebalances (a well-calibrated 90% band contains ~90.0%) · 95% VaR breached on 1.59% of 251 days (expected ~5.0%)
| Rebalance | P5 | Median | P95 | Realized | In band | VaR 95 (1d) | Breaches |
|---|---|---|---|---|---|---|---|
| 2024-01-01 → window end | -28.3863% | 9.4143% | 68.2474% | 19.0901% | yes | 2.5992% | 4 / 251 |
Step 20 · 2025-01-02 → 2025-12-31
Weighted by cheapness
Portfolio book, rebalanced none · 1 constructions · 30 names held · selection: reselect · 0.4% in cash · turnover 1.0× · cost drag 0.1%
Projection accuracy, realized outcome fell inside the P5–P95 cone in 100.0% of 1 scored rebalances (a well-calibrated 90% band contains ~90.0%) · 95% VaR breached on 7.23% of 249 days (expected ~5.0%)
| Rebalance | P5 | Median | P95 | Realized | In band | VaR 95 (1d) | Breaches |
|---|---|---|---|---|---|---|---|
| 2025-01-01 → window end | -13.7116% | 17.6659% | 58.1515% | 23.867% | yes | 1.8536% | 18 / 249 |
Equal weights
Portfolio book, rebalanced none · 1 constructions · 30 names held · selection: reselect · 0.4% in cash · turnover 1.0× · cost drag 0.1%
Projection accuracy, realized outcome fell inside the P5–P95 cone in 100.0% of 1 scored rebalances (a well-calibrated 90% band contains ~90.0%) · 95% VaR breached on 7.23% of 249 days (expected ~5.0%)
| Rebalance | P5 | Median | P95 | Realized | In band | VaR 95 (1d) | Breaches |
|---|---|---|---|---|---|---|---|
| 2025-01-01 → window end | -14.2301% | 15.7309% | 53.9932% | 18.672% | yes | 1.7932% | 18 / 249 |