

The Crash Switch Worked and the Strategy Starved Anyway: Keller's Menu Tested
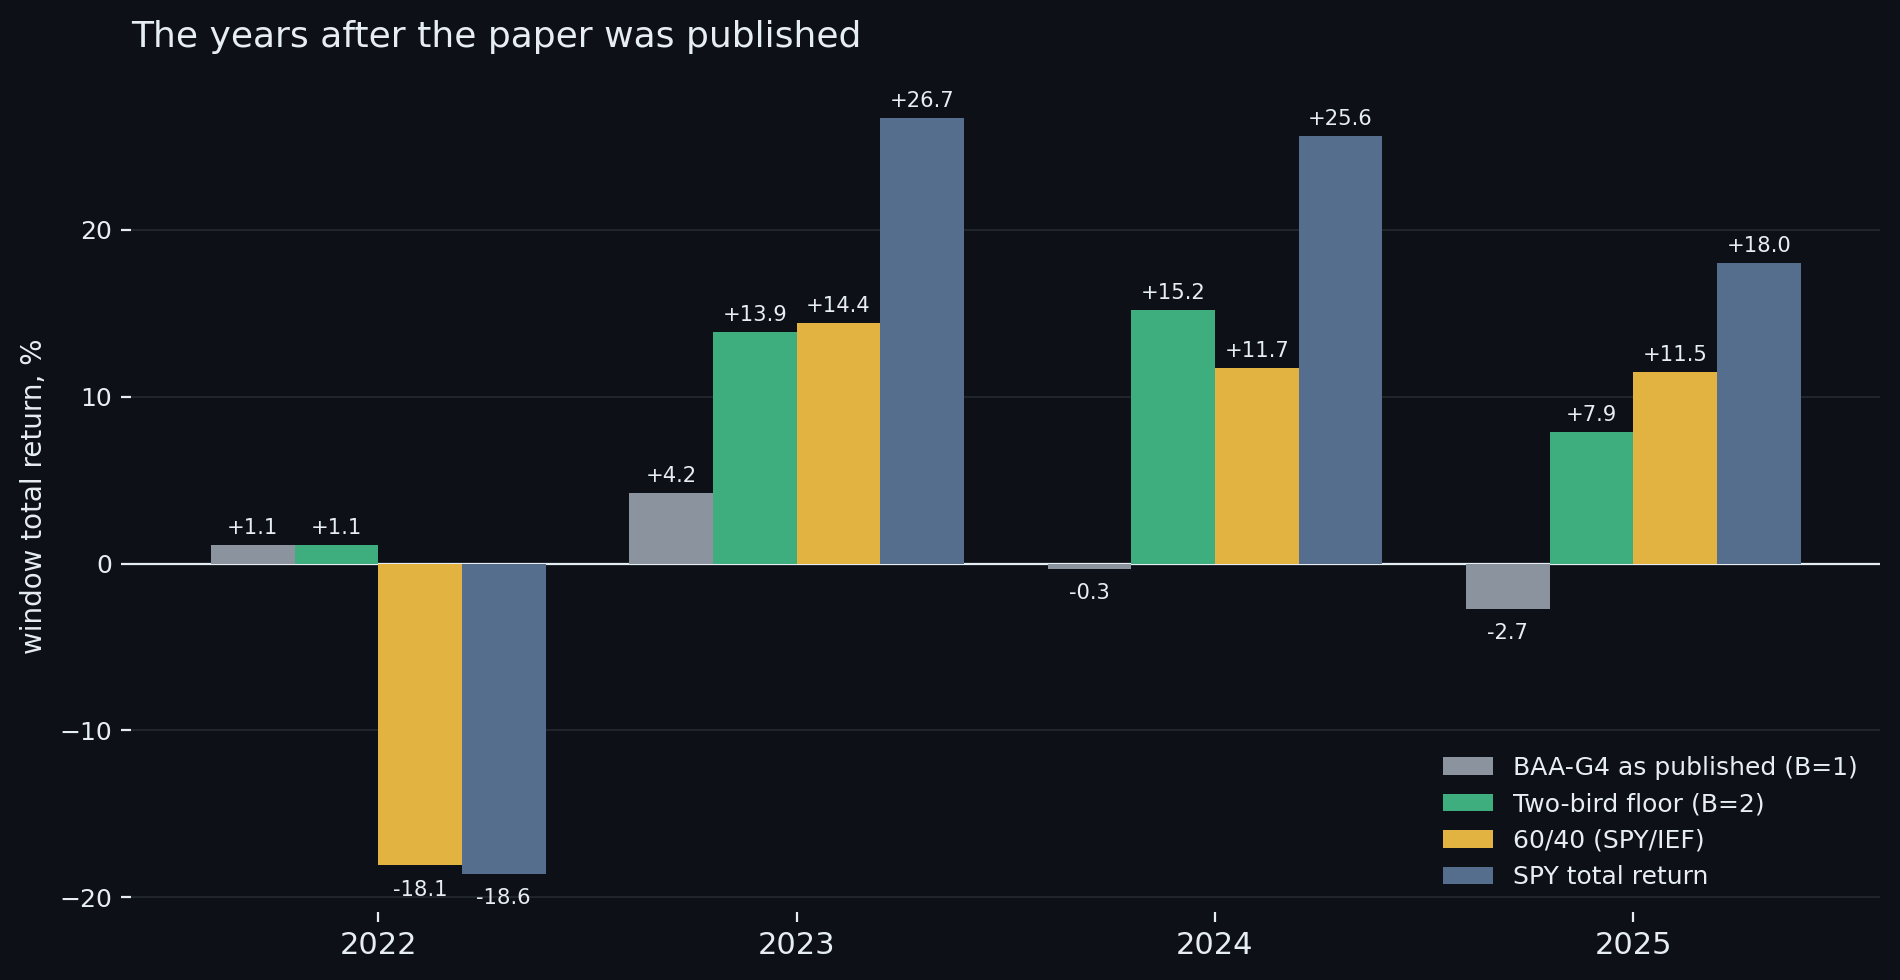
In July 2022 Wouter Keller published Bold Asset Allocation. This paper walks the aggressive variant, BAA-G4: hold the single strongest of QQQ, VWO, VEA and BND by relative momentum, or retreat into bonds and bills when a canary basket says so. We ran the published rules on the real tradable funds through seventeen registered one-year windows, 2009 through 2025. The crash switch is real: in 2022 it turned what would have been minus 31.9 percent without it into plus 1.1. Then the book went quiet, about zero a year across the three years since publication.
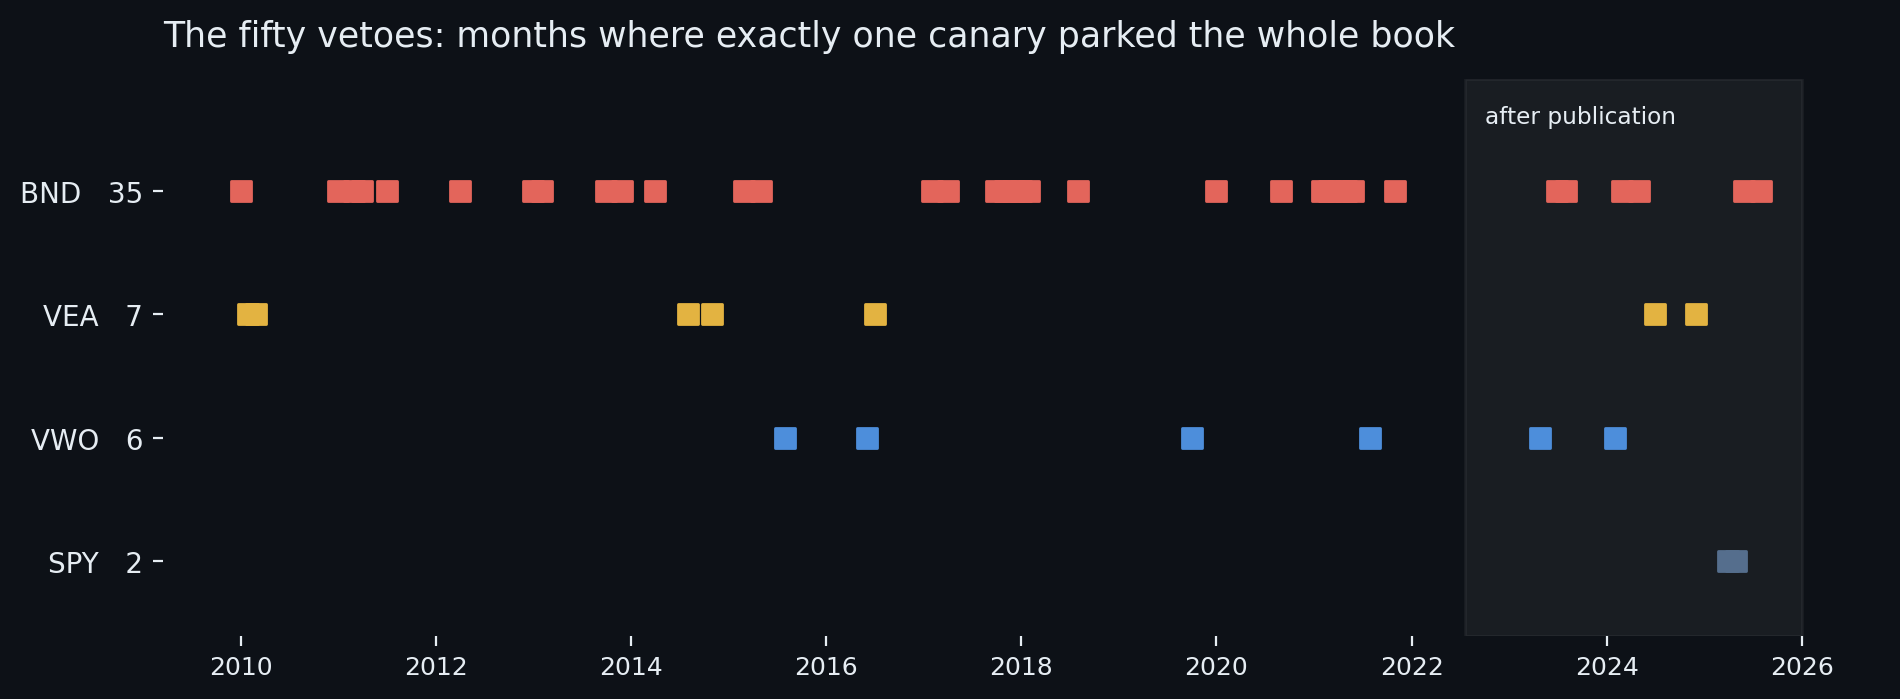
The record names the mechanism. The published gate sat defensive in 132 of the 204 month-end signals, 65 percent of the walk. Fifty of those months were vetoes: exactly one canary read non-positive and that single objection parked the entire book. The objector was the bond fund BND in 35 of the 50, an international fund in another 13, and the US market itself in just 2. A rule sold as an equity crash detector spent most of its objections listening to rates and currency, and after publication that became a permanent false alarm. The author reached the same verdict by his own route: seven months later he published Hybrid Asset Allocation, whose title begins with rising yields and whose gate replaced this canary outright.
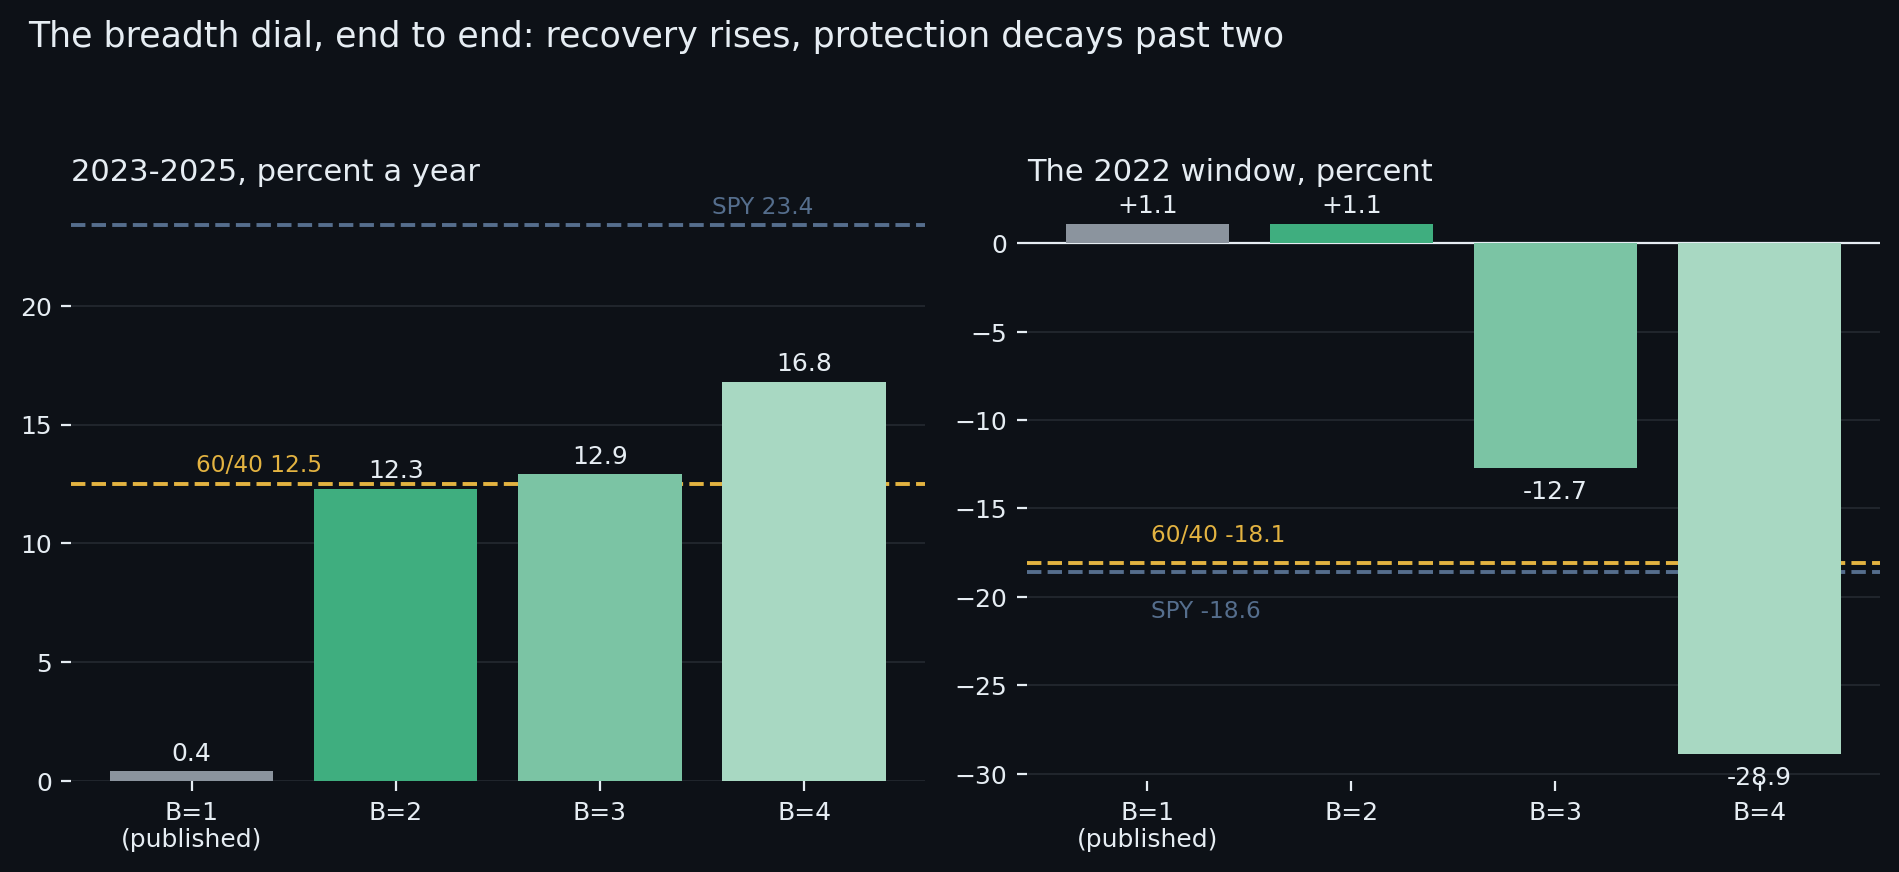
The repair is one notch on the author's own dial, and the dial is now registered end to end. The breadth threshold B comes from Keller's earlier papers; Bold Asset Allocation sets it to one. Two registered walks cover every setting. Participation in the recovery rises with B, 0.4, 12.3, 12.9 and 16.8 percent a year across 2023-2025, while crash protection decays past two: the 2022 save reads plus 1.1, plus 1.1, minus 12.7, minus 28.9 down the dial. The halves cross at two, the only setting that keeps the saves and shows up for the recovery, worth 3.6 points a year against the published gate. Two further walks finish the map: restoring Keller's own graded response buys back nearly the whole covid save the floor concedes, and re-scoring the canaries as excess momentum over Treasury bills changes almost nothing, so the flaw is the veto rather than the yardstick.
Benchmarks, stated plainly. This study's benchmark is the 60/40, SPY/IEF rebalanced monthly, the composition Keller's own paper measures BAA against: 7.6 percent a year at a worst drawdown of 22.2 percent, losing 18.1 in 2022. The published gate starved against it at 5.6. The two-bird floor cleared it at 9.1 over the full record while making plus 1.1 in the crash the 60/40 could not sidestep, and across the three lived years alone it sits just under, 12.3 against 12.5. SPY total return stays the platform's default yardstick, and against it nothing here wins: SPY finished at plus 598.6 percent versus the best gate's plus 333.4. The era was hostile to the whole design, and this is a diagnosis of one published parameter, not a pitch.
1 Methodology
Two registered circuits per window, identical except one declared change. Each arm loads the published Keller menus as fixed, name-selected lists - the offensive four (QQQ, VWO, VEA, BND), the defensive seven (TIP, DBC, BIL, IEF, TLT, LQD, AGG), the canary four (SPY, VWO, VEA, BND) - with nothing to reconstruct and no membership discretion anywhere. Selection momentum is Keller's relative momentum, the month-end price against the average of its thirteen most recent month-end closes; the canary reads the faster 13612W blend, twelve times the one-month return plus four times the three-month, two times the six-month and one times the twelve-month, divided by four. This is the aggressive G4 variant - one offensive slot, top-1 of the four; the balanced G12 (top-6 of a twelve-asset menu) is not walked here. Offensive months hold the single strongest offensive fund; defensive months hold the top three defensive funds with any slot scoring below one-month Treasury bills replaced by them. Books re-select monthly, executed on the first trading day after the month-end signal. The canary gate flips on the month-end close and the router acts one bar later, so no allocation ever sees its own signal day's return twice. In the headline pair, arm A retreats at one non-positive canary, the published setting, and arm B at two; the registration record hashes both circuits per window and the arms differ in that field alone.
Seventeen one-year windows, anchors each January 1 from 2009 through 2025, were registered before scoring, each window's hypothesis frozen with its circuit hash and advanced in sequence. Both arms are marked in total returns with distributions credited on their ex-dates, charged ten basis points per one-way traded dollar plus the router's switch cost on regime flips, against SPY rebuilt to total return by the same credit rule. The rules were transcribed from the published sources and checked against them before registration; the check caught, and fixed, an early draft that used the canary's 13612W for selection. A design pilot on a plain month-end price simulation, run before registration and reported in the discussion, chose the two-bird floor as the counterfactual; after external review of the first registered pair, three further pairs were registered and walked over the same windows under the same frame - three birds against four, completing the dial; the published all-or-nothing response against the graded VAA/DAA gradient, the arms differing in the canary's response mode and the router matrix that maps its four labels; and the published zero yardstick against canaries scored as excess momentum over one-month Treasury bills. The trial ledger records the committed runs and no unrecorded exploration on the registered circuits; the paired comparisons, their bootstraps, and the era tables (split at the 2023 anchor, whole windows only) were computed once at compile from the frozen per-window reports. The 60/40 rows are context, not an arm: SPY/IEF rebalanced monthly - the composition the source paper itself benchmarks against - computed from the same dividend-adjusted closes, labelled as computed wherever they appear, and carrying no registration; like every series in this paper it is quoted per calendar year in the text and chained on the figures' own bar grid in the figures.
2 Results
2.1 Headline
| Book | Total return | Per year | Volatility | Sharpe | Worst drawdown | Mean window |
|---|---|---|---|---|---|---|
| Benchmark (reference) | +598.6% | 12.11% | 17.9% | 0.73 | -34.1% | +12.95% |
| Two-bird floor (B=2) | +333.4% | 9.01% | 14.2% | 0.68 | -24.2% | +9.55% |
| 60/40 SPY/IEF, rebalanced monthly (computed) (companion run) | +238.2% | 7.43% | 10.3% | 0.75 | -22.2% | +7.80% |
| Canary as published (B=1) | +148.1% | 5.49% | 11.8% | 0.52 | -18.6% | +5.95% |
Volatility, Sharpe and worst drawdown are computed on each book's own stitched daily series over the identical trading days that Figure 2 draws, so the panel and the figure are the same arithmetic. Sharpe carries no cash hurdle. Mean window is the arithmetic average of the one-year window returns, each from its first close after the opening trade, and does not compound to the total beside it: the difference is volatility drag, plus that opening charge where the walk pays one.
2.2 Per-step results
| # | Out-of-sample window | Canary as published (B=1) SR | Two-bird floor (B=2) SR |
|---|---|---|---|
| 1 | 2009-01-02 → 2009-12-31 | 0.89 | 0.89 |
| 2 | 2010-01-04 → 2010-12-31 | -0.89 | -0.69 |
| 3 | 2011-01-03 → 2011-12-30 | 0.77 | 0.39 |
| 4 | 2012-01-03 → 2012-12-31 | 1.65 | 1.20 |
| 5 | 2013-01-02 → 2013-12-31 | -0.38 | 0.11 |
| 6 | 2014-01-02 → 2014-12-31 | 1.12 | 1.66 |
| 7 | 2015-01-02 → 2015-12-31 | -0.38 | -0.81 |
| 8 | 2016-01-04 → 2016-12-30 | 0.36 | 0.31 |
| 9 | 2017-01-03 → 2017-12-29 | 1.19 | 2.19 |
| 10 | 2018-01-02 → 2018-12-31 | -0.01 | 1.23 |
| 11 | 2019-01-02 → 2019-12-31 | 1.37 | 1.76 |
| 12 | 2020-01-02 → 2020-12-31 | 1.59 | 1.15 |
| 13 | 2021-01-04 → 2021-12-31 | 0.63 | 0.64 |
| 14 | 2022-01-03 → 2022-12-30 | 0.16 | 0.16 |
| 15 | 2023-01-03 → 2023-12-29 | 0.61 | 1.24 |
| 16 | 2024-01-02 → 2024-12-31 | 0.05 | 0.89 |
| 17 | 2025-01-02 → 2025-12-31 | -0.15 | 0.52 |
2.3 Search accounting
No search record exists for this design. It was not promoted from a recorded evolving search, so the number of alternatives tried before it, on paper, in another tool, or in the author's head, is unknown. Unknown is a different fact from one: a study with no lineage is not a strategy with one trial, it is a strategy with an unrecorded number of them. Accordingly no count of alternatives tried is claimed, and nothing in this paper is corrected for a search that was never recorded; the number that stands is the raw out-of-sample result plus this disclosure. The registered per-step record below (§4) still guarantees each window's hypothesis was hashed and registered before that window was scored.
2.4 The comparison
Both arms trade the same registered windows, so their returns can be PAIRED: inside each window the two return series are inner-joined date by date and the difference rCanary as published (B=1) − rTwo-bird floor (B=2) is the object under test. Because this is ONE pre-declared contrast, frozen at registration before any window was scored, the paired statistic needs no multiple-testing deflation, and the per-arm pooled numbers above are likewise uncorrected, because this design has no recorded search to correct against (§2.3). The paired contrast carries that gap differently from the arm levels: it was declared before each window ran and it is scored on the difference, so no window could be read first and scored after. What the timestamps cannot speak to is how this contrast came to be the declared one, which is the limit §2.3 states.
In the table: Arm A = Canary as published (B=1) · Arm B = Two-bird floor (B=2).
| # | Window | Paired bars | Arm A | Arm B | Δ | Leader |
|---|---|---|---|---|---|---|
| 1 | 2009-01-05 → 2009-12-31 | 251 | +18.5% | +18.5% | +0.0 pp | tie |
| 2 | 2010-01-05 → 2010-12-31 | 251 | -14.6% | -13.9% | -0.7 pp | Arm B |
| 3 | 2011-01-04 → 2011-12-30 | 251 | +7.5% | +4.3% | +3.3 pp | Arm A |
| 4 | 2012-01-04 → 2012-12-31 | 249 | +17.9% | +13.8% | +4.1 pp | Arm A |
| 5 | 2013-01-03 → 2013-12-31 | 251 | -2.2% | +0.5% | -2.7 pp | Arm B |
| 6 | 2014-01-03 → 2014-12-31 | 251 | +11.4% | +17.9% | -6.5 pp | Arm B |
| 7 | 2015-01-05 → 2015-12-31 | 251 | -2.7% | -9.7% | +7.1 pp | Arm A |
| 8 | 2016-01-05 → 2016-12-30 | 251 | +3.3% | +3.1% | +0.2 pp | Arm A |
| 9 | 2017-01-04 → 2017-12-29 | 250 | +11.0% | +24.4% | -13.4 pp | Arm B |
| 10 | 2018-01-03 → 2018-12-31 | 250 | -0.2% | +12.5% | -12.6 pp | Arm B |
| 11 | 2019-01-03 → 2019-12-31 | 251 | +14.5% | +20.6% | -6.1 pp | Arm B |
| 12 | 2020-01-03 → 2020-12-31 | 252 | +28.5% | +23.1% | +5.4 pp | Arm A |
| 13 | 2021-01-05 → 2021-12-31 | 251 | +6.0% | +9.3% | -3.3 pp | Arm B |
| 14 | 2022-01-04 → 2022-12-30 | 250 | +1.1% | +1.1% | +0.0 pp | tie |
| 15 | 2023-01-04 → 2023-12-29 | 249 | +4.2% | +13.9% | -9.7 pp | Arm B |
| 16 | 2024-01-03 → 2024-12-31 | 251 | -0.3% | +15.2% | -15.5 pp | Arm B |
| 17 | 2025-01-03 → 2025-12-31 | 249 | -2.7% | +7.9% | -10.7 pp | Arm B |
Paired Sharpe of the difference track: -0.43 · block bootstrap (2000 paths, block 10, seed 1234): P(Canary as published (B=1) beats Two-bird floor (B=2)) = 2.4%.
Window win-rate. Canary as published (B=1) led 5 of 17 windows (29.4%), Two-bird floor (B=2) led 10, and 2 windows were ties, and the mean window gap of -3.59 pp points the same way. Widest single window: 2024 at -15.5 pp.
| Period | Windows | Canary as published (B=1) | Two-bird floor (B=2) | 60/40 SPY/IEF | Mean gap | Canary as published (B=1) led |
|---|---|---|---|---|---|---|
| All windows | 17 | +5.95% | +9.55% | +7.80% | -3.59 pp | 5/17 |
| Before 2023 | 14 | +7.15% | +8.95% | +6.84% | -1.80 pp | 5/14 |
| 2023 onward | 3 | +0.38% | +12.33% | +12.31% | -11.95 pp | 0/3 |
3 The circuit
The strategy is a circuit of platform primitives, frozen when the study is registered. Below is the circuit as wired on the canvas, the objective it encodes and how the search runs through it, followed by the mathematics each primitive actually computes, the same formulas the execution engine runs. The complete parameterisation is preserved in the study ledger (Appendix A).
The sentence below is the registration record, generated when the circuit was registered and printed verbatim; the authored description of the design is Section 1.
A COMPARATIVE study: Canary as published (B=1) vs Two-bird floor (B=2), walked on the same registered out-of-sample windows. Canary as published (B=1): A regime-routed strategy-of-strategies allocating one book across 2 lanes, (A) keller_baa · a re-selected ranked basket; (B) keller_baa · a re-selected ranked basket, routed by the wired regime classifier, forward-tested out-of-sample from the anchor. Two-bird floor (B=2): A regime-routed strategy-of-strategies allocating one book across 2 lanes, (A) keller_baa · a re-selected ranked basket; (B) keller_baa · a re-selected ranked basket, routed by the wired regime classifier, forward-tested out-of-sample from the anchor. The arms differ in: Canary Gate (Keller), breadth_min: 1 → 2. The contrast under test: whether Canary as published (B=1) generates better risk-adjusted returns than Two-bird floor (B=2) over the identical out-of-sample windows.
Envelopes show counts, ratios, dates, and the parameters the author chose. Full price and per-name data series are not republished: the underlying market data is licensed to QuanterLab. Point figures quoted in the prose, a named holding's return over a stated span, are summary facts derived from public market prices, not redistributed series.
The objective and the search
Canary as published (B=1)
| Universe | 2 strategy lanes over keller_baa (see Strategy lanes). |
|---|---|
| Selection | metric across Momentum (SMA13 relative), Momentum (SMA13 relative) → highest 1 kept by Momentum (SMA13 relative). |
| Validation & out-of-sample | portfolio forward test (buy-and-hold book) (1y horizon from the anchor, monthly rebalance); regime-routed allocation across the wired strategies; overlays: Transaction Cost. |
| Regime layer | macro regime detected via Keller canary breadth (13612W, month-end). |
| Router lanes | (A) keller_baa · a re-selected ranked basket; (B) keller_baa · a re-selected ranked basket. |
| Other components | Select: Keller Defensive Select. |
Two-bird floor (B=2)
The specification is identical to Canary as published (B=1)'s table above, row for row; the one registered difference between the arms is itemized below.
What differs between the arms, one difference; the comparison is clean:
- paramCanary Gate (Keller), breadth_min: 1 → 2
Everything else is held identical, so an out-of-sample gap between the arms is attributable to this one change.
Cost elements are wired into the circuit, the realised drag is reported per step in Appendix B.
Show the mathematics, 5 primitives, formulas and parity notes
3.1 Price Loader
Bulk OHLCV fetch for the whole universe, point-in-time, no future bars.
Momentum, volatility, trend, every price-based metric needs history. This loads open/high/low/close/volume for all names in parallel, clipped so nothing after the anchor can leak in. The lookback window is derived automatically from the deepest metric you wired.
It loads exactly enough history for the hungriest downstream metric plus a warm-up buffer:
W = \max_k(\text{lookback}_k) + \text{buffer}, \qquad \text{bars} \le \text{anchor } t3.2 Top N
Keep the best N, rank, then cut.
Sort the survivors by the Composite Σ (or, if none is wired, the last metric in the chain) and keep the top (or bottom) N. The final narrowing from a scored list to a committed basket.
\text{Top-}N = \{\, i : \operatorname{rank}(\text{score}_i) \le N \,\}N = \operatorname{round}(f \cdot n_{\text{ranked}})3.3 Portfolio Backtest
Replay the portfolio forward, rebalanced, point-in-time, with costs.
Holds the basket and rebalances on schedule, re-selecting and re-optimizing point-in-time at each rebalance (so it only ever uses information available then), and reports the equity curve, Sharpe, drawdown and trade stats, optionally net of cost and risk overlays.
E_t = E_{t-1}\big(1 + \mathbf w_{t}^{\top}\mathbf r_t - \text{costs}_t\big)\text{DD}_t = \frac{E_t}{\max_{\tau\le t}E_\tau} - 1, \qquad \text{MaxDD} = \min_t \text{DD}_t\text{charge}_t \;=\; \text{loan}_t \cdot \frac{\text{spread}}{252}, \qquad \text{loan}_t = \begin{cases}\max(0,\,-\text{cash}_t) & \text{institutional (netted)}\\ \max(0,\,\text{long MV}_t - E_t) & \text{retail (no netting)}\end{cases}3.4 Transaction Cost
Charge for trading, slippage + commission on every turn.
Real trading isn't free. This deducts a cost proportional to how much you trade (turnover), in basis points, so the backtest reflects net, not gross, performance.
\text{cost}_t = \frac{\text{bps}}{10{,}000}\;\times\;\text{turnover}_t, \qquad \text{turnover}_t = \tfrac12\sum_i \lvert w_{i,t}-w_{i,t^-}\rvert3.5 Portfolio Forward Autopsy
The post-mortem, where the forward test’s return actually came from.
Runs after the Portfolio Forward Test and dissects its realized path: per-rebalance contributions, winners and losers, exposure and cash periods, and how the realized route compares to what the risk cones projected. It computes nothing new about the future, it explains the past the book just lived.
Depth I–IV: headline attribution, per-segment breakdown, per-name contributions, and the calibration ledger (projected cone vs realized, segment by segment). In a study, this is the node that fills the appendices.
4 Discussion
4.1 Findings
Pooled over 4,259 paired out-of-sample days, the two-bird floor earned a Sharpe of 0.683 against 0.517 for the gate as published, compounding at 9.1 against 5.6 percent a year. The paired difference track runs at a Sharpe of 0.43 in the floor's favour and a block bootstrap of the daily differences (2,000 paths, ten-day blocks) finishes with the floor ahead in 97.6 percent of them; the floor led ten windows outright, the published gate five, with two exact ties, and every window the published gate won sits before the publication date. The pooled figures are dominated by the later era - read the era rows in the tables, not the average. Two benchmark rows frame every number in this paper: SPY total return, the walks' own registered yardstick, and the study's declared benchmark, a 60/40 SPY/IEF rebalanced monthly on the same data - the composition the source paper itself benchmarks against - computed alongside: 7.6 percent a year, a raw Sharpe of 0.77 on the same no-hurdle convention as the arms (which tops both of them), and a worst drawdown of 22.2 percent. In the same units, from the stitched record: the published gate drew down 18.6 percent at its worst, shallower than the benchmark and its one defensible statistic, and the floor 24.2, two points deeper. The floor clears the 60/40 on the full record, 9.1 against 7.6; across the three lived years it sits just under, 12.3 against 12.5 - the era rule this paper imposes on its arms applies to its benchmark too, and Table 3 carries the benchmark column so the reader can check both rows. One sign convention, stated once: the tables print paired Sharpes as arm A minus arm B, so the minus 0.43 in the table footer and the 0.43 in the floor's favour in this text are the same number.
The effective sample is smaller than the day count, and it is the denominator every number above should be read against. The two arms hold identical books except in the months where exactly one canary reads non-positive: 50 of the 204 month-end signals, one in four. The entire 3.6-point gap is earned in those fifty months, so the bootstrap's 97.6 percent should be read against an effective sample of fifty monthly decisions, not 4,259 daily observations. The fifty vetoes have a face: BND alone in 35, VEA in 7, VWO in 6, SPY in 2. Forty-eight of the fifty objections came from funds that are not the US market.
What the repair did not cost: in 2022, the year the strategy exists for, the two gates are identical to the decimal - plus 1.1 percent in both arms while SPY lost 18.6 and the monthly 60/40 lost 18.1. Genuine broad stress trips two or more canaries at once, so a floor of two retreats exactly when the published gate does. The same identity holds in 2009. A companion walk of the same seventeen windows prices what the shared retreat is worth: the identical machine with the canary welded open lost 31.9 percent in 2022.
The one crash where the floor pays is 2020. February's collapse tripped one canary before it tripped two, so the published gate fled earlier and kept 28.5 percent against the floor's 23.1, both clear of the index's 17.3. A slower trigger in the fastest crashes is the structural price of requiring agreement; the record states it at 5.4 points, once - and the graded walk below shows what buys it back.
The whole dial is now walked, not sampled. A second registered pair covers the back half over the same windows: three birds against four. Down the dial, the record reads - compounding: 5.6, 9.1, 7.7, 8.8 percent a year; pooled Sharpe: 0.517, 0.683, 0.549, 0.561; months spent defensive: 132, 82, 52, 19 of 204; the 2022 window: plus 1.1, plus 1.1, minus 12.7, minus 28.9; the 2020 window: 28.5, 23.1, 30.5, 30.9 (the covid crash was broad enough to trip even four birds in time); the three lived years: 0.4, 12.3, 12.9, 16.8 percent a year against the index's 23.4. Participation rises monotonically with B; protection decays monotonically past two; the pooled peak and the crossing of those two halves land on the same setting. The back pair itself leans to four over three (8.8 against 7.7, ahead in 75 of a hundred paths) and does not certify - stated here so no half of the curve rests on an unpublished number.
The third registered pair restores the response the paper collapsed. Keller's earlier Vigilant and Defensive Asset Allocation papers scale defensiveness by the count of bad birds; Bold Asset Allocation made it all-or-nothing at one. The graded arm maps the count back onto the same two books - full offense at zero bad birds, a third of the book defensive at one, two thirds at two, everything at three or more - with the response shape, canary labels plus the router matrix that maps them, as the registered change. Against its own published-gate twin the gradient compounded 7.7 against 5.6 percent a year on a pooled Sharpe of 0.641 against 0.526, ahead in 93 of a hundred resampled paths, which leans firmly and sits just under this series' certification line. What it is for shows up in the crashes: 2020 comes back to 27.8 against the published gate's 28.5 - against 23.1 for the two-bird floor - because a gradient never has to wait for a second bird to begin stepping aside. The bill moves to 2022, minus 2.4 against plus 2.2, the price of keeping a third of the book offensive while the first birds fell. Across the three lived years it took 10.7, 11.9 and 3.2 percent - about 8.5 a year where the published gate took 0.4 and the 60/40 took 12.5.
The fourth registered pair tests the deeper hypothesis: that the canary was measuring against the wrong zero, and a bond fund losing to nothing during rate normalisation is a rate signal rather than a risk signal. The yardstick arm re-scores every canary as excess 13612W momentum over one-month Treasury bills - a bird is bad only when it cannot beat the momentum of cash - with the published breadth floor of one kept in both arms. The record answers plainly: 5.7 against 5.6 percent a year, a paired Sharpe of 0.04, and sixteen of the seventeen windows within a tenth of a point. The one window of daylight is 2020, where bills' own momentum stayed positive as everything fell and the excess test tripped a touch earlier: 30.0 against 28.5. Everywhere else the bond bird fails against cash exactly as it fails against zero. The gate was not mismeasuring. It was misgoverned.
Two conventions, both leaning against the finding rather than for it. Sharpe ratios are raw daily-return Sharpes with no cash hurdle, which flatters the published gate - an arm that sat in Treasury bills yielding four to five percent through the very era in dispute - and it loses anyway. Execution follows the platform's clock, the first trading day after the month-end signal; on a plain simulation of the same rules, the paper's own close-on-close convention raises both arms (by 1.3 points a year at B=1 and 1.8 at B=2), so the next-day convention understates the floor's margin slightly rather than creating it. All four registered pairs carry identical machinery throughout - total returns with distributions on ex-dates, ten basis points per one-way traded dollar, monthly re-selection, byte-identical registered circuits except each pair's one declared change, which the registration records prove.
4.2 Interpretation
The replication came first, and it clears the machine. Run as published on tradable funds, Bold Asset Allocation does what its author designed: the companion walk shows the canary turning 2022 from minus 31.9 into plus 1.1, and the same canary holding the book near zero through 2023-2025 while the welded-open version took 38.9, 21.3 and 6.4. The engine was never the problem. The gate was, and the gate's problem has a precise shape: a veto rule gave any single fund the power to park the whole book, and the funds that used that power were almost never the market the strategy actually holds. A bond fund losing to zero during rate normalisation is a rate signal wearing a risk-off costume.
The author reached the same verdict by his own route. Hybrid Asset Allocation, February 2023 (SSRN 4346906), names the enemy in its title - rising yields and inflation - and replaces the four-bird canary with a single TIP canary built for that weather. Our repairs keep his canary and move his own dials instead: the breadth threshold B and the graded breadth response both come from his Vigilant and Defensive Asset Allocation papers, and Bold Asset Allocation collapsed both to all-or-nothing at one. This record prices the collapse from every side the mechanism suggests.
The sequence of choices is disclosed in full. A design pilot on a plain month-end price simulation preceded the first registered walk and picked the two-bird floor as the counterfactual; external review of that first registered pair asked whether two was a lucky point or a curve, and whether the deeper repairs would hold up; the remaining pairs - the back half of the dial, the graded response, the bills yardstick - were then registered and walked over the same windows. Every number above now comes from a registered record; nothing rests on the pilot.
Read together, the four pairs close the case. The breadth curve says the veto was the error: one notch of tolerance recovers the lost era and keeps both crash saves, and beyond two the protection itself dissolves. The graded walk says the response, not just the threshold, was collapsed: restoring the gradient buys back the one concession the floor makes, the slow trigger in fast crashes, and it is the shape a holder who wants this strategy should probably run. The yardstick walk closes the alternative: scored against cash instead of zero, the record barely moves, so the diagnosis cannot be talked around as a measurement artifact. And the era tables keep the scope in plain view - every repair here made a bad three years respectable, and the floor clears the study's own 60/40 over the full record; none of them made the strategy beat the equity index.
What this record is: the priced autopsy of why a published strategy starved after publication, the identification of the exact fifty months where the failure lived, and every repair the mechanism itself suggests - the author's own dials, moved one at a time - walked on the same registered windows inside one paper. What it is not: a claim that any setting beats the equity index over this record (none does, though the floor does clear the 60/40 the study measures against; the era was hostile to the whole design), a re-run of the author's 1970-2022 index-proxy history, or a promise about the next rate regime.
No search record exists for this study: the design was not promoted from a recorded evolving search, so the number of alternatives tried before it is UNKNOWN, which is a different fact from one. No count of alternatives tried is claimed, and nothing is corrected for a search that was never recorded; the number that stands is the raw out-of-sample result plus this disclosure. The out-of-sample windows are historical.
4.3 Limitations
The two-bird floor was selected before the sweep existed: a four-cell design pilot on the same data family picked it, one degree of freedom spent and disclosed, and the follow-up pairs - the back half of the dial, the graded response, the bills yardstick - were run after external review of the first registered pair; the sweep and the extra pairs confirm the choice rather than having preceded it. The graded pair's 93-in-a-hundred lean sits under this series' certification line and is stated as a lean. The effective sample behind the certified gap is fifty disagreement months, not 4,259 days, and the paper's headline numbers should be read at that granularity. The record runs seventeen windows from 2009 because VEA, BND and BIL trade only from mid-2007; the 2008 crash is outside the record, and the author's 1970-2022 index-proxy results are neither re-run nor contradicted here. The era table splits at the 2023 anchor so it holds whole windows; the 2022 window straddles the July publication and is grouped with the earlier era, the grouping least favourable to the repair, since 2022 is the canary's best year. Execution runs on the platform's next-day clock; the close-on-close sensitivity quoted in the findings is simulation-grade, not a registered record. Identical published-gate arms re-walked days apart differ at the window level - the 2022 window reads plus 1.1 in the first pair and plus 2.2 in the later pairs - because the vendor's adjusted-price history revises as each new distribution posts; every pair is therefore compared only within its own frozen record, and the small cross-pair drift is itself a live measurement of the replication spread this series returns to in its next study. The projection-calibration section is omitted and listed in the computed-not-featured ledger: months spent mostly in Treasury bills produce near-zero-width projection cones that mark tiny realized moves out of band, a property of the backtester's cash months, not of the comparison. 2020 shows the floor's structural cost - a slower trigger in the fastest crashes - and a crash that pins breadth at exactly one for months would not be gated at all; the graded response is the repair for exactly that case, at its own 2022 price. The lone-objector counts are descriptions of this record stated after seeing it. The 60/40 benchmark is computed alongside from the same data rather than walked as a registered arm, and is labelled as such wherever it appears. Dividends are credited gross of withholding; costs are a flat ten basis points with no market impact; the offensive book is one concentrated fund per month. The companion canary-against-welded walk and the three follow-up pairs reuse these same windows, so their figures corroborate rather than independently confirm.
Computed, not featured
The run produced the results below. The author chose not to feature them in this paper; they were computed all the same, are part of the frozen record, and are reproducible from the study's frozen circuit.
- Projection calibration, 204 rebalance projections, 4,072 VaR days. The forward tester itself. Every portfolio backtest fits a Monte Carlo cone and a VaR estimate before each rebalance and scores them against what happened, it is instrumentation on the test, not a primitive on the canvas. No Monte Carlo primitive is required, and adding one would be a separate, standalone analysis.
References
- Gelman, A., & Loken, E. (2013). The garden of forking paths: Why multiple comparisons can be a problem, even when there is no “fishing expedition.” Working paper, Columbia University.
- Harvey, C. R., Liu, Y., & Zhu, H. (2016). … and the Cross-Section of Expected Returns. Review of Financial Studies, 29(1), 5–68. doi:10.1093/rfs/hhv059
- Lo, A. W. (2002). The Statistics of Sharpe Ratios. Financial Analysts Journal, 58(4), 36–52. doi:10.2469/faj.v58.n4.2453
- Keller, W. J. (2022). Relative and Absolute Momentum in Times of Rising/Low Yields: Bold Asset Allocation (BAA). SSRN 4166845.
- Keller, W. J. and Keuning, J. W. (2017). Breadth Momentum and Vigilant Asset Allocation (VAA): Winning More by Losing Less. SSRN 3002624.
- Keller, W. J. and Keuning, J. W. (2018). Breadth Momentum and the Canary Universe: Defensive Asset Allocation (DAA). SSRN 3212862.
- Keller, W. J. and Keuning, J. W. (2023). Dual and Canary Momentum with Rising Yields/Inflation: Hybrid Asset Allocation (HAA). SSRN 4346906.
- Faber, M. (2007). A Quantitative Approach to Tactical Asset Allocation. Journal of Wealth Management 9(4).
Appendix A Reproducibility in QuanterLab
Each step is backed by a frozen run report. The study is re-derivable from the ledger below.
| # | Commit | Report | Anchor | OOS window |
|---|---|---|---|---|
| 1 | c82539d0b707 | 1485 | 2009-01-01 | 2009-01-02 → 2009-12-31 |
| 2 | 058e0e0d25fd | 1486 | 2010-01-01 | 2010-01-04 → 2010-12-31 |
| 3 | 5711f0ec7e48 | 1487 | 2011-01-01 | 2011-01-03 → 2011-12-30 |
| 4 | 573d0f47afd8 | 1488 | 2012-01-01 | 2012-01-03 → 2012-12-31 |
| 5 | 3bf4b057ce7f | 1489 | 2013-01-01 | 2013-01-02 → 2013-12-31 |
| 6 | e93acbeaa8da | 1490 | 2014-01-01 | 2014-01-02 → 2014-12-31 |
| 7 | 249e26276705 | 1491 | 2015-01-01 | 2015-01-02 → 2015-12-31 |
| 8 | 3fb1ac6ddd40 | 1492 | 2016-01-01 | 2016-01-04 → 2016-12-30 |
| 9 | 49aff47b9f28 | 1493 | 2017-01-01 | 2017-01-03 → 2017-12-29 |
| 10 | 94aa6a2bb62b | 1494 | 2018-01-01 | 2018-01-02 → 2018-12-31 |
| 11 | 8945e5e3b378 | 1495 | 2019-01-01 | 2019-01-02 → 2019-12-31 |
| 12 | 1103f33c7b2a | 1496 | 2020-01-01 | 2020-01-02 → 2020-12-31 |
| 13 | 5214f7e33212 | 1497 | 2021-01-01 | 2021-01-04 → 2021-12-31 |
| 14 | 76f4f74877e7 | 1498 | 2022-01-01 | 2022-01-03 → 2022-12-30 |
| 15 | dde2e77d2e3b | 1499 | 2023-01-01 | 2023-01-03 → 2023-12-29 |
| 16 | 5f3c47fb24d2 | 1500 | 2024-01-01 | 2024-01-02 → 2024-12-31 |
| 17 | f3005d88d4ab | 1501 | 2025-01-01 | 2025-01-02 → 2025-12-31 |
Appendix A2 Registration record
What this record does and does not establish. Every window in this study is historical: the data existed before the study began, so this is sequential registration on past windows, not pre-registration in the clinical-trial sense, and no procedure could make it so. What the platform does enforce is order, each step's specification was frozen and hashed before that step was scored, and the walk cannot advance past a step that was never run or close one with a result registered for a different window. The two timestamp columns below are the evidence: read them together and each registration precedes its own run, and each run precedes the next registration. A study whose registrations all post-date its runs would show it here. Wall-clock spacing between registrations varies with the author's schedule and queue latency; the ordering, not the tempo, is the claim.
“A COMPARATIVE study: Canary as published (B=1) vs Two-bird floor (B=2), walked on the same registered out-of-sample windows. Canary as published (B=1): A regime-routed strategy-of-strategies allocating one book across 2 lanes, (A) keller_baa · a re-selected ranked basket; (B) keller_baa · a re-selected ranked basket, routed by the wired regime classifier, forward-tested out-of-sample from the anchor. Two-bird floor (B=2): A regime-routed strategy-of-strategies allocating one book across 2 lanes, (A) keller_baa · a re-selected ranked basket; (B) keller_baa · a re-selected ranked basket, routed by the wired regime classifier, forward-tested out-of-sample from the anchor. The arms differ in: Canary Gate (Keller), breadth_min: 1 → 2. The contrast under test: whether Canary as published (B=1) generates better risk-adjusted returns than Two-bird floor (B=2) over the identical out-of-sample windows.”
The same hypothesis was registered independently at every step, hashed before each step's out-of-sample window was scored:
| # | Anchor | Registered at (UTC) | Run completed (UTC) |
|---|---|---|---|
| 1 | 2009-01-01 | 2026-08-22 21:45:48 | 2026-08-22 21:46:28 |
| 2 | 2010-01-01 | 2026-08-22 21:46:31 | 2026-08-22 21:47:01 |
| 3 | 2011-01-01 | 2026-08-22 21:47:04 | 2026-08-22 21:47:34 |
| 4 | 2012-01-01 | 2026-08-22 21:47:37 | 2026-08-22 21:48:07 |
| 5 | 2013-01-01 | 2026-08-22 21:48:10 | 2026-08-22 21:48:41 |
| 6 | 2014-01-01 | 2026-08-22 21:48:44 | 2026-08-22 21:49:14 |
| 7 | 2015-01-01 | 2026-08-22 21:49:17 | 2026-08-22 21:49:47 |
| 8 | 2016-01-01 | 2026-08-22 21:49:50 | 2026-08-22 21:50:20 |
| 9 | 2017-01-01 | 2026-08-22 21:50:24 | 2026-08-22 21:50:54 |
| 10 | 2018-01-01 | 2026-08-22 21:50:57 | 2026-08-22 21:51:27 |
| 11 | 2019-01-01 | 2026-08-22 21:51:30 | 2026-08-22 21:52:00 |
| 12 | 2020-01-01 | 2026-08-22 21:52:03 | 2026-08-22 21:52:34 |
| 13 | 2021-01-01 | 2026-08-22 21:52:37 | 2026-08-22 21:53:07 |
| 14 | 2022-01-01 | 2026-08-22 21:53:10 | 2026-08-22 21:53:40 |
| 15 | 2023-01-01 | 2026-08-22 21:53:43 | 2026-08-22 21:54:13 |
| 16 | 2024-01-01 | 2026-08-22 21:54:16 | 2026-08-22 21:54:47 |
| 17 | 2025-01-01 | 2026-08-22 21:54:50 | 2026-08-22 21:55:20 |
Appendix B Per-step diagnostics
Realized in the projection tables below is the risk engine scoring its own forecast: the buy-and-hold return of the segment that followed each rebalance, on the same gross basis the cone was projected on. It is deliberately not the charged, calendar-window total return the study’s tables print, so the two will not reconcile line by line; the cone and its outcome share one basis, which is what a calibration test requires. Each row names its segment’s span so a boundary session is visible.
Names held is the union across the window: the count of distinct instruments the book touched between the window’s first and last session, not the number it held at one time. A book that rotates monthly touches more names than it holds.
What each step's run actually did beyond its return: capital allocation across lanes and regimes, the portfolio book's rebalancing and cost drag, and how positions were sized. Harvested from the frozen run reports, present where the circuit produced them. Cost drag is the gap between the step's return before and after its trading costs, in percentage points of the step's starting capital, so on a book that trades every session and compounds it can exceed the step's own net return.
Open the full per-step grid (17 steps: every rebalance, capital routing and sizing, per window)
Step 1 · 2009-01-02 → 2009-12-31
Portfolio book, rebalanced monthly · 13 constructions · 7 names held · selection: reselect · 0.0% in cash · turnover 3.6× · cost drag 0.36%
Projection accuracy, realized outcome fell inside the P5–P95 cone in 91.7% of 12 scored rebalances (a well-calibrated 90% band contains ~90.0%) · 95% VaR breached on 3.75% of 240 days (expected ~5.0%)
| Rebalance | P5 | Median | P95 | Realized | In band | VaR 95 (1d) | Breaches |
|---|---|---|---|---|---|---|---|
| 2009-01-01 → 2009-02-01 | -3.1456% | 0.6377% | 4.7216% | -4.9476% | no | 0.7783% | 4 / 19 |
| 2009-02-01 → 2009-03-01 | -3.4245% | 0.3271% | 4.4466% | -1.8928% | yes | 0.8315% | 2 / 18 |
| 2009-03-01 → 2009-04-01 | -3.6335% | 0.4125% | 4.8911% | 1.8233% | yes | 0.8485% | 0 / 21 |
| 2009-04-01 → 2009-05-01 | -3.6876% | 0.5337% | 5.0317% | -3.4533% | yes | 0.8467% | 1 / 20 |
| 2009-05-01 → 2009-06-01 | -2.1922% | 0.2096% | 2.7653% | -0.2273% | yes | 0.4879% | 1 / 19 |
| 2009-06-01 → 2009-07-01 | -3.2249% | -0.0349% | 3.4646% | 1.5571% | yes | 0.5112% | 1 / 21 |
| 2009-07-01 → 2009-08-01 | -3.967% | 0.0115% | 4.4128% | 2.1138% | yes | 0.7548% | 0 / 21 |
| 2009-08-01 → 2009-09-01 | -3.9013% | 0.1399% | 4.4385% | 1.69% | yes | 0.7548% | 0 / 20 |
| 2009-09-01 → 2009-10-01 | -3.8643% | 0.1893% | 4.5017% | 1.8407% | yes | 0.7548% | 0 / 20 |
| 2009-10-01 → 2009-11-01 | -3.8079% | 0.2087% | 4.6536% | 0.4658% | yes | 0.7548% | 0 / 21 |
| 2009-11-01 → 2009-12-01 | -5.5438% | 0.053% | 6.2141% | 2.5163% | yes | 1.2277% | 0 / 19 |
| 2009-12-01 → 2010-01-01 | -5.5348% | 0.1339% | 6.5205% | -1.6519% | yes | 1.2277% | 0 / 21 |
| 2010-01-01 | no segment follows this rebalance, not scored | ||||||
Regime router, 2 lanes · regimes: defensive, offensive · 2 switches · switch cost 8.0 bps · cost drag 0.24%
| Regime | Pipeline A | Pipeline B |
|---|---|---|
| defensive | 0.0 | 1.0 |
| offensive | 1.0 | 0.0 |
Step 2 · 2010-01-04 → 2010-12-31
Portfolio book, rebalanced monthly · 13 constructions · 5 names held · selection: reselect · 0.0% in cash · turnover 4.4× · cost drag 0.44%
Projection accuracy, realized outcome fell inside the P5–P95 cone in 100.0% of 12 scored rebalances (a well-calibrated 90% band contains ~90.0%) · 95% VaR breached on 1.67% of 240 days (expected ~5.0%)
| Rebalance | P5 | Median | P95 | Realized | In band | VaR 95 (1d) | Breaches |
|---|---|---|---|---|---|---|---|
| 2010-01-01 → 2010-02-01 | -5.4923% | -0.1232% | 5.8773% | -2.82% | yes | 1.2309% | 0 / 18 |
| 2010-02-01 → 2010-03-01 | -5.5475% | -0.2011% | 5.7728% | 0.4974% | yes | 1.2309% | 0 / 18 |
| 2010-03-01 → 2010-04-01 | -6.2567% | -0.2739% | 5.8748% | 0.3715% | yes | 1.2309% | 0 / 22 |
| 2010-04-01 → 2010-05-01 | -5.9057% | -0.2711% | 5.8262% | 2.0677% | yes | 1.2277% | 0 / 20 |
| 2010-05-01 → 2010-06-01 | -5.8722% | -0.3836% | 5.6531% | -3.9114% | yes | 1.2277% | 0 / 19 |
| 2010-06-01 → 2010-07-01 | -4.6119% | 0.1135% | 5.3831% | 3.1489% | yes | 1.0949% | 1 / 21 |
| 2010-07-01 → 2010-08-01 | -4.3729% | 0.3423% | 5.3931% | 0.6179% | yes | 1.1149% | 0 / 20 |
| 2010-08-01 → 2010-09-01 | -4.2331% | 0.4449% | 5.6582% | 5.535% | yes | 1.1149% | 1 / 21 |
| 2010-09-01 → 2010-10-01 | -4.2666% | 0.5307% | 5.6736% | 0.5026% | yes | 1.1428% | 0 / 20 |
| 2010-10-01 → 2010-11-01 | -4.2834% | 0.5335% | 5.6984% | -1.2924% | yes | 1.1373% | 0 / 20 |
| 2010-11-01 → 2010-12-01 | -4.4581% | -0.1314% | 4.4855% | -1.1581% | yes | 0.9871% | 1 / 20 |
| 2010-12-01 → 2011-01-01 | -4.1845% | 0.0712% | 4.7932% | 1.062% | yes | 0.9443% | 1 / 21 |
| 2011-01-01 | no segment follows this rebalance, not scored | ||||||
Regime router, 2 lanes · regimes: defensive, offensive · 7 switches · switch cost 8.0 bps · cost drag 1.04%
| Regime | Pipeline A | Pipeline B |
|---|---|---|
| defensive | 0.0 | 1.0 |
| offensive | 1.0 | 0.0 |
Step 3 · 2011-01-03 → 2011-12-30
Portfolio book, rebalanced monthly · 13 constructions · 6 names held · selection: reselect · 0.0% in cash · turnover 4.7× · cost drag 0.47%
Projection accuracy, realized outcome fell inside the P5–P95 cone in 100.0% of 12 scored rebalances (a well-calibrated 90% band contains ~90.0%) · 95% VaR breached on 4.58% of 240 days (expected ~5.0%)
| Rebalance | P5 | Median | P95 | Realized | In band | VaR 95 (1d) | Breaches |
|---|---|---|---|---|---|---|---|
| 2011-01-01 → 2011-02-01 | -3.6383% | 0.6005% | 5.1982% | 1.0869% | yes | 0.9538% | 0 / 19 |
| 2011-02-01 → 2011-03-01 | -2.9614% | 0.5192% | 4.33% | 1.4167% | yes | 0.8138% | 0 / 18 |
| 2011-03-01 → 2011-04-01 | -3.0121% | 0.7193% | 4.4642% | 0.6182% | yes | 0.794% | 1 / 22 |
| 2011-04-01 → 2011-05-01 | -2.6747% | 0.6661% | 4.2556% | 1.9989% | yes | 0.7705% | 0 / 19 |
| 2011-05-01 → 2011-06-01 | -2.549% | 1.1418% | 5.0517% | -0.9491% | yes | 0.8024% | 2 / 20 |
| 2011-06-01 → 2011-07-01 | -2.6329% | 0.8957% | 4.7795% | -1.3993% | yes | 0.7947% | 0 / 21 |
| 2011-07-01 → 2011-08-01 | -2.7099% | 0.7044% | 4.3755% | 3.5555% | yes | 0.78% | 0 / 19 |
| 2011-08-01 → 2011-09-01 | -2.7309% | 0.7054% | 4.144% | 1.4979% | yes | 0.7414% | 2 / 22 |
| 2011-09-01 → 2011-10-01 | -2.9587% | 0.8689% | 4.9299% | -0.9575% | yes | 0.7738% | 2 / 20 |
| 2011-10-01 → 2011-11-01 | -3.5578% | 0.7299% | 5.3013% | -2.5204% | yes | 0.8972% | 2 / 20 |
| 2011-11-01 → 2011-12-01 | -3.7593% | 0.6518% | 5.3612% | -0.8543% | yes | 0.9147% | 0 / 20 |
| 2011-12-01 → 2012-01-01 | -3.8781% | 0.5552% | 5.2895% | 1.8999% | yes | 0.9147% | 2 / 20 |
| 2012-01-01 | no segment follows this rebalance, not scored | ||||||
Regime router, 2 lanes · regimes: defensive, offensive · 5 switches · switch cost 8.0 bps · cost drag 0.72%
| Regime | Pipeline A | Pipeline B |
|---|---|---|
| defensive | 0.0 | 1.0 |
| offensive | 1.0 | 0.0 |
Step 4 · 2012-01-03 → 2012-12-31
Portfolio book, rebalanced monthly · 12 constructions · 5 names held · selection: reselect · 0.0% in cash · turnover 6.6× · cost drag 0.66%
Projection accuracy, realized outcome fell inside the P5–P95 cone in 100.0% of 12 scored rebalances (a well-calibrated 90% band contains ~90.0%) · 95% VaR breached on 2.52% of 238 days (expected ~5.0%)
| Rebalance | P5 | Median | P95 | Realized | In band | VaR 95 (1d) | Breaches |
|---|---|---|---|---|---|---|---|
| 2012-01-01 → 2012-02-01 | -3.7313% | 0.6201% | 5.3454% | 1.6815% | yes | 0.9285% | 0 / 19 |
| 2012-02-01 → 2012-03-01 | -3.7669% | 0.6097% | 5.3637% | -0.9078% | yes | 0.9291% | 1 / 19 |
| 2012-03-01 → 2012-04-01 | -3.5859% | 0.758% | 5.581% | -1.9202% | yes | 0.9536% | 1 / 21 |
| 2012-04-01 → 2012-05-01 | -3.4447% | 0.5198% | 4.8078% | 2.1191% | yes | 0.8706% | 1 / 19 |
| 2012-05-01 → 2012-06-01 | -3.7147% | 0.7588% | 5.7324% | 4.8098% | yes | 0.9847% | 0 / 21 |
| 2012-06-01 → 2012-07-01 | -3.5041% | 1.0194% | 5.8537% | -2.0988% | yes | 0.9278% | 1 / 20 |
| 2012-07-01 → 2012-08-01 | -3.6515% | 0.7855% | 5.5235% | 2.2137% | yes | 0.9643% | 1 / 20 |
| 2012-08-01 → 2012-09-01 | -3.7541% | 0.9117% | 5.6388% | -0.1656% | yes | 0.9643% | 0 / 22 |
| 2012-09-01 → 2012-10-01 | -2.5384% | 0.7963% | 4.4414% | -0.4643% | yes | 0.7636% | 0 / 18 |
| 2012-10-01 → 2012-11-01 | -2.4738% | 0.6073% | 3.8516% | -0.8501% | yes | 0.7131% | 0 / 20 |
| 2012-11-01 → 2012-12-01 | -2.1739% | 0.4356% | 3.17% | 0.5222% | yes | 0.5674% | 0 / 20 |
| 2012-12-01 → window end | -3.3768% | 0.4665% | 4.6181% | -1.5476% | yes | 0.86% | 1 / 19 |
Regime router, 2 lanes · regimes: defensive, offensive · 8 switches · switch cost 8.0 bps · cost drag 1.2%
| Regime | Pipeline A | Pipeline B |
|---|---|---|
| defensive | 0.0 | 1.0 |
| offensive | 1.0 | 0.0 |
Step 5 · 2013-01-02 → 2013-12-31
Portfolio book, rebalanced monthly · 13 constructions · 6 names held · selection: reselect · 0.0% in cash · turnover 8.1× · cost drag 0.81%
Projection accuracy, realized outcome fell inside the P5–P95 cone in 91.7% of 12 scored rebalances (a well-calibrated 90% band contains ~90.0%) · 95% VaR breached on 11.67% of 240 days (expected ~5.0%)
| Rebalance | P5 | Median | P95 | Realized | In band | VaR 95 (1d) | Breaches |
|---|---|---|---|---|---|---|---|
| 2013-01-01 → 2013-02-01 | -2.6314% | 0.3627% | 3.5126% | 0.0368% | yes | 0.6557% | 1 / 20 |
| 2013-02-01 → 2013-03-01 | -2.2963% | 0.1317% | 2.761% | -1.7013% | yes | 0.5769% | 0 / 18 |
| 2013-03-01 → 2013-04-01 | -1.8703% | 0.4351% | 2.8857% | -0.1473% | yes | 0.4932% | 0 / 19 |
| 2013-04-01 → 2013-05-01 | -1.3433% | 0.3676% | 2.2152% | 0.6702% | yes | 0.3447% | 0 / 21 |
| 2013-05-01 → 2013-06-01 | -3.0574% | 0.8612% | 5.1919% | -4.9364% | no | 0.828% | 3 / 21 |
| 2013-06-01 → 2013-07-01 | -0.1078% | -0.0028% | 0.1064% | -0.0218% | yes | 0.0218% | 4 / 19 |
| 2013-07-01 → 2013-08-01 | -0.1088% | -0.0021% | 0.1112% | -0.0218% | yes | 0.0218% | 4 / 21 |
| 2013-08-01 → 2013-09-01 | -0.1113% | -0.0038% | 0.1104% | 0.0218% | yes | 0.0218% | 4 / 21 |
| 2013-09-01 → 2013-10-01 | -0.1097% | -0.0035% | 0.1068% | -0.0218% | yes | 0.0218% | 2 / 19 |
| 2013-10-01 → 2013-11-01 | -0.1182% | -0.0035% | 0.1076% | -0.0437% | yes | 0.0218% | 4 / 22 |
| 2013-11-01 → 2013-12-01 | -0.1078% | -0.0051% | 0.1017% | -0.0218% | yes | 0.0218% | 3 / 19 |
| 2013-12-01 → 2014-01-01 | -0.1104% | -0.0053% | 0.1021% | -0.0218% | yes | 0.0218% | 3 / 20 |
| 2014-01-01 | no segment follows this rebalance, not scored | ||||||
Regime router, 2 lanes · regimes: defensive, offensive · 5 switches · switch cost 8.0 bps · cost drag 0.72%
| Regime | Pipeline A | Pipeline B |
|---|---|---|
| defensive | 0.0 | 1.0 |
| offensive | 1.0 | 0.0 |
Step 6 · 2014-01-02 → 2014-12-31
Portfolio book, rebalanced monthly · 13 constructions · 6 names held · selection: reselect · 0.0% in cash · turnover 7.0× · cost drag 0.7%
Projection accuracy, realized outcome fell inside the P5–P95 cone in 100.0% of 12 scored rebalances (a well-calibrated 90% band contains ~90.0%) · 95% VaR breached on 2.08% of 240 days (expected ~5.0%)
| Rebalance | P5 | Median | P95 | Realized | In band | VaR 95 (1d) | Breaches |
|---|---|---|---|---|---|---|---|
| 2014-01-01 → 2014-02-01 | -0.1071% | -0.0037% | 0.1019% | 0.0% | yes | 0.0218% | 3 / 20 |
| 2014-02-01 → 2014-03-01 | -0.7186% | 0.0437% | 0.855% | 0.1813% | yes | 0.1899% | 0 / 18 |
| 2014-03-01 → 2014-04-01 | -2.0102% | 0.0066% | 2.1073% | -0.5628% | yes | 0.4587% | 0 / 20 |
| 2014-04-01 → 2014-05-01 | -0.7933% | 0.0089% | 0.8342% | 0.5256% | yes | 0.1935% | 0 / 20 |
| 2014-05-01 → 2014-06-01 | -2.9886% | -0.1252% | 2.8835% | 0.757% | yes | 0.6639% | 0 / 20 |
| 2014-06-01 → 2014-07-01 | -3.095% | 0.0782% | 3.4231% | 0.6166% | yes | 0.8457% | 0 / 20 |
| 2014-07-01 → 2014-08-01 | -2.844% | -0.0408% | 3.0217% | -0.9769% | yes | 0.6629% | 1 / 21 |
| 2014-08-01 → 2014-09-01 | -3.2821% | -0.1419% | 3.1673% | 1.8684% | yes | 0.8465% | 0 / 20 |
| 2014-09-01 → 2014-10-01 | -3.262% | -0.0293% | 3.3805% | -0.6689% | yes | 0.8081% | 0 / 20 |
| 2014-10-01 → 2014-11-01 | -3.5789% | -0.145% | 3.2921% | 0.731% | yes | 0.8078% | 0 / 22 |
| 2014-11-01 → 2014-12-01 | -3.1144% | -0.0877% | 3.2108% | 1.8004% | yes | 0.8078% | 0 / 18 |
| 2014-12-01 → 2015-01-01 | -3.2018% | -0.0422% | 3.4228% | 1.3078% | yes | 0.7812% | 1 / 21 |
| 2015-01-01 | no segment follows this rebalance, not scored | ||||||
Regime router, 2 lanes · regimes: defensive, offensive · 5 switches · switch cost 8.0 bps · cost drag 0.72%
| Regime | Pipeline A | Pipeline B |
|---|---|---|
| defensive | 0.0 | 1.0 |
| offensive | 1.0 | 0.0 |
Step 7 · 2015-01-02 → 2015-12-31
Portfolio book, rebalanced monthly · 13 constructions · 5 names held · selection: reselect · 0.0% in cash · turnover 5.7× · cost drag 0.57%
Projection accuracy, realized outcome fell inside the P5–P95 cone in 83.3% of 12 scored rebalances (a well-calibrated 90% band contains ~90.0%) · 95% VaR breached on 7.92% of 240 days (expected ~5.0%)
| Rebalance | P5 | Median | P95 | Realized | In band | VaR 95 (1d) | Breaches |
|---|---|---|---|---|---|---|---|
| 2015-01-01 → 2015-02-01 | -3.1327% | 0.0039% | 3.3675% | 5.2426% | no | 0.7994% | 1 / 19 |
| 2015-02-01 → 2015-03-01 | -2.9239% | 0.1818% | 3.569% | -3.2247% | no | 0.8078% | 4 / 18 |
| 2015-03-01 → 2015-04-01 | -3.1784% | 0.1436% | 3.7929% | 1.9036% | yes | 0.82% | 2 / 21 |
| 2015-04-01 → 2015-05-01 | -3.1973% | 0.2428% | 3.879% | -2.4231% | yes | 0.8471% | 1 / 20 |
| 2015-05-01 → 2015-06-01 | -3.0468% | 0.0656% | 3.4023% | -0.3408% | yes | 0.8006% | 3 / 19 |
| 2015-06-01 → 2015-07-01 | -0.9009% | -0.0032% | 0.9581% | -0.3933% | yes | 0.2245% | 3 / 21 |
| 2015-07-01 → 2015-08-01 | -0.1175% | -0.0071% | 0.1102% | -0.0% | yes | 0.0219% | 0 / 21 |
| 2015-08-01 → 2015-09-01 | -0.9049% | 0.0208% | 0.9743% | -0.072% | yes | 0.2292% | 0 / 20 |
| 2015-09-01 → 2015-10-01 | -0.8513% | 0.0596% | 0.9977% | 0.3478% | yes | 0.2245% | 1 / 20 |
| 2015-10-01 → 2015-11-01 | -2.4474% | 0.3105% | 3.3217% | -0.5212% | yes | 0.7092% | 1 / 21 |
| 2015-11-01 → 2015-12-01 | -0.782% | 0.0817% | 0.9863% | -0.0314% | yes | 0.2114% | 1 / 19 |
| 2015-12-01 → 2016-01-01 | -0.7899% | 0.0674% | 0.985% | -0.3751% | yes | 0.2114% | 2 / 21 |
| 2016-01-01 | no segment follows this rebalance, not scored | ||||||
Regime router, 2 lanes · regimes: defensive · 1 switches · switch cost 8.0 bps · cost drag 0.08%
| Regime | Pipeline A | Pipeline B |
|---|---|---|
| defensive | 0.0 | 1.0 |
Step 8 · 2016-01-04 → 2016-12-30
Portfolio book, rebalanced monthly · 12 constructions · 6 names held · selection: reselect · 0.0% in cash · turnover 9.1× · cost drag 0.91%
Projection accuracy, realized outcome fell inside the P5–P95 cone in 100.0% of 12 scored rebalances (a well-calibrated 90% band contains ~90.0%) · 95% VaR breached on 2.92% of 240 days (expected ~5.0%)
| Rebalance | P5 | Median | P95 | Realized | In band | VaR 95 (1d) | Breaches |
|---|---|---|---|---|---|---|---|
| 2016-01-01 → 2016-02-01 | -0.1122% | -0.0064% | 0.1054% | -0.0% | yes | 0.0219% | 2 / 18 |
| 2016-02-01 → 2016-03-01 | -2.3884% | 0.3328% | 3.238% | 1.7282% | yes | 0.7063% | 1 / 19 |
| 2016-03-01 → 2016-04-01 | -2.934% | 0.4939% | 4.2632% | 1.4603% | yes | 0.869% | 0 / 21 |
| 2016-04-01 → 2016-05-01 | -3.0764% | 0.3709% | 4.0148% | -0.3272% | yes | 0.8687% | 0 / 20 |
| 2016-05-01 → 2016-06-01 | -3.0268% | 0.3041% | 3.8206% | 0.3775% | yes | 0.8522% | 1 / 20 |
| 2016-06-01 → 2016-07-01 | -3.0354% | 0.4321% | 4.2467% | 4.2159% | yes | 0.892% | 0 / 21 |
| 2016-07-01 → 2016-08-01 | -3.4785% | -0.246% | 3.2241% | -2.2521% | yes | 0.8321% | 1 / 19 |
| 2016-08-01 → 2016-09-01 | -3.2357% | 0.5507% | 4.3533% | 0.0536% | yes | 0.9% | 0 / 22 |
| 2016-09-01 → 2016-10-01 | -2.9875% | 0.3933% | 3.9643% | -0.4208% | yes | 0.8522% | 1 / 20 |
| 2016-10-01 → 2016-11-01 | -3.6654% | -0.2838% | 3.289% | -2.1606% | yes | 0.8816% | 0 / 20 |
| 2016-11-01 → 2016-12-01 | -3.4915% | -0.5254% | 2.5949% | -1.2822% | yes | 0.7011% | 1 / 20 |
| 2016-12-01 → window end | -3.0741% | -0.4166% | 2.37% | 0.7259% | yes | 0.6342% | 0 / 20 |
Regime router, 2 lanes · regimes: defensive, offensive · 5 switches · switch cost 8.0 bps · cost drag 0.72%
| Regime | Pipeline A | Pipeline B |
|---|---|---|
| defensive | 0.0 | 1.0 |
| offensive | 1.0 | 0.0 |
Step 9 · 2017-01-03 → 2017-12-29
Portfolio book, rebalanced monthly · 13 constructions · 4 names held · selection: reselect · 0.0% in cash · turnover 3.7× · cost drag 0.37%
Projection accuracy, realized outcome fell inside the P5–P95 cone in 100.0% of 12 scored rebalances (a well-calibrated 90% band contains ~90.0%) · 95% VaR breached on 1.26% of 239 days (expected ~5.0%)
| Rebalance | P5 | Median | P95 | Realized | In band | VaR 95 (1d) | Breaches |
|---|---|---|---|---|---|---|---|
| 2017-01-01 → 2017-02-01 | -2.9497% | -0.3554% | 2.4111% | 0.2246% | yes | 0.6347% | 0 / 19 |
| 2017-02-01 → 2017-03-01 | -2.6718% | -0.2216% | 2.4325% | -0.3864% | yes | 0.6046% | 0 / 18 |
| 2017-03-01 → 2017-04-01 | -2.8422% | -0.1224% | 2.5802% | -1.2113% | yes | 0.5968% | 1 / 22 |
| 2017-04-01 → 2017-05-01 | -2.5108% | -0.1221% | 2.4637% | -0.7243% | yes | 0.5955% | 0 / 18 |
| 2017-05-01 → 2017-06-01 | -0.1275% | -0.0001% | 0.1351% | 0.0219% | yes | 0.0219% | 1 / 21 |
| 2017-06-01 → 2017-07-01 | -0.8074% | -0.0067% | 0.85% | 0.198% | yes | 0.2128% | 0 / 21 |
| 2017-07-01 → 2017-08-01 | -0.7561% | 0.0244% | 0.8411% | 0.343% | yes | 0.2008% | 0 / 19 |
| 2017-08-01 → 2017-09-01 | -0.7425% | 0.0751% | 0.8723% | 0.1638% | yes | 0.1942% | 0 / 22 |
| 2017-09-01 → 2017-10-01 | -3.0069% | 0.0285% | 3.28% | 0.2149% | yes | 0.7646% | 0 / 19 |
| 2017-10-01 → 2017-11-01 | -2.9539% | 0.1386% | 3.5274% | 1.6861% | yes | 0.7649% | 0 / 21 |
| 2017-11-01 → 2017-12-01 | -2.8408% | 0.2026% | 3.4061% | 0.3113% | yes | 0.7508% | 1 / 20 |
| 2017-12-01 → 2018-01-01 | -2.8139% | 0.1921% | 3.4112% | 0.9663% | yes | 0.7498% | 0 / 19 |
| 2018-01-01 | no segment follows this rebalance, not scored | ||||||
Regime router, 2 lanes · regimes: defensive, offensive · 5 switches · switch cost 8.0 bps · cost drag 0.72%
| Regime | Pipeline A | Pipeline B |
|---|---|---|
| defensive | 0.0 | 1.0 |
| offensive | 1.0 | 0.0 |
Step 10 · 2018-01-02 → 2018-12-31
Portfolio book, rebalanced monthly · 13 constructions · 4 names held · selection: reselect · 0.0% in cash · turnover 3.1× · cost drag 0.31%
Projection accuracy, realized outcome fell inside the P5–P95 cone in 91.7% of 12 scored rebalances (a well-calibrated 90% band contains ~90.0%) · 95% VaR breached on 4.18% of 239 days (expected ~5.0%)
| Rebalance | P5 | Median | P95 | Realized | In band | VaR 95 (1d) | Breaches |
|---|---|---|---|---|---|---|---|
| 2018-01-01 → 2018-02-01 | -2.7569% | 0.2809% | 3.4785% | -0.1086% | yes | 0.7292% | 0 / 20 |
| 2018-02-01 → 2018-03-01 | -1.9237% | 0.2637% | 2.6263% | -1.236% | yes | 0.5272% | 1 / 18 |
| 2018-03-01 → 2018-04-01 | -1.9682% | 0.3377% | 2.7463% | 0.7882% | yes | 0.5272% | 0 / 20 |
| 2018-04-01 → 2018-05-01 | -1.7878% | 0.437% | 2.759% | 1.673% | yes | 0.4933% | 0 / 20 |
| 2018-05-01 → 2018-06-01 | -1.6936% | 0.461% | 2.7986% | 1.1829% | yes | 0.4738% | 1 / 21 |
| 2018-06-01 → 2018-07-01 | -1.6645% | 0.4635% | 2.6821% | -0.314% | yes | 0.4693% | 1 / 20 |
| 2018-07-01 → 2018-08-01 | -1.7957% | 0.3087% | 2.5025% | 0.0115% | yes | 0.4713% | 2 / 20 |
| 2018-08-01 → 2018-09-01 | -1.9985% | 0.2428% | 2.4589% | 0.8569% | yes | 0.4983% | 1 / 22 |
| 2018-09-01 → 2018-10-01 | -1.7397% | 0.1949% | 2.2791% | 1.412% | yes | 0.4713% | 0 / 18 |
| 2018-10-01 → 2018-11-01 | -1.7212% | 0.4279% | 2.5509% | -2.3906% | no | 0.4461% | 3 / 22 |
| 2018-11-01 → 2018-12-01 | -0.1802% | 0.002% | 0.1882% | 0.164% | yes | 0.0219% | 0 / 20 |
| 2018-12-01 → 2019-01-01 | -0.1636% | 0.0077% | 0.1888% | 0.0109% | yes | 0.0219% | 1 / 18 |
| 2019-01-01 | no segment follows this rebalance, not scored | ||||||
Regime router, 2 lanes · regimes: defensive · 1 switches · switch cost 8.0 bps · cost drag 0.08%
| Regime | Pipeline A | Pipeline B |
|---|---|---|
| defensive | 0.0 | 1.0 |
Step 11 · 2019-01-02 → 2019-12-31
Portfolio book, rebalanced monthly · 13 constructions · 4 names held · selection: reselect · 0.0% in cash · turnover 3.1× · cost drag 0.31%
Projection accuracy, realized outcome fell inside the P5–P95 cone in 75.0% of 12 scored rebalances (a well-calibrated 90% band contains ~90.0%) · 95% VaR breached on 7.08% of 240 days (expected ~5.0%)
| Rebalance | P5 | Median | P95 | Realized | In band | VaR 95 (1d) | Breaches |
|---|---|---|---|---|---|---|---|
| 2019-01-01 → 2019-02-01 | -2.8831% | -0.1947% | 2.6251% | 0.3785% | yes | 0.6133% | 1 / 20 |
| 2019-02-01 → 2019-03-01 | -2.3863% | 0.0183% | 2.6217% | -0.2424% | yes | 0.6549% | 0 / 18 |
| 2019-03-01 → 2019-04-01 | -1.7474% | -0.0337% | 1.7456% | 2.7966% | no | 0.3945% | 0 / 20 |
| 2019-04-01 → 2019-05-01 | -2.4314% | 0.0911% | 2.7321% | 0.1351% | yes | 0.6165% | 0 / 20 |
| 2019-05-01 → 2019-06-01 | -2.3389% | 0.1154% | 2.7867% | 3.7118% | no | 0.6013% | 0 / 21 |
| 2019-06-01 → 2019-07-01 | -2.2549% | 0.1626% | 2.7354% | 1.3117% | yes | 0.602% | 1 / 19 |
| 2019-07-01 → 2019-08-01 | -2.197% | 0.2389% | 2.8896% | 0.2439% | yes | 0.5978% | 2 / 21 |
| 2019-08-01 → 2019-09-01 | -2.2519% | 0.2158% | 2.9019% | 4.8859% | no | 0.6081% | 1 / 21 |
| 2019-09-01 → 2019-10-01 | -2.1483% | 0.3751% | 3.0637% | -1.6182% | yes | 0.6081% | 5 / 19 |
| 2019-10-01 → 2019-11-01 | -2.4638% | 0.3768% | 3.2025% | -0.3852% | yes | 0.6239% | 3 / 22 |
| 2019-11-01 → 2019-12-01 | -2.4532% | 0.2079% | 3.0473% | -0.0699% | yes | 0.6722% | 3 / 19 |
| 2019-12-01 → 2020-01-01 | -2.4323% | 0.3129% | 3.1936% | -0.6859% | yes | 0.6872% | 1 / 20 |
| 2020-01-01 | no segment follows this rebalance, not scored | ||||||
Regime router, 2 lanes · regimes: defensive, offensive · 6 switches · switch cost 8.0 bps · cost drag 0.88%
| Regime | Pipeline A | Pipeline B |
|---|---|---|
| defensive | 0.0 | 1.0 |
| offensive | 1.0 | 0.0 |
Step 12 · 2020-01-02 → 2020-12-31
Portfolio book, rebalanced monthly · 12 constructions · 6 names held · selection: reselect · 0.0% in cash · turnover 6.6× · cost drag 0.66%
Projection accuracy, realized outcome fell inside the P5–P95 cone in 91.7% of 12 scored rebalances (a well-calibrated 90% band contains ~90.0%) · 95% VaR breached on 7.47% of 241 days (expected ~5.0%)
| Rebalance | P5 | Median | P95 | Realized | In band | VaR 95 (1d) | Breaches |
|---|---|---|---|---|---|---|---|
| 2020-01-01 → 2020-02-01 | -2.585% | 0.2103% | 3.1452% | -0.1683% | yes | 0.6716% | 1 / 20 |
| 2020-02-01 → 2020-03-01 | -2.3242% | 0.3544% | 3.2625% | 3.6297% | no | 0.6924% | 1 / 18 |
| 2020-03-01 → 2020-04-01 | -2.2887% | 0.574% | 3.7031% | 1.8086% | yes | 0.6885% | 5 / 21 |
| 2020-04-01 → 2020-05-01 | -3.1676% | 0.7463% | 4.9029% | 0.5987% | yes | 0.6832% | 1 / 20 |
| 2020-05-01 → 2020-06-01 | -3.1983% | 0.7324% | 4.9817% | -0.5807% | yes | 0.7087% | 2 / 19 |
| 2020-06-01 → 2020-07-01 | -3.2417% | 0.7627% | 5.1926% | 0.6668% | yes | 0.7162% | 2 / 21 |
| 2020-07-01 → 2020-08-01 | -3.3361% | 0.9302% | 5.6626% | 2.779% | yes | 0.7154% | 0 / 21 |
| 2020-08-01 → 2020-09-01 | -3.3478% | 0.89% | 5.4056% | -1.9236% | yes | 0.6475% | 3 / 20 |
| 2020-09-01 → 2020-10-01 | -3.4778% | 0.7838% | 5.326% | -0.6146% | yes | 0.6788% | 1 / 20 |
| 2020-10-01 → 2020-11-01 | -3.1482% | 0.8644% | 5.3035% | -1.8797% | yes | 0.7392% | 1 / 21 |
| 2020-11-01 → 2020-12-01 | -2.4292% | 0.5202% | 3.6764% | 1.4506% | yes | 0.4634% | 1 / 19 |
| 2020-12-01 → window end | -3.81% | 0.1385% | 4.5051% | 2.4487% | yes | 0.6986% | 0 / 21 |
Regime router, 2 lanes · regimes: defensive, offensive · 6 switches · switch cost 8.0 bps · cost drag 0.88%
| Regime | Pipeline A | Pipeline B |
|---|---|---|
| defensive | 0.0 | 1.0 |
| offensive | 1.0 | 0.0 |
Step 13 · 2021-01-04 → 2021-12-31
Portfolio book, rebalanced monthly · 13 constructions · 5 names held · selection: reselect · 0.0% in cash · turnover 4.1× · cost drag 0.41%
Projection accuracy, realized outcome fell inside the P5–P95 cone in 91.7% of 12 scored rebalances (a well-calibrated 90% band contains ~90.0%) · 95% VaR breached on 5.42% of 240 days (expected ~5.0%)
| Rebalance | P5 | Median | P95 | Realized | In band | VaR 95 (1d) | Breaches |
|---|---|---|---|---|---|---|---|
| 2021-01-01 → 2021-02-01 | -3.4185% | 0.3287% | 4.4433% | 0.9093% | yes | 0.6819% | 0 / 18 |
| 2021-02-01 → 2021-03-01 | -3.297% | 0.436% | 4.5341% | 1.3096% | yes | 0.6531% | 1 / 18 |
| 2021-03-01 → 2021-04-01 | -2.6775% | 0.4468% | 3.5635% | 0.1381% | yes | 0.62% | 4 / 22 |
| 2021-04-01 → 2021-05-01 | -2.7384% | 0.3148% | 3.529% | 2.3701% | yes | 0.6543% | 0 / 20 |
| 2021-05-01 → 2021-06-01 | -2.6601% | 0.3437% | 3.5601% | 1.4913% | yes | 0.6543% | 1 / 19 |
| 2021-06-01 → 2021-07-01 | -2.6559% | 0.4517% | 3.8574% | 0.7206% | yes | 0.6599% | 1 / 21 |
| 2021-07-01 → 2021-08-01 | -2.684% | 0.4651% | 3.7834% | 1.2058% | yes | 0.6631% | 2 / 20 |
| 2021-08-01 → 2021-09-01 | -3.3658% | 0.7541% | 5.3174% | -0.4211% | yes | 0.7603% | 1 / 21 |
| 2021-09-01 → 2021-10-01 | -3.5825% | 0.5916% | 5.037% | 1.0553% | yes | 0.7736% | 0 / 20 |
| 2021-10-01 → 2021-11-01 | -2.647% | 0.5801% | 3.9831% | 1.6941% | yes | 0.6755% | 0 / 20 |
| 2021-11-01 → 2021-12-01 | -2.5794% | 0.6495% | 4.0545% | -2.7752% | no | 0.6754% | 3 / 20 |
| 2021-12-01 → 2022-01-01 | -3.3435% | 0.661% | 5.0911% | 1.6244% | yes | 0.83% | 0 / 21 |
| 2022-01-01 | no segment follows this rebalance, not scored | ||||||
Regime router, 2 lanes · regimes: defensive, offensive · 6 switches · switch cost 8.0 bps · cost drag 0.88%
| Regime | Pipeline A | Pipeline B |
|---|---|---|
| defensive | 0.0 | 1.0 |
| offensive | 1.0 | 0.0 |
Step 14 · 2022-01-03 → 2022-12-30
Portfolio book, rebalanced monthly · 13 constructions · 4 names held · selection: reselect · 0.0% in cash · turnover 5.2× · cost drag 0.52%
Projection accuracy, realized outcome fell inside the P5–P95 cone in 83.3% of 12 scored rebalances (a well-calibrated 90% band contains ~90.0%) · 95% VaR breached on 7.11% of 239 days (expected ~5.0%)
| Rebalance | P5 | Median | P95 | Realized | In band | VaR 95 (1d) | Breaches |
|---|---|---|---|---|---|---|---|
| 2022-01-01 → 2022-02-01 | -3.3508% | 0.6056% | 4.8842% | 1.5016% | yes | 0.8489% | 0 / 19 |
| 2022-02-01 → 2022-03-01 | -2.3378% | 0.4634% | 3.5083% | 1.9869% | yes | 0.6477% | 0 / 18 |
| 2022-03-01 → 2022-04-01 | -2.7228% | 0.8165% | 4.3616% | 0.953% | yes | 0.7328% | 4 / 22 |
| 2022-04-01 → 2022-05-01 | -2.4642% | 0.757% | 4.2135% | 1.66% | yes | 0.7% | 1 / 19 |
| 2022-05-01 → 2022-06-01 | -2.3867% | 0.9162% | 4.4015% | 1.0805% | yes | 0.7424% | 1 / 20 |
| 2022-06-01 → 2022-07-01 | -1.8706% | 1.2446% | 4.5251% | -2.6213% | no | 0.6485% | 3 / 20 |
| 2022-07-01 → 2022-08-01 | -1.9435% | 1.0947% | 4.3483% | -0.6775% | yes | 0.6819% | 2 / 19 |
| 2022-08-01 → 2022-09-01 | -2.2804% | 1.1232% | 4.5274% | 0.3474% | yes | 0.7381% | 1 / 22 |
| 2022-09-01 → 2022-10-01 | -2.2974% | 0.9293% | 4.3315% | -1.516% | yes | 0.7381% | 4 / 20 |
| 2022-10-01 → 2022-11-01 | -0.0894% | 0.0038% | 0.099% | 0.186% | no | 0.0197% | 0 / 20 |
| 2022-11-01 → 2022-12-01 | -2.4475% | 0.8696% | 4.3704% | 0.2392% | yes | 0.7857% | 0 / 20 |
| 2022-12-01 → 2023-01-01 | -2.4137% | 0.9257% | 4.4508% | -0.8814% | yes | 0.7542% | 1 / 20 |
| 2023-01-01 | no segment follows this rebalance, not scored | ||||||
Regime router, 2 lanes · regimes: defensive, offensive · 2 switches · switch cost 8.0 bps · cost drag 0.24%
| Regime | Pipeline A | Pipeline B |
|---|---|---|
| defensive | 0.0 | 1.0 |
| offensive | 1.0 | 0.0 |
Step 15 · 2023-01-03 → 2023-12-29
Portfolio book, rebalanced monthly · 13 constructions · 3 names held · selection: reselect · 0.0% in cash · turnover 3.1× · cost drag 0.31%
Projection accuracy, realized outcome fell inside the P5–P95 cone in 50.0% of 12 scored rebalances (a well-calibrated 90% band contains ~90.0%) · 95% VaR breached on 1.68% of 238 days (expected ~5.0%)
| Rebalance | P5 | Median | P95 | Realized | In band | VaR 95 (1d) | Breaches |
|---|---|---|---|---|---|---|---|
| 2023-01-01 → 2023-02-01 | -0.18% | -0.0018% | 0.1835% | 0.2733% | no | 0.0219% | 0 / 19 |
| 2023-02-01 → 2023-03-01 | -0.2053% | -0.0028% | 0.2114% | 0.3392% | no | 0.0219% | 0 / 18 |
| 2023-03-01 → 2023-04-01 | -0.2447% | 0.0013% | 0.2397% | 0.3936% | no | 0.0219% | 0 / 22 |
| 2023-04-01 → 2023-05-01 | -0.2082% | 0.0125% | 0.246% | 0.3389% | no | 0.0219% | 0 / 18 |
| 2023-05-01 → 2023-06-01 | -0.2852% | 0.0005% | 0.3045% | 0.3719% | no | 0.0219% | 0 / 21 |
| 2023-06-01 → 2023-07-01 | -0.3083% | 0.0013% | 0.3182% | 0.4046% | no | 0.0219% | 0 / 20 |
| 2023-07-01 → 2023-08-01 | -1.6728% | -0.2043% | 1.3434% | 0.3602% | yes | 0.3637% | 1 / 19 |
| 2023-08-01 → 2023-09-01 | -3.0463% | 0.4482% | 3.9474% | 0.3765% | yes | 0.7702% | 0 / 22 |
| 2023-09-01 → 2023-10-01 | -2.846% | 0.3677% | 3.8165% | 0.3669% | yes | 0.7472% | 0 / 19 |
| 2023-10-01 → 2023-11-01 | -2.7779% | 0.4268% | 3.9423% | -0.0417% | yes | 0.7417% | 1 / 21 |
| 2023-11-01 → 2023-12-01 | -2.8419% | 0.3712% | 3.7592% | -0.558% | yes | 0.7417% | 1 / 20 |
| 2023-12-01 → 2024-01-01 | -1.8346% | -0.2415% | 1.4396% | 1.0439% | yes | 0.3846% | 1 / 19 |
| 2024-01-01 | no segment follows this rebalance, not scored | ||||||
Regime router, 2 lanes · regimes: defensive, offensive · 6 switches · switch cost 8.0 bps · cost drag 0.88%
| Regime | Pipeline A | Pipeline B |
|---|---|---|
| defensive | 0.0 | 1.0 |
| offensive | 1.0 | 0.0 |
Step 16 · 2024-01-02 → 2024-12-31
Portfolio book, rebalanced monthly · 12 constructions · 7 names held · selection: reselect · 0.0% in cash · turnover 10.8× · cost drag 1.08%
Projection accuracy, realized outcome fell inside the P5–P95 cone in 100.0% of 12 scored rebalances (a well-calibrated 90% band contains ~90.0%) · 95% VaR breached on 2.08% of 240 days (expected ~5.0%)
| Rebalance | P5 | Median | P95 | Realized | In band | VaR 95 (1d) | Breaches |
|---|---|---|---|---|---|---|---|
| 2024-01-01 → 2024-02-01 | -4.5392% | -0.5755% | 3.6387% | 0.3371% | yes | 0.9081% | 0 / 20 |
| 2024-02-01 → 2024-03-01 | -4.4742% | -0.5972% | 3.5941% | -2.4675% | yes | 0.9081% | 3 / 19 |
| 2024-03-01 → 2024-04-01 | -4.2033% | -0.5986% | 3.287% | 0.5394% | yes | 0.887% | 0 / 19 |
| 2024-04-01 → 2024-05-01 | -3.0071% | -0.3872% | 2.4699% | -0.9855% | yes | 0.6332% | 1 / 21 |
| 2024-05-01 → 2024-06-01 | -0.5163% | 0.0063% | 0.5638% | 0.4375% | yes | 0.0219% | 0 / 21 |
| 2024-06-01 → 2024-07-01 | -2.7215% | -0.2693% | 2.3871% | 0.2122% | yes | 0.6217% | 0 / 18 |
| 2024-07-01 → 2024-08-01 | -4.2222% | -0.3404% | 3.9502% | 0.4107% | yes | 0.94% | 0 / 21 |
| 2024-08-01 → 2024-09-01 | -5.2481% | -0.2697% | 5.2984% | 1.2812% | yes | 1.2751% | 0 / 21 |
| 2024-09-01 → 2024-10-01 | -5.0604% | -0.2232% | 5.0592% | 0.9756% | yes | 1.2666% | 0 / 19 |
| 2024-10-01 → 2024-11-01 | -5.6251% | -0.2624% | 5.2134% | -4.5065% | yes | 1.3044% | 0 / 22 |
| 2024-11-01 → 2024-12-01 | -1.1385% | -0.029% | 1.136% | 0.529% | yes | 0.2541% | 0 / 19 |
| 2024-12-01 → window end | -2.9991% | 0.169% | 3.5082% | -2.3341% | yes | 0.7293% | 1 / 20 |
Regime router, 2 lanes · regimes: defensive, offensive · 8 switches · switch cost 8.0 bps · cost drag 1.2%
| Regime | Pipeline A | Pipeline B |
|---|---|---|
| defensive | 0.0 | 1.0 |
| offensive | 1.0 | 0.0 |
Step 17 · 2025-01-02 → 2025-12-31
Portfolio book, rebalanced monthly · 13 constructions · 6 names held · selection: reselect · 0.0% in cash · turnover 7.8× · cost drag 0.78%
Projection accuracy, realized outcome fell inside the P5–P95 cone in 100.0% of 12 scored rebalances (a well-calibrated 90% band contains ~90.0%) · 95% VaR breached on 1.26% of 238 days (expected ~5.0%)
| Rebalance | P5 | Median | P95 | Realized | In band | VaR 95 (1d) | Breaches |
|---|---|---|---|---|---|---|---|
| 2025-01-01 → 2025-02-01 | -0.6118% | 0.001% | 0.6411% | 0.328% | yes | 0.0218% | 0 / 19 |
| 2025-02-01 → 2025-03-01 | -0.9736% | 0.0069% | 1.0527% | 0.8365% | yes | 0.2444% | 0 / 18 |
| 2025-03-01 → 2025-04-01 | -2.862% | 0.0787% | 3.1712% | 0.0482% | yes | 0.7072% | 0 / 20 |
| 2025-04-01 → 2025-05-01 | -2.9106% | -0.0312% | 2.9949% | 0.2774% | yes | 0.7055% | 2 / 20 |
| 2025-05-01 → 2025-06-01 | -2.8148% | 0.0697% | 3.1011% | -0.4777% | yes | 0.7055% | 0 / 20 |
| 2025-06-01 → 2025-07-01 | -0.9713% | 0.0011% | 1.0207% | 0.6382% | yes | 0.2271% | 0 / 19 |
| 2025-07-01 → 2025-08-01 | -2.9682% | -0.0319% | 3.1805% | -0.1845% | yes | 0.753% | 0 / 21 |
| 2025-08-01 → 2025-09-01 | -2.8964% | 0.034% | 3.1152% | 0.6545% | yes | 0.6939% | 0 / 20 |
| 2025-09-01 → 2025-10-01 | -2.7932% | 0.0836% | 3.1067% | 0.4734% | yes | 0.6604% | 0 / 20 |
| 2025-10-01 → 2025-11-01 | -3.0146% | 0.1232% | 3.2542% | 0.5643% | yes | 0.6843% | 0 / 22 |
| 2025-11-01 → 2025-12-01 | -2.7807% | 0.0601% | 3.1499% | 0.7724% | yes | 0.7231% | 0 / 18 |
| 2025-12-01 → 2026-01-01 | -2.755% | 0.2162% | 3.4679% | -1.467% | yes | 0.6888% | 1 / 21 |
| 2026-01-01 | no segment follows this rebalance, not scored | ||||||
Regime router, 2 lanes · regimes: defensive, offensive · 6 switches · switch cost 8.0 bps · cost drag 0.88%
| Regime | Pipeline A | Pipeline B |
|---|---|---|
| defensive | 0.0 | 1.0 |
| offensive | 1.0 | 0.0 |