


Elder's Triple Screen Taken Apart: Twenty Years on the S&P 500 as It Stood
The Triple Screen is the trading system at the centre of Alexander Elder's "Trading for a Living". It reads a stock three ways: the long trend, a dip against that trend, and the turn that ends the dip. Elder measures the dip with his own Force Index, the day's price change times the shares traded, and he buys only when the price climbs back above the previous day's high.
We ran it in two rounds on every stock in the S&P 500 as the index stood on each date, each buy taking a tenth of the money or a share of what was free, with no trading costs, because this is a test of the mechanism. In the first round we changed one screen at a time: buying the dip without waiting for the turn, measuring the dip without the volume, and dropping the trend screen. In the second round we added Elder's market rule, sitting in cash while the market itself is falling, and then beside it one more rule at a time: a short list of the clearest trends, a wider stop, and his monthly loss limit. Last we ran his rules together, with the short list picked again every quarter and the stop Elder places under the turn.
On the whole index the Triple Screen ended below where it started. Waiting for the turn, measuring the dip by its volume and the stock's own trend each left it with less money than the version without them: buying the dip itself was the best part of the system, and dropping the turn added the most money of anything we tried. Standing aside while the market was under its own average took off the most loss: it kept the portfolio in cash through most of the financial crisis and took two thirds off the worst fall. The short list of the clearest trends, added beside the market rule, gave back most of what the rule had won. No version made more money than the equal-weight index. Held at the index's own swings, the best protected version made a little less than the index and fell much less on the way.
What the Triple Screen is
Alexander Elder trained as a psychiatrist before he became a trader, and "Trading for a Living" is one of the best-known trading books. Its centrepiece is the Triple Screen. A trader, Elder wrote, should look at a market the way a sailor looks at the sea: the tide, the waves and the ripples. The tide is the long trend, and you trade only with it. The waves run against the tide, and you wait for one. The ripple is the moment to act, when the wave turns back with the tide.
The idea is easy to like. You trade with the trend instead of against it, you buy a pullback instead of chasing a rise, and you wait for proof that the pullback is over before you put money in. Elder also wrote the rules around it that a careful trader keeps: stand aside when the whole market is going down, watch a short list instead of everything, put a stop under every trade, and stop trading for the month when the month's losses reach six percent of the account.
A test of the mechanism
This test is not designed for how a normal person would trade the rule, because there is no such thing as a normal person, and we would miss somebody in every version. So we decided not to replicate a trader but the mechanism. Instead we tested the mechanism by its principles, applied to the whole S&P 500, its members as they stood on each date, all the time. We are conscious that nobody would trade it the way the study shows. The purpose of the study is to decompose the mechanism and evaluate its effects, rather than to be a trade simulation of the rule.
The rules, step by step
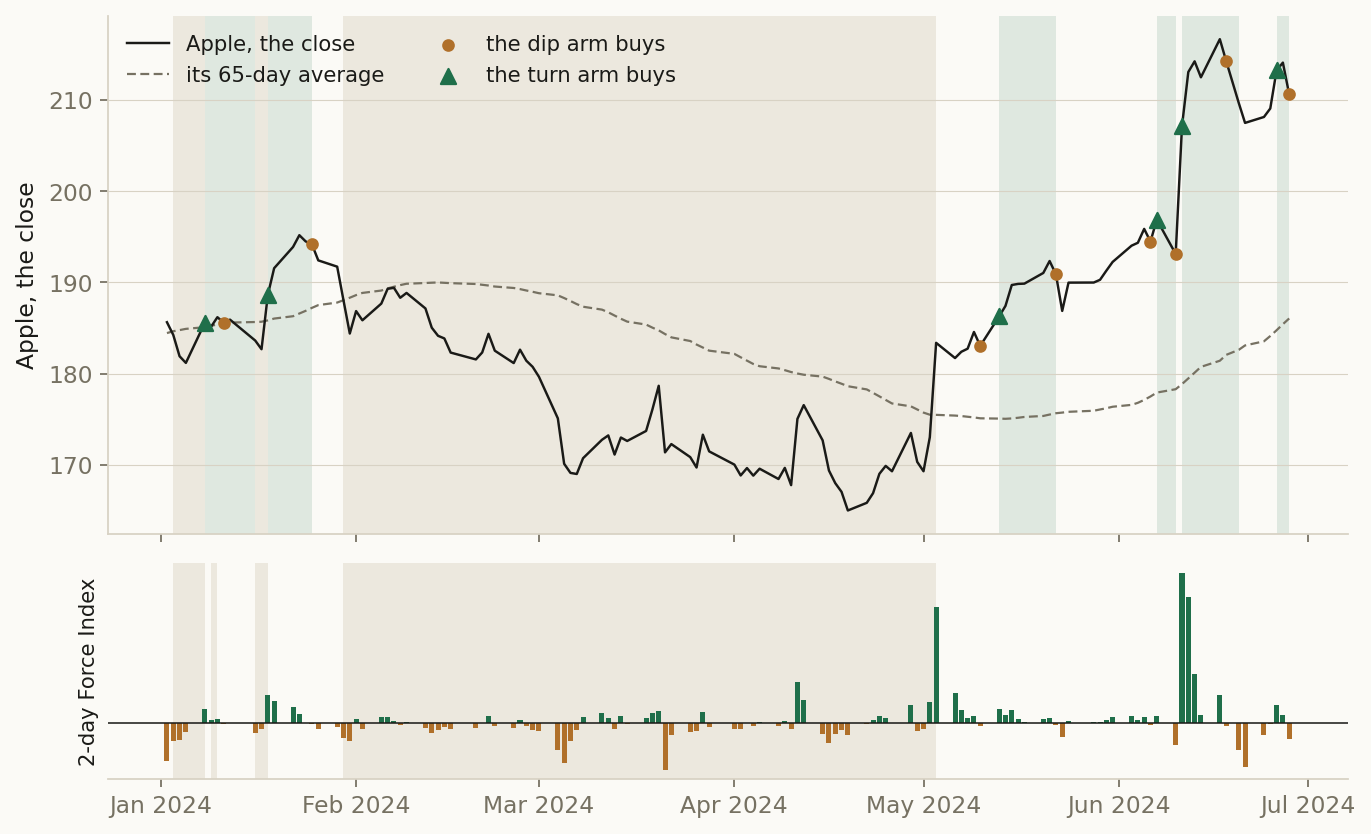
Elder's three screens, read on daily prices:
• The first screen, the trend: the close above its average of the last 65 trading days, about thirteen weeks. Elder reads the tide from the direction of a weekly trend, the weekly average rising or falling; here the close above its average stands in for the average rising, and thirteen weeks of days stand in for the weekly chart.
• The second screen, the dip: the 2-day Force Index below zero. It multiplies each day's price change by the shares traded and smooths it over two days, so a fall on heavy trading counts as a deeper dip.
• The third screen, the turn: the Force Index back above zero, with the close above the previous day's high, where Elder's buy order would have been filled.
• The exit: the first close below the previous day's low, a trailing stop read on the close.
Figure 1 shows the screens on Apple's prices in the first half of 2024.
Every year, on the first trading day of January:
1. Take the companies in the S&P 500 on that day, as the index stood then.
2. Check every one of them, every day of the year, against the three screens.
3. Buy each signal with a tenth of the money. When the day's buys ask for more than is free, they share what is free equally, so on a busy day each one gets a smaller slice; a signal that finds nothing free is skipped. A position keeps its size until its exit.
4. Sell each stock at its exit, then start again the next January.
The first round: one screen at a time. Beside the Triple Screen we ran three versions, each changing one thing:
• Buy the dip: the same trend screen, but buy at the close of the first day the Force Index drops below zero, without waiting for the turn.
• No volume: the same three screens with the volume taken out, the 2-day change of the price in place of the Force Index.
• No trend screen: the dip and the turn without the trend, in a rising or a falling stock.
The second round: the rules around the screens. First Elder's market rule on its own, then the market rule with one more rule beside it, one at a time:
• In cash when the market falls: no new buy and nothing held while the S&P 500 is under its own 65-day average, the market's trend read the same way as the stock's.
• In cash, plus a short list: instead of the whole index, each January the twenty members whose last thirteen weeks rose the steepest and straightest.
• In cash, plus the five-day-low stop: out at the first close below the lowest low of the five days before, a wider stop than the previous day's low that gives a swing room to run. It is our choice, not one of Elder's.
• In cash, plus the 6% monthly stop: when the month's losses reach 6% of the money, everything is sold and the portfolio waits for the next month.
The whole system. Last, Elder's rules together, with the short list picked again every quarter instead of every year: in cash when the market falls, the twenty clearest trends of the last thirteen weeks, the 6% monthly stop, and the stop Elder places under the turn: out at the first close below the lower low of the two days before, read every day, so on the day after the buy it sits under the turn day and the day before, and from then on it trails. That stop is Elder's own and no other version here used it, so the whole system is more than the second round's rules added up. Beside it, the bare Triple Screen in the same three-month stretches.
We measured every version against one yardstick: RSP, the equal-weight S&P 500, which holds every stock in the index in equal amounts, like our portfolios do. Prices only for every line, the index included: no dividends and no trading costs.
What we found, in short
Is anything in Elder's system worth keeping? His market rule is, with the best stop of the second round beside it (Figure 2). The Triple Screen that stands aside while the market itself is falling, and gets out under the five-day low, swings about half as much as the index. Held at the index's own swings, borrowing the difference at no cost, it followed the index year by year, stepped around both great crashes, and ended a little behind it. The rest of this section is how we got there.
Did the Triple Screen beat the equal-weight S&P 500? No (Figure 3). It kept pace for the first two years, then fell far deeper than the index in the financial crisis, and spent the next decade climbing back. Twenty years on it ended below where it started.
Did the screens help? Buying the dip without waiting for the turn did best, and neither the volume nor the stock's own trend helped. Each version with one part changed ended with more money than the Triple Screen itself. Buying the dip without waiting for the turn did best of the four and fell the least in the crisis. Taking the volume out of the dip helped a little, and dropping the trend screen helped more. The turn comes after the bounce has started, and here, bought at the close, it pays a little more than Elder's buy-stop would.
Why did the screens not take the money out of the market? Because on five hundred stocks there is always a dip turning somewhere. The Triple Screen found new buys almost every day of the twenty years, in the crisis too, so its portfolio was never empty: it never took a day off.
Does standing aside while the market falls help? Yes, and for the falls more than anything else we tried (Figure 4). The same Triple Screen, in cash whenever the S&P 500 was under its own average, sat out most of the financial crisis and much of the last bear market, ended with more than twice as much money as the full-time version, and its worst fall was about a third as deep. Only dropping the turn added more money.
Does a short list of the clearest trends help? No. Beside the market rule, picking the twenty prettiest charts of the last thirteen weeks every January gave back most of what the rule had won.
Do a wider stop and the monthly loss limit help? A little. Getting out under the five-day low instead of the previous day's low ended with the most money of any version in the second round and with the shallowest fall. The monthly loss limit changed little.
And the whole system, with the short list picked again every quarter? It ended about where it started, twenty years later (Figure 4). Its market rule kept it out of the financial crisis, and then it slid slowly for more than a decade. It carries the short list, Elder's own stop and the monthly limit at once, so this run cannot say which of them slowed it.
1 Methodology, in detail (click to open)
1 Methodology
Universe: the S&P 500's members on each date, as the index stood that day, from 2006 to 2025. Eight tests, each written down and locked before it ran, the rules never changed between years: the first seven in twenty one-year runs opened on the first trading day of each January, the whole system in eighty three-month runs opened on the first trading day of each January, April, July and October. Every member was checked every day with the platform's cards: Every Member (or Trend Slope and Top N for the short list), the Signal Module (the three screens), the market-trend card (the market rule), Stop Loss (the 6% monthly stop) and the Signal Forward Test (first come: each buy asks for a tenth of the money; when the day's buys ask for more than is free they share it equally; a position keeps its size to its exit; a signal finding nothing free is skipped). Signals are read at the close and bought at that close. Trend: the close above its 65-day simple average. Force Index: the 2-day exponential average of the day's price change times its volume. Turn: the Force Index crossing above zero with the close above the previous session's high. Exit: the first close below the previous session's low (the five-day-low stop: below the lowest low of the five sessions before; the whole system: below the lower low of the two sessions before, read every session so it trails, which on the day after the buy is the stop Elder places under the turn). The Triple Screen's portfolio took about 4,689 buys a year on the whole index (about nineteen a day, 98% of them slices smaller than a tenth) and skipped about 408 signals a year for want of free money. Market rule: no position while the S&P 500's tracking fund closes under its 65-day simple average. Short list: the twenty members with the highest 65-day trend slope times its R squared, rising trends only. Monthly stop: everything sold when the portfolio's losses since the month began reach 6%, until the next month. Yardstick: RSP held over the same days, prices only. No trading costs, no dividends, no borrowing in the tests (Figure 2's levelled line is drawn afterwards from the portfolio's daily value). Swings: the standard deviation of the daily returns times the square root of 252. Rehearsal runs outside the walks, in 2005, checked the wiring before each walk and are not part of the results.
Transaction costs are not modelled in this study; all results are gross of costs.
2 Results
Findings
Table 1 sets every version side by side over the twenty years.
2.1 Headline
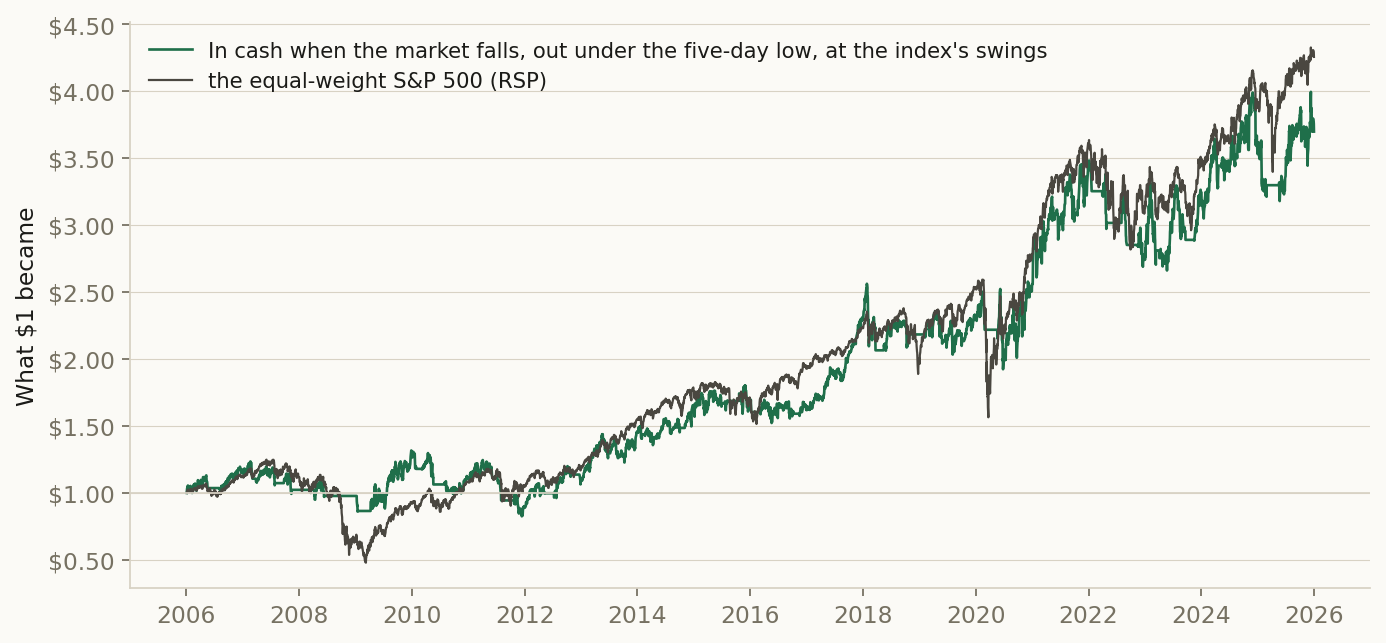
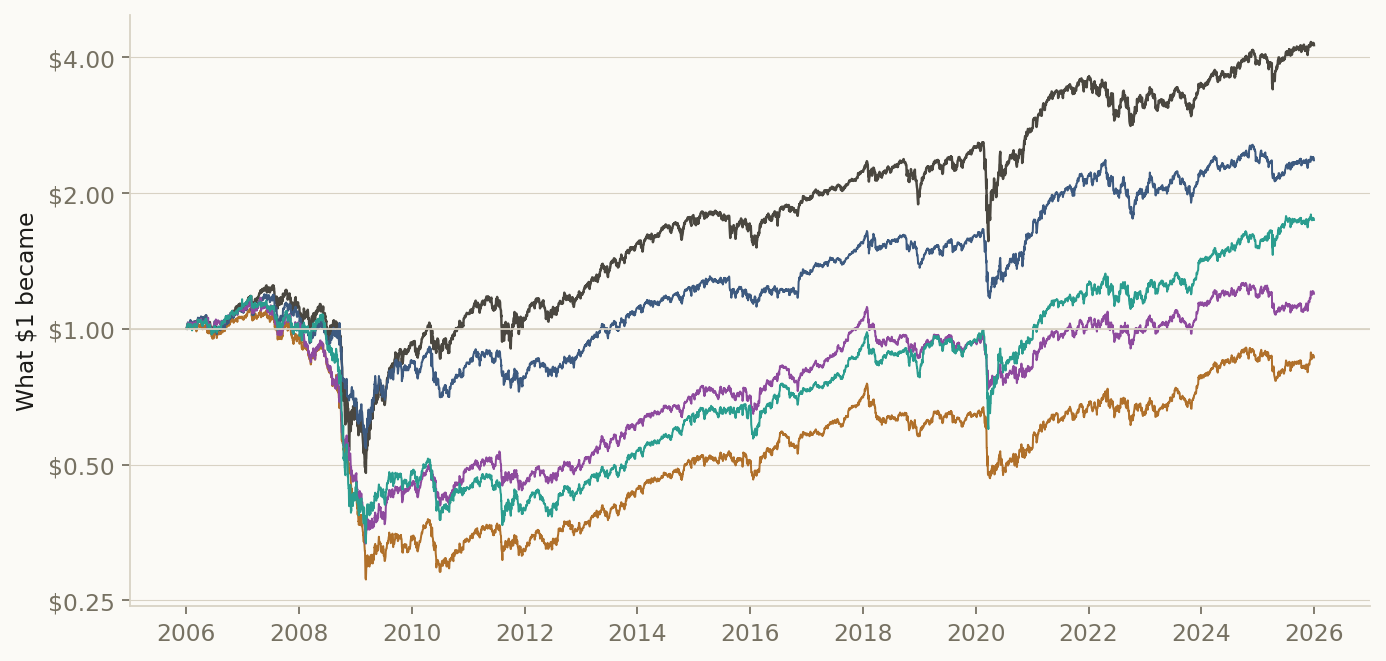
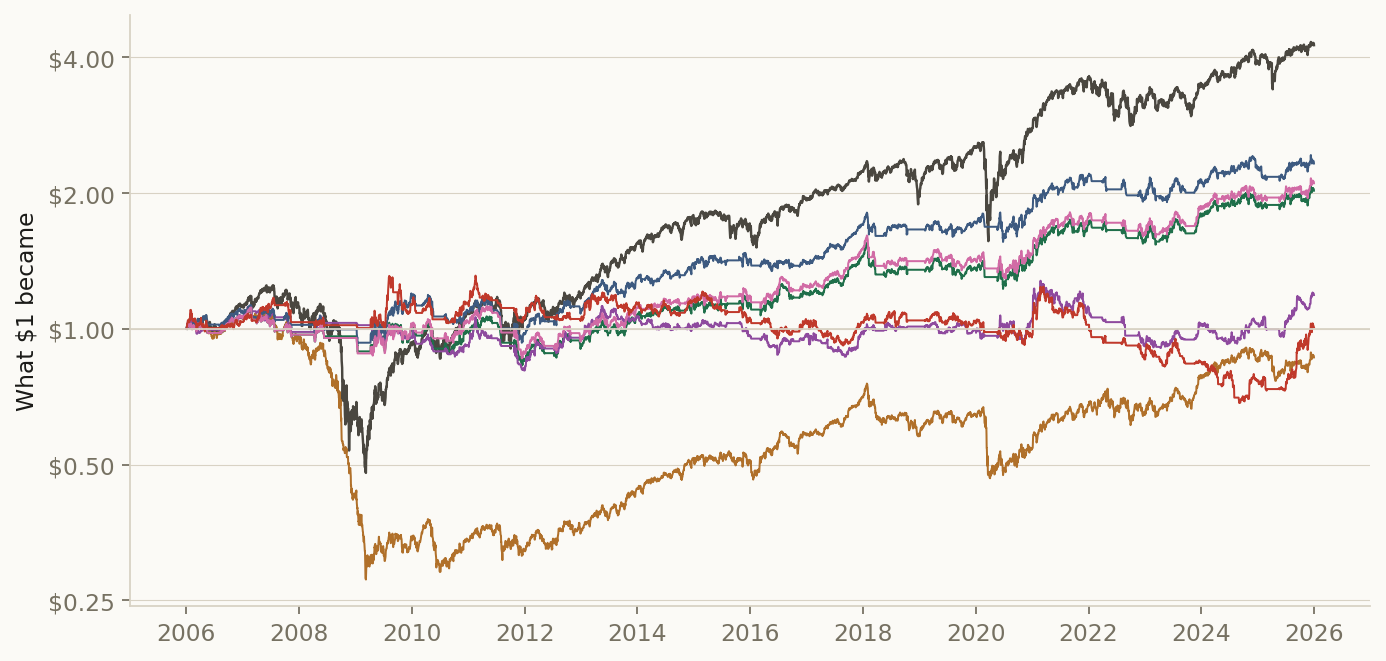
Table 1. Twenty years, 2006 to 2025, prices only, no trading costs. Swings a year: the yearly standard deviation of the daily returns. In cash: the share of the days the portfolio held nothing. Each "In cash, plus" row adds one rule to "In cash when the market falls"; the whole system uses a stop no other row uses.
| Version | $1 became | A year | Worst fall | Swings a year | Years ahead of RSP | In cash |
|---|---|---|---|---|---|---|
| Elder's Triple Screen | $0.86 | −0.7% | −75.0% | 16.2% | 6 of 20 | 0% |
| Buy the dip | $2.36 | 4.4% | −54.5% | 17.0% | 7 of 20 | 0% |
| No volume | $1.20 | 0.9% | −71.5% | 16.1% | 6 of 20 | 0% |
| No trend screen | $1.74 | 2.8% | −71.7% | 18.9% | 8 of 20 | 0% |
| In cash when the market falls | $2.02 | 3.6% | −25.7% | 11.6% | 6 of 20 | 27% |
| In cash, plus a short list | $1.19 | 0.9% | −29.0% | 10.3% | 5 of 20 | 27% |
| In cash, plus the five-day-low stop | $2.33 | 4.3% | −22.3% | 11.7% | 5 of 20 | 27% |
| In cash, plus the 6% monthly stop | $2.10 | 3.8% | −23.4% | 11.5% | 6 of 20 | 27% |
| The bare screens, every quarter | $0.79 | −1.2% | −75.6% | 16.2% | 5 of 20 | 0% |
| The whole system, every quarter | $1.01 | 0.0% | −47.8% | 12.5% | 4 of 20 | 28% |
| Equal-weight S&P 500 (RSP) | $4.26 | 7.5% | −61.6% | 20.7% |
Sections 2.2 to 3, the full record: every year, every test, and how each one was run (click to open)
2.2 Per-step results
| # | Out-of-sample window | Always in the market SR | In cash when the market falls SR | No volume SR | No trend screen SR | In cash, plus a short list SR | In cash, plus the five-day-low stop SR |
|---|---|---|---|---|---|---|---|
| 1 | 2006-01-03 → 2006-12-29 | 0.60 | 0.74 | 0.86 | 1.13 | 0.77 | 1.04 |
| 2 | 2007-01-03 → 2007-12-31 | -0.64 | -0.71 | -0.41 | -0.72 | -1.00 | -0.53 |
| 3 | 2008-01-02 → 2008-12-31 | -2.55 | -0.06 | -2.44 | -1.87 | 0.79 | -0.24 |
| 4 | 2009-01-02 → 2009-12-31 | -0.77 | 0.25 | -0.10 | 0.36 | -0.88 | 0.91 |
| 5 | 2010-01-04 → 2010-12-31 | 0.08 | -0.01 | 0.59 | -0.26 | -0.33 | -0.52 |
| 6 | 2011-01-03 → 2011-12-30 | -0.21 | -1.08 | -0.37 | -0.43 | -0.91 | -0.81 |
| 7 | 2012-01-03 → 2012-12-31 | 0.88 | 0.81 | 0.74 | 0.81 | 1.56 | 1.13 |
| 8 | 2013-01-02 → 2013-12-31 | 1.89 | 1.44 | 1.99 | 1.81 | 1.09 | 1.49 |
| 9 | 2014-01-02 → 2014-12-31 | 1.46 | 0.54 | 1.36 | 1.76 | -0.60 | 0.72 |
| 10 | 2015-01-02 → 2015-12-31 | -0.02 | 0.07 | 0.02 | 0.30 | -0.77 | 0.23 |
| 11 | 2016-01-04 → 2016-12-30 | 1.11 | 0.60 | 1.05 | 0.69 | 0.04 | -0.06 |
| 12 | 2017-01-03 → 2017-12-29 | 2.51 | 2.51 | 3.22 | 2.93 | 0.21 | 2.84 |
| 13 | 2018-01-02 → 2018-12-31 | -1.29 | -0.59 | -1.24 | -0.95 | 0.55 | -0.16 |
| 14 | 2019-01-02 → 2019-12-31 | 0.93 | 0.12 | 0.69 | 1.37 | -0.25 | 0.44 |
| 15 | 2020-01-02 → 2020-12-31 | -0.58 | 0.32 | -0.42 | 0.18 | 0.52 | 0.48 |
| 16 | 2021-01-04 → 2021-12-31 | 1.74 | 1.51 | 1.86 | 2.21 | 0.38 | 1.36 |
| 17 | 2022-01-03 → 2022-12-30 | -0.17 | -1.04 | -0.18 | -0.29 | -2.17 | -1.33 |
| 18 | 2023-01-03 → 2023-12-29 | 1.63 | 1.30 | 1.25 | 1.57 | 1.30 | 0.89 |
| 19 | 2024-01-02 → 2024-12-31 | 0.70 | 0.38 | 0.29 | 0.56 | 0.03 | 0.54 |
| 20 | 2025-01-02 → 2025-12-31 | 0.23 | 0.82 | 0.22 | 0.88 | 1.32 | 0.34 |
2.3 Search accounting
No search record exists for this design. It was not promoted from a recorded evolving search, so the number of alternatives tried before it, on paper, in another tool, or in the author's head, is unknown. Unknown is a different fact from one: a study with no lineage is not a strategy with one trial, it is a strategy with an unrecorded number of them. Accordingly no count of alternatives tried is claimed, and nothing in this paper is corrected for a search that was never recorded; the number that stands is the raw out-of-sample result plus this disclosure. The registered per-step record below (§4) still guarantees each window's hypothesis was hashed and registered before that window was scored.
2.4 The comparison
Both arms trade the same registered windows, so their returns can be PAIRED: inside each window the two return series are inner-joined date by date and the difference rAlways in the market − rIn cash when the market falls is the object under test. Because this is ONE pre-declared contrast, frozen at registration before any window was scored, the paired statistic needs no multiple-testing deflation, and the per-arm pooled numbers above are likewise uncorrected, because this design has no recorded search to correct against (§2.3). The paired contrast carries that gap differently from the arm levels: it was declared before each window ran and it is scored on the difference, so no window could be read first and scored after. What the timestamps cannot speak to is how this contrast came to be the declared one, which is the limit §2.3 states.
In the table: Arm A = Always in the market · Arm B = In cash when the market falls.
| # | Window | Paired bars | Arm A | Arm B | Δ | Leader | No volume | No trend screen | In cash, plus a short list | In cash, plus the five-day-low stop |
|---|---|---|---|---|---|---|---|---|---|---|
| 1 | 2006-01-04 → 2006-12-29 | 250 | +5.4% | +5.9% | -0.4 pp | Arm B | +9.9% | +12.9% | +6.8% | +8.8% |
| 2 | 2007-01-04 → 2007-12-31 | 250 | -10.0% | -8.3% | -1.7 pp | Arm B | -7.9% | -11.6% | -7.8% | -6.2% |
| 3 | 2008-01-03 → 2008-12-31 | 252 | -54.3% | -0.9% | -53.5 pp | Arm B | -53.0% | -55.3% | +4.7% | -2.3% |
| 4 | 2009-01-05 → 2009-12-31 | 251 | -21.7% | +3.0% | -24.7 pp | Arm B | -5.7% | +6.5% | -7.5% | +17.4% |
| 5 | 2010-01-05 → 2010-12-31 | 251 | -0.1% | -1.0% | +0.8 pp | Arm A | +9.0% | -6.6% | -3.5% | -6.5% |
| 6 | 2011-01-04 → 2011-12-30 | 251 | -5.2% | -13.6% | +8.4 pp | Arm A | -7.6% | -10.7% | -12.1% | -11.0% |
| 7 | 2012-01-04 → 2012-12-31 | 249 | +11.2% | +8.1% | +3.1 pp | Arm A | +9.1% | +10.7% | +17.6% | +12.9% |
| 8 | 2013-01-03 → 2013-12-31 | 251 | +24.0% | +17.3% | +6.7 pp | Arm A | +25.5% | +22.8% | +12.1% | +18.1% |
| 9 | 2014-01-03 → 2014-12-31 | 251 | +15.2% | +4.4% | +10.8 pp | Arm A | +14.3% | +18.9% | -4.7% | +6.5% |
| 10 | 2015-01-05 → 2015-12-31 | 251 | -1.2% | +0.2% | -1.4 pp | Arm B | -0.6% | +3.5% | -5.4% | +1.9% |
| 11 | 2016-01-05 → 2016-12-30 | 251 | +15.0% | +5.8% | +9.2 pp | Arm A | +14.5% | +9.7% | +0.0% | -1.1% |
| 12 | 2017-01-04 → 2017-12-29 | 250 | +21.3% | +21.3% | +0.0 pp | tie | +29.5% | +26.3% | +1.7% | +21.9% |
| 13 | 2018-01-03 → 2018-12-31 | 250 | -16.7% | -6.5% | -10.2 pp | Arm B | -16.1% | -12.9% | +3.5% | -2.3% |
| 14 | 2019-01-03 → 2019-12-31 | 251 | +10.0% | +0.7% | +9.3 pp | Arm A | +6.8% | +18.1% | -1.9% | +3.9% |
| 15 | 2020-01-03 → 2020-12-31 | 252 | -15.7% | +3.9% | -19.6 pp | Arm B | -12.2% | +0.6% | +6.2% | +6.8% |
| 16 | 2021-01-05 → 2021-12-31 | 251 | +24.3% | +20.4% | +3.9 pp | Arm A | +26.4% | +31.8% | +5.6% | +18.5% |
| 17 | 2022-01-04 → 2022-12-30 | 250 | -4.6% | -8.7% | +4.1 pp | Arm A | -4.9% | -7.3% | -17.9% | -11.4% |
| 18 | 2023-01-04 → 2023-12-29 | 249 | +22.0% | +15.6% | +6.5 pp | Arm A | +15.7% | +23.1% | +12.2% | +10.5% |
| 19 | 2024-01-03 → 2024-12-31 | 251 | +7.4% | +3.5% | +3.9 pp | Arm A | +2.6% | +5.8% | -0.2% | +5.4% |
| 20 | 2025-01-03 → 2025-12-31 | 249 | +2.2% | +8.8% | -6.6 pp | Arm B | +2.1% | +15.5% | +16.0% | +3.2% |
Paired Sharpe of the difference track: -0.32 · block bootstrap (2000 paths, block 10, seed 1234): P(Always in the market beats In cash when the market falls) = 7.9%.
Window win-rate. Always in the market led 11 of 20 windows (55.0%), In cash when the market falls led 8, and 1 windows were ties, yet the mean window gap runs the other way: -2.57 pp toward In cash when the market falls. Always in the market wins more often and smaller; In cash when the market falls wins less often and larger. The count and the mean answer different questions, and neither settles the comparison by itself. Widest single window: 2008 at -53.5 pp.
| Period | Windows | Always in the market | In cash when the market falls | Mean gap | Always in the market led |
|---|---|---|---|---|---|
| All windows | 20 | +1.43% | +4.01% | -2.57 pp | 11/20 |
| Before 2010 | 4 | -20.13% | -0.06% | -20.07 pp | 0/4 |
| 2010 onward | 16 | +6.82% | +5.02% | +1.80 pp | 11/16 |
The two eras disagree by 21.87 pp. The pooled figure is therefore not a standing property of either method, it is dominated by the later period. Read the two rows, not the average.
3 The circuit
The strategy is a circuit of platform primitives, frozen when the study is registered. Below is the circuit as wired on the canvas, the objective it encodes and how the search runs through it, followed by the mathematics each primitive actually computes, the same formulas the execution engine runs. The complete parameterisation is preserved in the study ledger (Appendix A).
The sentence below is the registered design with its rules in plain words; the exact registration record is in Appendix A2; the authored description of the design is Section 1.
A COMPARATIVE study: Always in the market vs In cash when the market falls, walked on the same registered out-of-sample windows. Always in the market: S&P 500, every member of the index, unranked, bought when FI (length 2) crosses above 0; only when the close is above its 65-day average and the close's place in the range of the previous 1 sessions (0 at its low, 1 at its high, above 1 a breakout) is above 1; sell when the close's place in the range of the previous 1 sessions (0 at its low, 1 at its high, above 1 a breakout) is below 0, and forward-tested out-of-sample from the anchor: the rule set is frozen at the anchor, with no in-sample re-optimization. In cash when the market falls: S&P 500, every member of the index, unranked, bought when FI (length 2) crosses above 0; only when the close is above its 65-day average and the close's place in the range of the previous 1 sessions (0 at its low, 1 at its high, above 1 a breakout) is above 1; sell when the close's place in the range of the previous 1 sessions (0 at its low, 1 at its high, above 1 a breakout) is below 0, conditioned on the wired regime classifier, and forward-tested out-of-sample from the anchor: the rule set is frozen at the anchor, with no in-sample re-optimization. The arms differ in: 2 places: Signal Forward Test, Invested when stressed: 100 → 0; SPY DMA Regime, added in In cash when the market falls. NOTE: with more than one difference, an out-of-sample gap cannot be attributed to any single change. The contrast under test: whether Always in the market generates better risk-adjusted returns than In cash when the market falls over the identical out-of-sample windows.
Every block in this study is a card from the platform's catalog: the Universe card's S&P 500 as it stood each January, Every Member, the Signal card holding Elder's three screens and his exit, the market-trend card that keeps one portfolio in cash while the S&P 500 is under its 65-day average, the Signal Forward Test with its Transaction Cost card, and the forward test's autopsy.
Envelopes show counts, ratios, dates, and the parameters the author chose. Full price and per-name data series are not republished: the underlying market data is licensed to QuanterLab. Point figures quoted in the prose, a named holding's return over a stated span, are summary facts derived from public market prices, not redistributed series.
The objective and the search
Always in the market
| Universe | S&P 500 index constituents. |
|---|---|
| Selection | every member of the universe, unranked (no screen, no ranking). |
| Signal generation | buy when FI (length 2) crosses above 0; only when the close is above its 65-day average and the close's place in the range of the previous 1 sessions (0 at its low, 1 at its high, above 1 a breakout) is above 1; sell when the close's place in the range of the previous 1 sessions (0 at its low, 1 at its high, above 1 a breakout) is below 0. |
| Validation & out-of-sample | signal forward test (1y horizon from the anchor, each position a fixed 1/10 of the book; a position keeps its size to its exit, new signals take free room, share it equally when it is short, and skip the trade when the book is full; up to 520 names priced); overlays: Transaction Cost. |
| Other components | Select: Every Member. |
In cash when the market falls
| Regime layer | macro regime detected via SPY above or below its 65-day average (the line only). |
|---|
Every other specification row is identical to Always in the market's table above.
What differs between the arms, 2 differences; more than one thing changes at once:
- paramSignal Forward Test, Invested when stressed: 100 → 0
- addedSPY DMA Regime, added in In cash when the market falls
Reader's note. With 2 settings changed at once across 2 nodes, an out-of-sample gap between the arms cannot be attributed to any single change, the arms are compared as whole packages, and any causal reading of one ingredient is unsupported by this design.
No transaction-cost elements are wired into this circuit; results are gross of costs.
Show the mathematics, 6 primitives, formulas and parity notes
3.1 Universe
The starting set of tickers, resolved point-in-time from the index change-log, so names delisted or removed later still compete on the dates they traded.
Before any math, you need a list of stocks. An index preset (S&P 500, Nasdaq-100, Dow 30) is reconstructed as it stood ON your anchor date by replaying the historical add/drop change-log backwards, so a 2018 backtest sees the 2018 membership, not today's winners.
Start from today's constituents and un-apply every membership change after the anchor t:
\mathcal{U}(t) = \mathcal{U}_{\text{now}} \;\ominus\; \{\text{adds after } t\} \;\oplus\; \{\text{drops after } t\}3.2 Every Member
Every name of the universe, unranked.
Passes the whole universe through as survivors, in no order and without a screen. With a point-in-time universe that is the index exactly as it stood at the anchor, so a rule meant to look at every member (every dip, every event) does, and no ranking choice sits between the universe and the signal.
\mathcal{S} = \mathcal{U}(t_0)3.3 Signal Module
The entry / exit rule, turn indicators into a per-bar trade signal.
Composes indicators (RSI, moving averages, …) with comparison and logic operators into a rule that says enter, exit, or hold each bar. The rule is emitted as a portable config the optimizer tunes and the walk-forward validates, so what you design is exactly what gets traded.
\text{signal}_t = \begin{cases} +1 & \text{entry rule true} \\ 0 & \text{exit rule true} \\ \text{hold} & \text{otherwise}\end{cases}3.4 Backtest Validator
Forward-test the winning rule on unseen, out-of-sample data.
Takes the wired rule config (the Walk-Forward validated config wins, else the optimized config, else the raw signal config) and trades it FORWARD on the out-of-sample window to the right of the anchor, data it never saw during optimization, re-deriving the regime as-of each bar. It produces the true out-of-sample equity curve, trades and statistics: the signal-path twin of the Portfolio Forward Test, not an in-sample replay.
E_t = E_{t-1}\,(1 + r_t),\qquad \text{Sharpe} = \frac{\bar r - r_f}{\sigma_r}\sqrt{252}3.5 Transaction Cost
Charge for trading, slippage + commission on every turn.
Real trading isn't free. This deducts a cost proportional to how much you trade (turnover), in basis points, so the backtest reflects net, not gross, performance.
\text{cost}_t = \frac{\text{bps}}{10{,}000}\;\times\;\text{turnover}_t, \qquad \text{turnover}_t = \tfrac12\sum_i \lvert w_{i,t}-w_{i,t^-}\rvert3.6 Spy Dma Regime
Price vs the 200-day average, the classic bull/bear line.
Looks at the benchmark relative to its 200-day moving average and the slope of that average. Above and rising is calm (bull); below and falling is stressed (bear); mixed is choppy.
P > \text{SMA}_{200}\ \wedge\ \tfrac{d}{dt}\text{SMA}_{200} > 0 \;\Rightarrow\; \text{calm}P > \text{SMA}_{200} \;\Rightarrow\; \text{calm}, \qquad P \le \text{SMA}_{200} \;\Rightarrow\; \text{stressed}4 Discussion
4.1 Interpretation
Elder wrote the Triple Screen for a trader watching a handful of markets. Run on every stock in the index it never rests. There is always a dip ending somewhere, so the portfolio is never empty, and it holds whatever turned most recently through every crash. The screens decide which stocks the money sits in, but nothing in them decides whether the money should be in stocks at all.
That question is answered by the rule Elder put next to the screens: look at the market's own trend first. It is the one rule here that took the money out of the market, and the one that changed its fate. It left the stock picking as it was and took the portfolio out of the worst stretches, and on the whole index that is most of what the system has to offer.
The other lesson is the turn. Buying the dip itself, without waiting for the turn, made the most money of anything we tried: the turn comes after part of the bounce it waits for, and here it was bought at the close, a little above where Elder's buy-stop would fill.
His short list did not help when it was added beside the market rule: twenty strong stocks bought on their dips every January did worse than the whole index bought on its dips.
So the Triple Screen on the S&P 500 works best as risk control: less money than the index, a much smaller worst fall, and about the same return for each unit of swing. That is a real thing for a trader who cannot sit through a halving of the account, and a weak case for anyone who can.
4.2 Limitations
The test uses the S&P 500, the largest American companies, so it says nothing about smaller stocks or other markets. Elder reads the trend from the direction of a weekly average; here the close above a thirteen-week average of daily prices stands in for it. The turn is bought at the close, as the engine fills every signal; Elder's buy-stop order fills during the day at the previous high, a little lower. His stops are read on the close, never during the day. Three of his rules are not in the test because no card runs them: the profit target at the top of the price channel beside the stop, the 2% rule that sizes each trade by its stop (every position here is a fixed tenth of the money), and selling short in a falling trend. In the quarterly runs every quarter starts with an empty portfolio, and a position still open when a quarter ends counts at that day's close. These portfolios trade often: on the whole index the Triple Screen made about nineteen new buys a day, nearly all of them slices smaller than a tenth, so trading costs would only widen the gap to the index. The levelled line in Figure 2 is the best of the second round's four versions, picked after the runs, and it borrows at no cost, which no real account gets. In the early years the data holds no prices for some companies that later left the index: about seven in ten of the 2006 members are in the test, and nearly all of today's.
Try it yourself
Open the study's circuit in the lab and change one card at a time: the length of the trend average, the days of the Force Index, the exit, or the market rule's average. Take the market rule out and you have the Triple Screen that never rests; swap the exit for the five-day low and you have the best version of the second round.
References
- Elder, A. (1993). Trading for a Living: Psychology, Trading Tactics, Money Management. John Wiley & Sons.
- Elder, A. (2014). The New Trading for a Living. John Wiley & Sons.
- Connors, L., and Alvarez, C. (2008). Short Term Trading Strategies That Work. TradingMarkets Publishing.
- Campbell, J. Y., Grossman, S. J., and Wang, J. (1993). Trading volume and serial correlation in stock returns. Quarterly Journal of Economics, 108(4), 905-939.
- Cooper, M. (1999). Filter rules based on price and volume in individual security overreaction. Review of Financial Studies, 12(4), 901-935.
- Faber, M. T. (2007). A quantitative approach to tactical asset allocation. The Journal of Wealth Management, 9(4), 69-79.
- Medhat, M., and Schmeling, M. (2022). Short-term momentum. Review of Financial Studies, 35(3), 1480-1526.
- Nagel, S. (2012). Evaporating liquidity. Review of Financial Studies, 25(7), 2005-2039.
Appendix A Reproducibility in QuanterLab
Each step is backed by a frozen run report. The study is re-derivable from the ledger below.
| # | Commit | Report | Anchor | OOS window |
|---|---|---|---|---|
| 1 | a63ec0cda066 | 16635 | 2006-01-01 | 2006-01-03 → 2006-12-29 |
| 2 | 49eca7de5bba | 16636 | 2007-01-01 | 2007-01-03 → 2007-12-31 |
| 3 | 21a383536338 | 16637 | 2008-01-01 | 2008-01-02 → 2008-12-31 |
| 4 | 02b48a946c60 | 16638 | 2009-01-01 | 2009-01-02 → 2009-12-31 |
| 5 | 737a464b6240 | 16639 | 2010-01-01 | 2010-01-04 → 2010-12-31 |
| 6 | 6f58e3afc063 | 16640 | 2011-01-01 | 2011-01-03 → 2011-12-30 |
| 7 | 5437f7b1cea1 | 16641 | 2012-01-01 | 2012-01-03 → 2012-12-31 |
| 8 | b7a8aa4ea393 | 16642 | 2013-01-01 | 2013-01-02 → 2013-12-31 |
| 9 | c05b70cdb1ac | 16643 | 2014-01-01 | 2014-01-02 → 2014-12-31 |
| 10 | 81a86bf27f99 | 16644 | 2015-01-01 | 2015-01-02 → 2015-12-31 |
| 11 | ea8fb2c4e08c | 16645 | 2016-01-01 | 2016-01-04 → 2016-12-30 |
| 12 | ffa80e25646f | 16646 | 2017-01-01 | 2017-01-03 → 2017-12-29 |
| 13 | f94154f3cffc | 16647 | 2018-01-01 | 2018-01-02 → 2018-12-31 |
| 14 | d40e304314e1 | 16648 | 2019-01-01 | 2019-01-02 → 2019-12-31 |
| 15 | 112fa0a6c8e0 | 16649 | 2020-01-01 | 2020-01-02 → 2020-12-31 |
| 16 | 547109a1b6a7 | 16650 | 2021-01-01 | 2021-01-04 → 2021-12-31 |
| 17 | b04b9414f22b | 16651 | 2022-01-01 | 2022-01-03 → 2022-12-30 |
| 18 | df0faf1a53f8 | 16652 | 2023-01-01 | 2023-01-03 → 2023-12-29 |
| 19 | 892284a7f3bf | 16653 | 2024-01-01 | 2024-01-02 → 2024-12-31 |
| 20 | 261c2c7c39c1 | 16654 | 2025-01-01 | 2025-01-02 → 2025-12-31 |
The methods the platform implements, for every study made on it, rest on these works.
- Gelman, A., & Loken, E. (2013). The garden of forking paths: Why multiple comparisons can be a problem, even when there is no “fishing expedition.” Working paper, Columbia University.
- Harvey, C. R., Liu, Y., & Zhu, H. (2016). … and the Cross-Section of Expected Returns. Review of Financial Studies, 29(1), 5–68. doi:10.1093/rfs/hhv059
- Lo, A. W. (2002). The Statistics of Sharpe Ratios. Financial Analysts Journal, 58(4), 36–52. doi:10.2469/faj.v58.n4.2453
Appendix A2 Registration record
What this record does and does not establish. Every window in this study is historical: the data existed before the study began, so this is sequential registration on past windows, not pre-registration in the clinical-trial sense, and no procedure could make it so. What the platform does enforce is order, each step's specification was frozen and hashed before that step was scored, and the walk cannot advance past a step that was never run or close one with a result registered for a different window. The two timestamp columns below are the evidence: read them together and each registration precedes its own run, and each run precedes the next registration. A study whose registrations all post-date its runs would show it here. Wall-clock spacing between registrations varies with the author's schedule and queue latency; the ordering, not the tempo, is the claim.
“A COMPARATIVE study: Always in the market vs In cash when the market falls, walked on the same registered out-of-sample windows. Always in the market: S&P 500, every member of the index, unranked, bought when FI (length 2) crosses above 0; only when the close is above its 65-day average and the close's place in the range of the previous 1 sessions (0 at its low, 1 at its high, above 1 a breakout) is above 1; sell when the close's place in the range of the previous 1 sessions (0 at its low, 1 at its high, above 1 a breakout) is below 0, and forward-tested out-of-sample from the anchor: the rule set is frozen at the anchor, with no in-sample re-optimization. In cash when the market falls: S&P 500, every member of the index, unranked, bought when FI (length 2) crosses above 0; only when the close is above its 65-day average and the close's place in the range of the previous 1 sessions (0 at its low, 1 at its high, above 1 a breakout) is above 1; sell when the close's place in the range of the previous 1 sessions (0 at its low, 1 at its high, above 1 a breakout) is below 0, conditioned on the wired regime classifier, and forward-tested out-of-sample from the anchor: the rule set is frozen at the anchor, with no in-sample re-optimization. The arms differ in: 2 places: Signal Forward Test, Invested when stressed: 100 → 0; SPY DMA Regime, added in In cash when the market falls. NOTE: with more than one difference, an out-of-sample gap cannot be attributed to any single change. The contrast under test: whether Always in the market generates better risk-adjusted returns than In cash when the market falls over the identical out-of-sample windows.”
The same hypothesis was registered independently at every step, hashed before each step's out-of-sample window was scored:
| # | Anchor | Registered at (UTC) | Run completed (UTC) |
|---|---|---|---|
| 1 | 2006-01-01 | 2026-11-04 06:53:16 | 2026-11-04 06:54:18 |
| 2 | 2007-01-01 | 2026-11-04 06:54:18 | 2026-11-04 06:55:20 |
| 3 | 2008-01-01 | 2026-11-04 06:55:20 | 2026-11-04 06:56:21 |
| 4 | 2009-01-01 | 2026-11-04 06:56:21 | 2026-11-04 06:57:35 |
| 5 | 2010-01-01 | 2026-11-04 06:57:35 | 2026-11-04 06:58:49 |
| 6 | 2011-01-01 | 2026-11-04 06:58:49 | 2026-11-04 07:00:03 |
| 7 | 2012-01-01 | 2026-11-04 07:00:03 | 2026-11-04 07:01:16 |
| 8 | 2013-01-01 | 2026-11-04 07:01:16 | 2026-11-04 07:02:30 |
| 9 | 2014-01-01 | 2026-11-04 07:02:30 | 2026-11-04 07:03:43 |
| 10 | 2015-01-01 | 2026-11-04 07:03:43 | 2026-11-04 07:04:57 |
| 11 | 2016-01-01 | 2026-11-04 07:04:57 | 2026-11-04 07:06:11 |
| 12 | 2017-01-01 | 2026-11-04 07:06:11 | 2026-11-04 07:07:29 |
| 13 | 2018-01-01 | 2026-11-04 07:07:29 | 2026-11-04 07:08:43 |
| 14 | 2019-01-01 | 2026-11-04 07:08:43 | 2026-11-04 07:09:56 |
| 15 | 2020-01-01 | 2026-11-04 07:09:56 | 2026-11-04 07:11:22 |
| 16 | 2021-01-01 | 2026-11-04 07:11:22 | 2026-11-04 07:12:53 |
| 17 | 2022-01-01 | 2026-11-04 07:12:53 | 2026-11-04 07:14:19 |
| 18 | 2023-01-01 | 2026-11-04 07:14:19 | 2026-11-04 07:15:45 |
| 19 | 2024-01-01 | 2026-11-04 07:15:45 | 2026-11-04 07:17:11 |
| 20 | 2025-01-01 | 2026-11-04 07:17:11 | 2026-11-04 07:18:44 |
The companion comparisons
This paper reads 4 more registered studies beside its own. Each one’s registration is printed here from their own record, in the same form as the table above: the hypothesis as it was registered, the day it was first locked, the time each window was registered and run, and what each window returned.
No volume
Its hypothesis was first locked on 4 November 2026, before its first window was run that day.
The same hypothesis was registered again, unchanged, at each of its 20 windows:
“A COMPARATIVE study: Force Index vs Price alone, walked on the same registered out-of-sample windows. Force Index: S&P 500, every member of the index, unranked, bought when FI (length 2) crosses above 0; only when the close is above its 65-day average and the close's place in the range of the previous 1 sessions (0 at its low, 1 at its high, above 1 a breakout) is above 1; sell when the close's place in the range of the previous 1 sessions (0 at its low, 1 at its high, above 1 a breakout) is below 0, and forward-tested out-of-sample from the anchor: the rule set is frozen at the anchor, with no in-sample re-optimization. Price alone: S&P 500, every member of the index, unranked, bought when ROC (length 2) crosses above 0; only when the close is above its 65-day average and the close's place in the range of the previous 1 sessions (0 at its low, 1 at its high, above 1 a breakout) is above 1; sell when the close's place in the range of the previous 1 sessions (0 at its low, 1 at its high, above 1 a breakout) is below 0, and forward-tested out-of-sample from the anchor: the rule set is frozen at the anchor, with no in-sample re-optimization. The arms differ in: Signal Module, config (entry · indicator: fi → roc). The contrast under test: whether Force Index generates better risk-adjusted returns than Price alone over the identical out-of-sample windows.”
| # | Anchor | Registered at (UTC) | Run completed (UTC) |
|---|---|---|---|
| 1 | 2006-01-01 | 2026-11-04 05:58:04 | 2026-11-04 05:59:05 |
| 2 | 2007-01-01 | 2026-11-04 05:59:05 | 2026-11-04 06:00:07 |
| 3 | 2008-01-01 | 2026-11-04 06:00:07 | 2026-11-04 06:01:08 |
| 4 | 2009-01-01 | 2026-11-04 06:01:08 | 2026-11-04 06:02:23 |
| 5 | 2010-01-01 | 2026-11-04 06:02:23 | 2026-11-04 06:03:37 |
| 6 | 2011-01-01 | 2026-11-04 06:03:37 | 2026-11-04 06:04:51 |
| 7 | 2012-01-01 | 2026-11-04 06:04:51 | 2026-11-04 06:06:04 |
| 8 | 2013-01-01 | 2026-11-04 06:06:04 | 2026-11-04 06:07:18 |
| 9 | 2014-01-01 | 2026-11-04 06:07:18 | 2026-11-04 06:08:32 |
| 10 | 2015-01-01 | 2026-11-04 06:08:32 | 2026-11-04 06:09:46 |
| 11 | 2016-01-01 | 2026-11-04 06:09:46 | 2026-11-04 06:10:59 |
| 12 | 2017-01-01 | 2026-11-04 06:10:59 | 2026-11-04 06:12:13 |
| 13 | 2018-01-01 | 2026-11-04 06:12:13 | 2026-11-04 06:13:27 |
| 14 | 2019-01-01 | 2026-11-04 06:13:27 | 2026-11-04 06:14:53 |
| 15 | 2020-01-01 | 2026-11-04 06:14:53 | 2026-11-04 06:16:18 |
| 16 | 2021-01-01 | 2026-11-04 06:16:18 | 2026-11-04 06:17:44 |
| 17 | 2022-01-01 | 2026-11-04 06:17:44 | 2026-11-04 06:19:10 |
| 18 | 2023-01-01 | 2026-11-04 06:19:10 | 2026-11-04 06:20:36 |
| 19 | 2024-01-01 | 2026-11-04 06:20:36 | 2026-11-04 06:21:49 |
| 20 | 2025-01-01 | 2026-11-04 06:21:49 | 2026-11-04 06:23:03 |
| # | Anchor | Force Index | Price alone |
|---|---|---|---|
| 1 | 2006-01-01 | +5.4% | +9.9% |
| 2 | 2007-01-01 | -10.0% | -7.9% |
| 3 | 2008-01-01 | -54.3% | -53.0% |
| 4 | 2009-01-01 | -21.7% | -5.7% |
| 5 | 2010-01-01 | -0.1% | +9.0% |
| 6 | 2011-01-01 | -5.2% | -7.6% |
| 7 | 2012-01-01 | +11.2% | +9.1% |
| 8 | 2013-01-01 | +24.0% | +25.5% |
| 9 | 2014-01-01 | +15.2% | +14.3% |
| 10 | 2015-01-01 | -1.2% | -0.6% |
| 11 | 2016-01-01 | +15.0% | +14.5% |
| 12 | 2017-01-01 | +21.3% | +29.5% |
| 13 | 2018-01-01 | -16.7% | -16.1% |
| 14 | 2019-01-01 | +10.0% | +6.8% |
| 15 | 2020-01-01 | -15.7% | -12.2% |
| 16 | 2021-01-01 | +24.3% | +26.4% |
| 17 | 2022-01-01 | -4.6% | -4.9% |
| 18 | 2023-01-01 | +22.0% | +15.7% |
| 19 | 2024-01-01 | +7.4% | +2.6% |
| 20 | 2025-01-01 | +2.2% | +2.1% |
No trend screen
Its hypothesis was first locked on 4 November 2026, before its first window was run that day.
The same hypothesis was registered again, unchanged, at each of its 20 windows:
“A COMPARATIVE study: With the trend screen vs Without the trend screen, walked on the same registered out-of-sample windows. With the trend screen: S&P 500, every member of the index, unranked, bought when FI (length 2) crosses above 0; only when the close is above its 65-day average and the close's place in the range of the previous 1 sessions (0 at its low, 1 at its high, above 1 a breakout) is above 1; sell when the close's place in the range of the previous 1 sessions (0 at its low, 1 at its high, above 1 a breakout) is below 0, and forward-tested out-of-sample from the anchor: the rule set is frozen at the anchor, with no in-sample re-optimization. Without the trend screen: S&P 500, every member of the index, unranked, bought when FI (length 2) crosses above 0; only when the close's place in the range of the previous 1 sessions (0 at its low, 1 at its high, above 1 a breakout) is above 1; sell when the close's place in the range of the previous 1 sessions (0 at its low, 1 at its high, above 1 a breakout) is below 0, and forward-tested out-of-sample from the anchor: the rule set is frozen at the anchor, with no in-sample re-optimization. The arms differ in: Signal Module, config (confirm: {2 entries} → {5 entries}). The contrast under test: whether With the trend screen generates better risk-adjusted returns than Without the trend screen over the identical out-of-sample windows.”
| # | Anchor | Registered at (UTC) | Run completed (UTC) |
|---|---|---|---|
| 1 | 2006-01-01 | 2026-11-04 06:23:17 | 2026-11-04 06:24:18 |
| 2 | 2007-01-01 | 2026-11-04 06:24:18 | 2026-11-04 06:25:26 |
| 3 | 2008-01-01 | 2026-11-04 06:25:26 | 2026-11-04 06:26:28 |
| 4 | 2009-01-01 | 2026-11-04 06:26:28 | 2026-11-04 06:27:29 |
| 5 | 2010-01-01 | 2026-11-04 06:27:29 | 2026-11-04 06:28:31 |
| 6 | 2011-01-01 | 2026-11-04 06:28:31 | 2026-11-04 06:29:33 |
| 7 | 2012-01-01 | 2026-11-04 06:29:33 | 2026-11-04 06:30:46 |
| 8 | 2013-01-01 | 2026-11-04 06:30:46 | 2026-11-04 06:31:48 |
| 9 | 2014-01-01 | 2026-11-04 06:31:48 | 2026-11-04 06:33:01 |
| 10 | 2015-01-01 | 2026-11-04 06:33:01 | 2026-11-04 06:34:03 |
| 11 | 2016-01-01 | 2026-11-04 06:34:03 | 2026-11-04 06:35:17 |
| 12 | 2017-01-01 | 2026-11-04 06:35:17 | 2026-11-04 06:36:30 |
| 13 | 2018-01-01 | 2026-11-04 06:36:31 | 2026-11-04 06:37:44 |
| 14 | 2019-01-01 | 2026-11-04 06:37:44 | 2026-11-04 06:38:58 |
| 15 | 2020-01-01 | 2026-11-04 06:38:58 | 2026-11-04 06:40:12 |
| 16 | 2021-01-01 | 2026-11-04 06:40:12 | 2026-11-04 06:41:38 |
| 17 | 2022-01-01 | 2026-11-04 06:41:38 | 2026-11-04 06:42:52 |
| 18 | 2023-01-01 | 2026-11-04 06:42:52 | 2026-11-04 06:44:06 |
| 19 | 2024-01-01 | 2026-11-04 06:44:06 | 2026-11-04 06:45:32 |
| 20 | 2025-01-01 | 2026-11-04 06:45:32 | 2026-11-04 06:46:45 |
| # | Anchor | With the trend screen | Without the trend screen |
|---|---|---|---|
| 1 | 2006-01-01 | +5.4% | +12.9% |
| 2 | 2007-01-01 | -10.0% | -11.6% |
| 3 | 2008-01-01 | -54.3% | -55.3% |
| 4 | 2009-01-01 | -21.7% | +6.5% |
| 5 | 2010-01-01 | -0.1% | -6.6% |
| 6 | 2011-01-01 | -5.2% | -10.7% |
| 7 | 2012-01-01 | +11.2% | +10.7% |
| 8 | 2013-01-01 | +24.0% | +22.8% |
| 9 | 2014-01-01 | +15.2% | +18.9% |
| 10 | 2015-01-01 | -1.2% | +3.5% |
| 11 | 2016-01-01 | +15.0% | +9.7% |
| 12 | 2017-01-01 | +21.3% | +26.3% |
| 13 | 2018-01-01 | -16.7% | -12.9% |
| 14 | 2019-01-01 | +10.0% | +18.1% |
| 15 | 2020-01-01 | -15.7% | +0.6% |
| 16 | 2021-01-01 | +24.3% | +31.8% |
| 17 | 2022-01-01 | -4.6% | -7.3% |
| 18 | 2023-01-01 | +22.0% | +23.1% |
| 19 | 2024-01-01 | +7.4% | +5.8% |
| 20 | 2025-01-01 | +2.2% | +15.5% |
In cash, plus a short list
Its hypothesis was first locked on 4 November 2026, before its first window was run that day.
The same hypothesis was registered again, unchanged, at each of its 20 windows:
“A COMPARATIVE study: Every S&P 500 member vs A short list of twenty, walked on the same registered out-of-sample windows. Every S&P 500 member: S&P 500, every member of the index, unranked, bought when FI (length 2) crosses above 0; only when the close is above its 65-day average and the close's place in the range of the previous 1 sessions (0 at its low, 1 at its high, above 1 a breakout) is above 1; sell when the close's place in the range of the previous 1 sessions (0 at its low, 1 at its high, above 1 a breakout) is below 0, conditioned on the wired regime classifier, and forward-tested out-of-sample from the anchor: the rule set is frozen at the anchor, with no in-sample re-optimization. A short list of twenty: S&P 500, the highest 20 by Trend speed times how straight it is (Clenow, 65 days), bought when FI (length 2) crosses above 0; only when the close is above its 65-day average and the close's place in the range of the previous 1 sessions (0 at its low, 1 at its high, above 1 a breakout) is above 1; sell when the close's place in the range of the previous 1 sessions (0 at its low, 1 at its high, above 1 a breakout) is below 0, conditioned on the wired regime classifier, and forward-tested out-of-sample from the anchor: the rule set is frozen at the anchor, with no in-sample re-optimization. The arms differ in: 2 places: Every Member → Trend Slope, substituted (its parameters change with the swap); Top-N, added in A short list of twenty. NOTE: with more than one difference, an out-of-sample gap cannot be attributed to any single change. The contrast under test: whether Every S&P 500 member generates better risk-adjusted returns than A short list of twenty over the identical out-of-sample windows.”
| # | Anchor | Registered at (UTC) | Run completed (UTC) |
|---|---|---|---|
| 1 | 2006-01-01 | 2026-11-04 07:18:58 | 2026-11-04 07:19:35 |
| 2 | 2007-01-01 | 2026-11-04 07:19:35 | 2026-11-04 07:20:12 |
| 3 | 2008-01-01 | 2026-11-04 07:20:12 | 2026-11-04 07:21:01 |
| 4 | 2009-01-01 | 2026-11-04 07:21:01 | 2026-11-04 07:21:50 |
| 5 | 2010-01-01 | 2026-11-04 07:21:50 | 2026-11-04 07:22:39 |
| 6 | 2011-01-01 | 2026-11-04 07:22:39 | 2026-11-04 07:23:32 |
| 7 | 2012-01-01 | 2026-11-04 07:23:32 | 2026-11-04 07:24:21 |
| 8 | 2013-01-01 | 2026-11-04 07:24:21 | 2026-11-04 07:25:10 |
| 9 | 2014-01-01 | 2026-11-04 07:25:10 | 2026-11-04 07:25:59 |
| 10 | 2015-01-01 | 2026-11-04 07:26:00 | 2026-11-04 07:26:49 |
| 11 | 2016-01-01 | 2026-11-04 07:26:49 | 2026-11-04 07:27:38 |
| 12 | 2017-01-01 | 2026-11-04 07:27:38 | 2026-11-04 07:28:27 |
| 13 | 2018-01-01 | 2026-11-04 07:28:27 | 2026-11-04 07:29:28 |
| 14 | 2019-01-01 | 2026-11-04 07:29:28 | 2026-11-04 07:30:17 |
| 15 | 2020-01-01 | 2026-11-04 07:30:17 | 2026-11-04 07:31:07 |
| 16 | 2021-01-01 | 2026-11-04 07:31:07 | 2026-11-04 07:31:56 |
| 17 | 2022-01-01 | 2026-11-04 07:31:56 | 2026-11-04 07:32:46 |
| 18 | 2023-01-01 | 2026-11-04 07:32:46 | 2026-11-04 07:33:35 |
| 19 | 2024-01-01 | 2026-11-04 07:33:35 | 2026-11-04 07:34:24 |
| 20 | 2025-01-01 | 2026-11-04 07:34:24 | 2026-11-04 07:35:26 |
| # | Anchor | Every S&P 500 member | A short list of twenty |
|---|---|---|---|
| 1 | 2006-01-01 | +5.9% | +6.8% |
| 2 | 2007-01-01 | -8.3% | -7.8% |
| 3 | 2008-01-01 | -0.9% | +4.7% |
| 4 | 2009-01-01 | +3.0% | -7.5% |
| 5 | 2010-01-01 | -1.0% | -3.5% |
| 6 | 2011-01-01 | -13.6% | -12.1% |
| 7 | 2012-01-01 | +8.1% | +17.6% |
| 8 | 2013-01-01 | +17.3% | +12.1% |
| 9 | 2014-01-01 | +4.4% | -4.7% |
| 10 | 2015-01-01 | +0.2% | -5.4% |
| 11 | 2016-01-01 | +5.8% | +0.0% |
| 12 | 2017-01-01 | +21.3% | +1.7% |
| 13 | 2018-01-01 | -6.5% | +3.5% |
| 14 | 2019-01-01 | +0.7% | -1.9% |
| 15 | 2020-01-01 | +3.9% | +6.2% |
| 16 | 2021-01-01 | +20.4% | +5.6% |
| 17 | 2022-01-01 | -8.7% | -17.9% |
| 18 | 2023-01-01 | +15.6% | +12.2% |
| 19 | 2024-01-01 | +3.5% | -0.2% |
| 20 | 2025-01-01 | +8.8% | +16.0% |
In cash, plus the five-day-low stop
Its hypothesis was first locked on 4 November 2026, before its first window was run that day.
The same hypothesis was registered again, unchanged, at each of its 20 windows:
“A COMPARATIVE study: Out under yesterday's low vs Out under the five-day low, walked on the same registered out-of-sample windows. Out under yesterday's low: S&P 500, every member of the index, unranked, bought when FI (length 2) crosses above 0; only when the close is above its 65-day average and the close's place in the range of the previous 1 sessions (0 at its low, 1 at its high, above 1 a breakout) is above 1; sell when the close's place in the range of the previous 1 sessions (0 at its low, 1 at its high, above 1 a breakout) is below 0, conditioned on the wired regime classifier, and forward-tested out-of-sample from the anchor: the rule set is frozen at the anchor, with no in-sample re-optimization. Out under the five-day low: S&P 500, every member of the index, unranked, bought when FI (length 2) crosses above 0; only when the close is above its 65-day average and the close's place in the range of the previous 1 sessions (0 at its low, 1 at its high, above 1 a breakout) is above 1; sell when the close's place in the range of the previous 5 sessions (0 at its low, 1 at its high, above 1 a breakout) is below 0, conditioned on the wired regime classifier, and forward-tested out-of-sample from the anchor: the rule set is frozen at the anchor, with no in-sample re-optimization. The arms differ in: Signal Module, config (exit · length: 1 → 5). The contrast under test: whether Out under yesterday's low generates better risk-adjusted returns than Out under the five-day low over the identical out-of-sample windows.”
| # | Anchor | Registered at (UTC) | Run completed (UTC) |
|---|---|---|---|
| 1 | 2006-01-01 | 2026-11-04 07:35:40 | 2026-11-04 07:36:42 |
| 2 | 2007-01-01 | 2026-11-04 07:36:42 | 2026-11-04 07:37:43 |
| 3 | 2008-01-01 | 2026-11-04 07:37:43 | 2026-11-04 07:38:45 |
| 4 | 2009-01-01 | 2026-11-04 07:38:45 | 2026-11-04 07:39:46 |
| 5 | 2010-01-01 | 2026-11-04 07:39:46 | 2026-11-04 07:41:00 |
| 6 | 2011-01-01 | 2026-11-04 07:41:00 | 2026-11-04 07:42:16 |
| 7 | 2012-01-01 | 2026-11-04 07:42:16 | 2026-11-04 07:43:30 |
| 8 | 2013-01-01 | 2026-11-04 07:43:30 | 2026-11-04 07:44:44 |
| 9 | 2014-01-01 | 2026-11-04 07:44:44 | 2026-11-04 07:45:57 |
| 10 | 2015-01-01 | 2026-11-04 07:45:57 | 2026-11-04 07:47:11 |
| 11 | 2016-01-01 | 2026-11-04 07:47:11 | 2026-11-04 07:48:32 |
| 12 | 2017-01-01 | 2026-11-04 07:48:33 | 2026-11-04 07:49:46 |
| 13 | 2018-01-01 | 2026-11-04 07:49:47 | 2026-11-04 07:51:00 |
| 14 | 2019-01-01 | 2026-11-04 07:51:00 | 2026-11-04 07:52:26 |
| 15 | 2020-01-01 | 2026-11-04 07:52:26 | 2026-11-04 07:53:39 |
| 16 | 2021-01-01 | 2026-11-04 07:53:40 | 2026-11-04 07:55:07 |
| 17 | 2022-01-01 | 2026-11-04 07:55:07 | 2026-11-04 07:56:33 |
| 18 | 2023-01-01 | 2026-11-04 07:56:34 | 2026-11-04 07:57:59 |
| 19 | 2024-01-01 | 2026-11-04 07:57:59 | 2026-11-04 07:59:25 |
| 20 | 2025-01-01 | 2026-11-04 07:59:25 | 2026-11-04 08:00:53 |
| # | Anchor | Out under yesterday's low | Out under the five-day low |
|---|---|---|---|
| 1 | 2006-01-01 | +5.9% | +8.8% |
| 2 | 2007-01-01 | -8.3% | -6.2% |
| 3 | 2008-01-01 | -0.9% | -2.3% |
| 4 | 2009-01-01 | +3.0% | +17.4% |
| 5 | 2010-01-01 | -1.0% | -6.5% |
| 6 | 2011-01-01 | -13.6% | -11.0% |
| 7 | 2012-01-01 | +8.1% | +12.9% |
| 8 | 2013-01-01 | +17.3% | +18.1% |
| 9 | 2014-01-01 | +4.4% | +6.5% |
| 10 | 2015-01-01 | +0.2% | +1.9% |
| 11 | 2016-01-01 | +5.8% | -1.1% |
| 12 | 2017-01-01 | +21.3% | +21.9% |
| 13 | 2018-01-01 | -6.5% | -2.3% |
| 14 | 2019-01-01 | +0.7% | +3.9% |
| 15 | 2020-01-01 | +3.9% | +6.8% |
| 16 | 2021-01-01 | +20.4% | +18.5% |
| 17 | 2022-01-01 | -8.7% | -11.4% |
| 18 | 2023-01-01 | +15.6% | +10.5% |
| 19 | 2024-01-01 | +3.5% | +5.4% |
| 20 | 2025-01-01 | +8.8% | +3.2% |