

High-Resolution Thematic Investing: Decomposing SEC Filings Into Words. Test Case: AI, the Pandemic, Remote Work and Tariffs. Talkers vs. Warners
We are close to completing a database that breaks down 20 years of SEC filings into their numbers, their words and the sections where the words appear. The aim is an open field where anyone can define a theme and test it. A computer program splits each report into its sections and counts its numbers and words, with fixed rules. No AI model reads the reports. This paper is the first test of the words: ten years of annual reports and four themes.
In an annual report, one section, Item 1A, Risk Factors, is where a company must list the risks to its business. So for any theme there are three kinds of company. Talkers mention the theme outside the risk factors, where they describe their business and results. Warners mention it inside the risk factors. The silent do not mention it at all. Talkers and warners are often the same companies: in 2025, 273 of the 292 S&P 500 companies that talked about AI also warned about it.
On 1 April of each year from 2016 to 2025, we made the three lists for AI, tariffs, the pandemic and remote work, using only the reports filed before that day. We bought each list with the same amount of money in each company, held it for one year, and compared it with all S&P 500 companies held the same way (the equal-weight S&P 500) and with SPY. That makes twelve tests, and we report all of them. We chose the four best-known themes of the last decade on purpose, to show what the counts can do with words everyone knows; the full study will use thresholds to find themes as they rise in the reports.
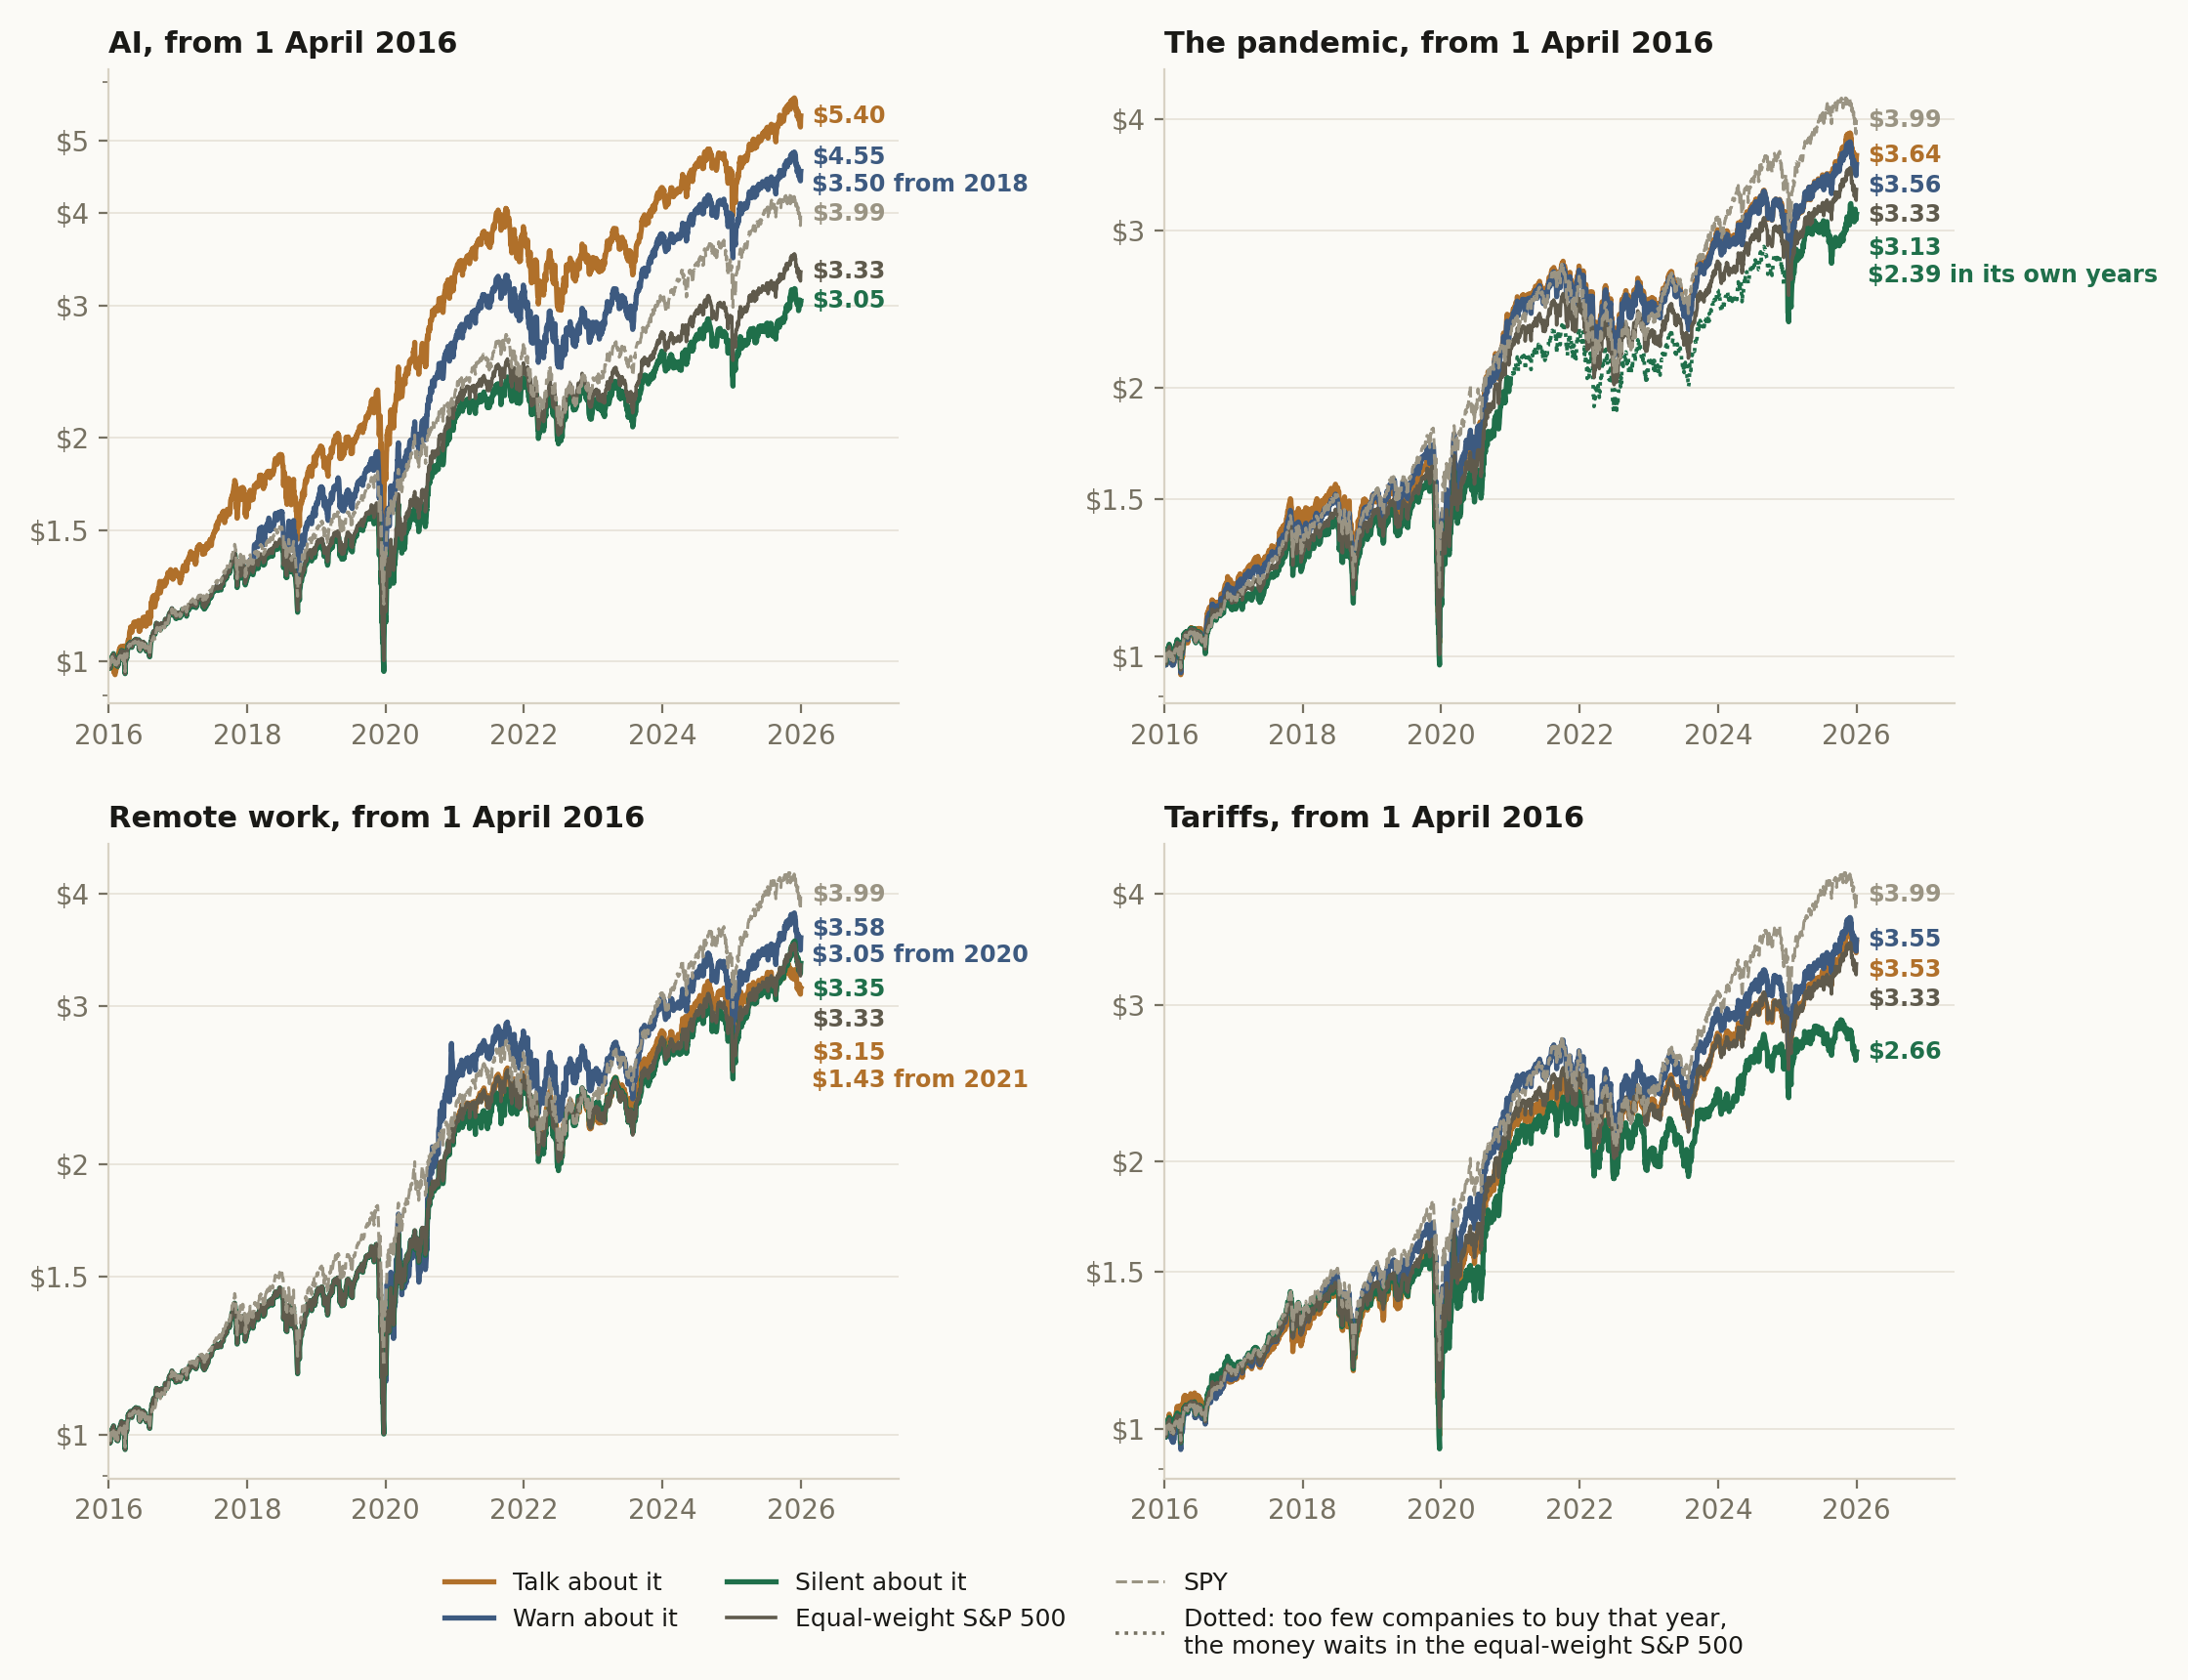
If the trend is your friend, the talkers should beat the market. If a warning in the risk factors means fear, the warners should lag. The AI talkers turned $1 into $5.40, against $3.99 for SPY. The AI warners also beat SPY from 2018, the first year there were enough of them to buy. The companies that did not mention AI did worse than the equal-weight S&P 500 in 9 of 10 years. For tariffs, the silent companies did worst. On 1 April 2025, the day before the US announced its new tariffs, 59 companies had not mentioned tariffs in their latest report. In the next twelve months they gained 0.3%, while the equal-weight S&P 500 gained 15.7%. For the pandemic, the talkers and the warners did a little better than the equal-weight S&P 500. Remote work was a short theme, and the companies still talking about it in 2025 were 10 points behind that year.
Three notes. Only three lists beat SPY over their years: the two AI lists, and the remote-work warners because of one very good year. All of the AI lists' lead over SPY came before April 2021, and from then SPY did better than all twelve lists. And a theme also picks industries: in 2025, most companies that did not mention AI were in materials, energy, utilities, property or industry. So these tests measure words and industries together.
Talkers, warners and the silent
Every listed US company files an annual report, the 10-K, each year. It has fixed parts. Item 1 describes the business. Item 1A, Risk Factors, lists what could hurt the company. Item 7 discusses the year's results. For any theme, the report puts each company in one of three groups.
Talkers mention the theme outside Item 1A: in the business description, in the discussion of results, or anywhere else except the risk factors. For a talker, the theme is part of what it sells, makes, buys or plans.
Warners mention the theme inside Item 1A. For a warner, the theme is a risk: a higher cost, a new competitor, a new law.
The silent do not mention the theme anywhere in the report.
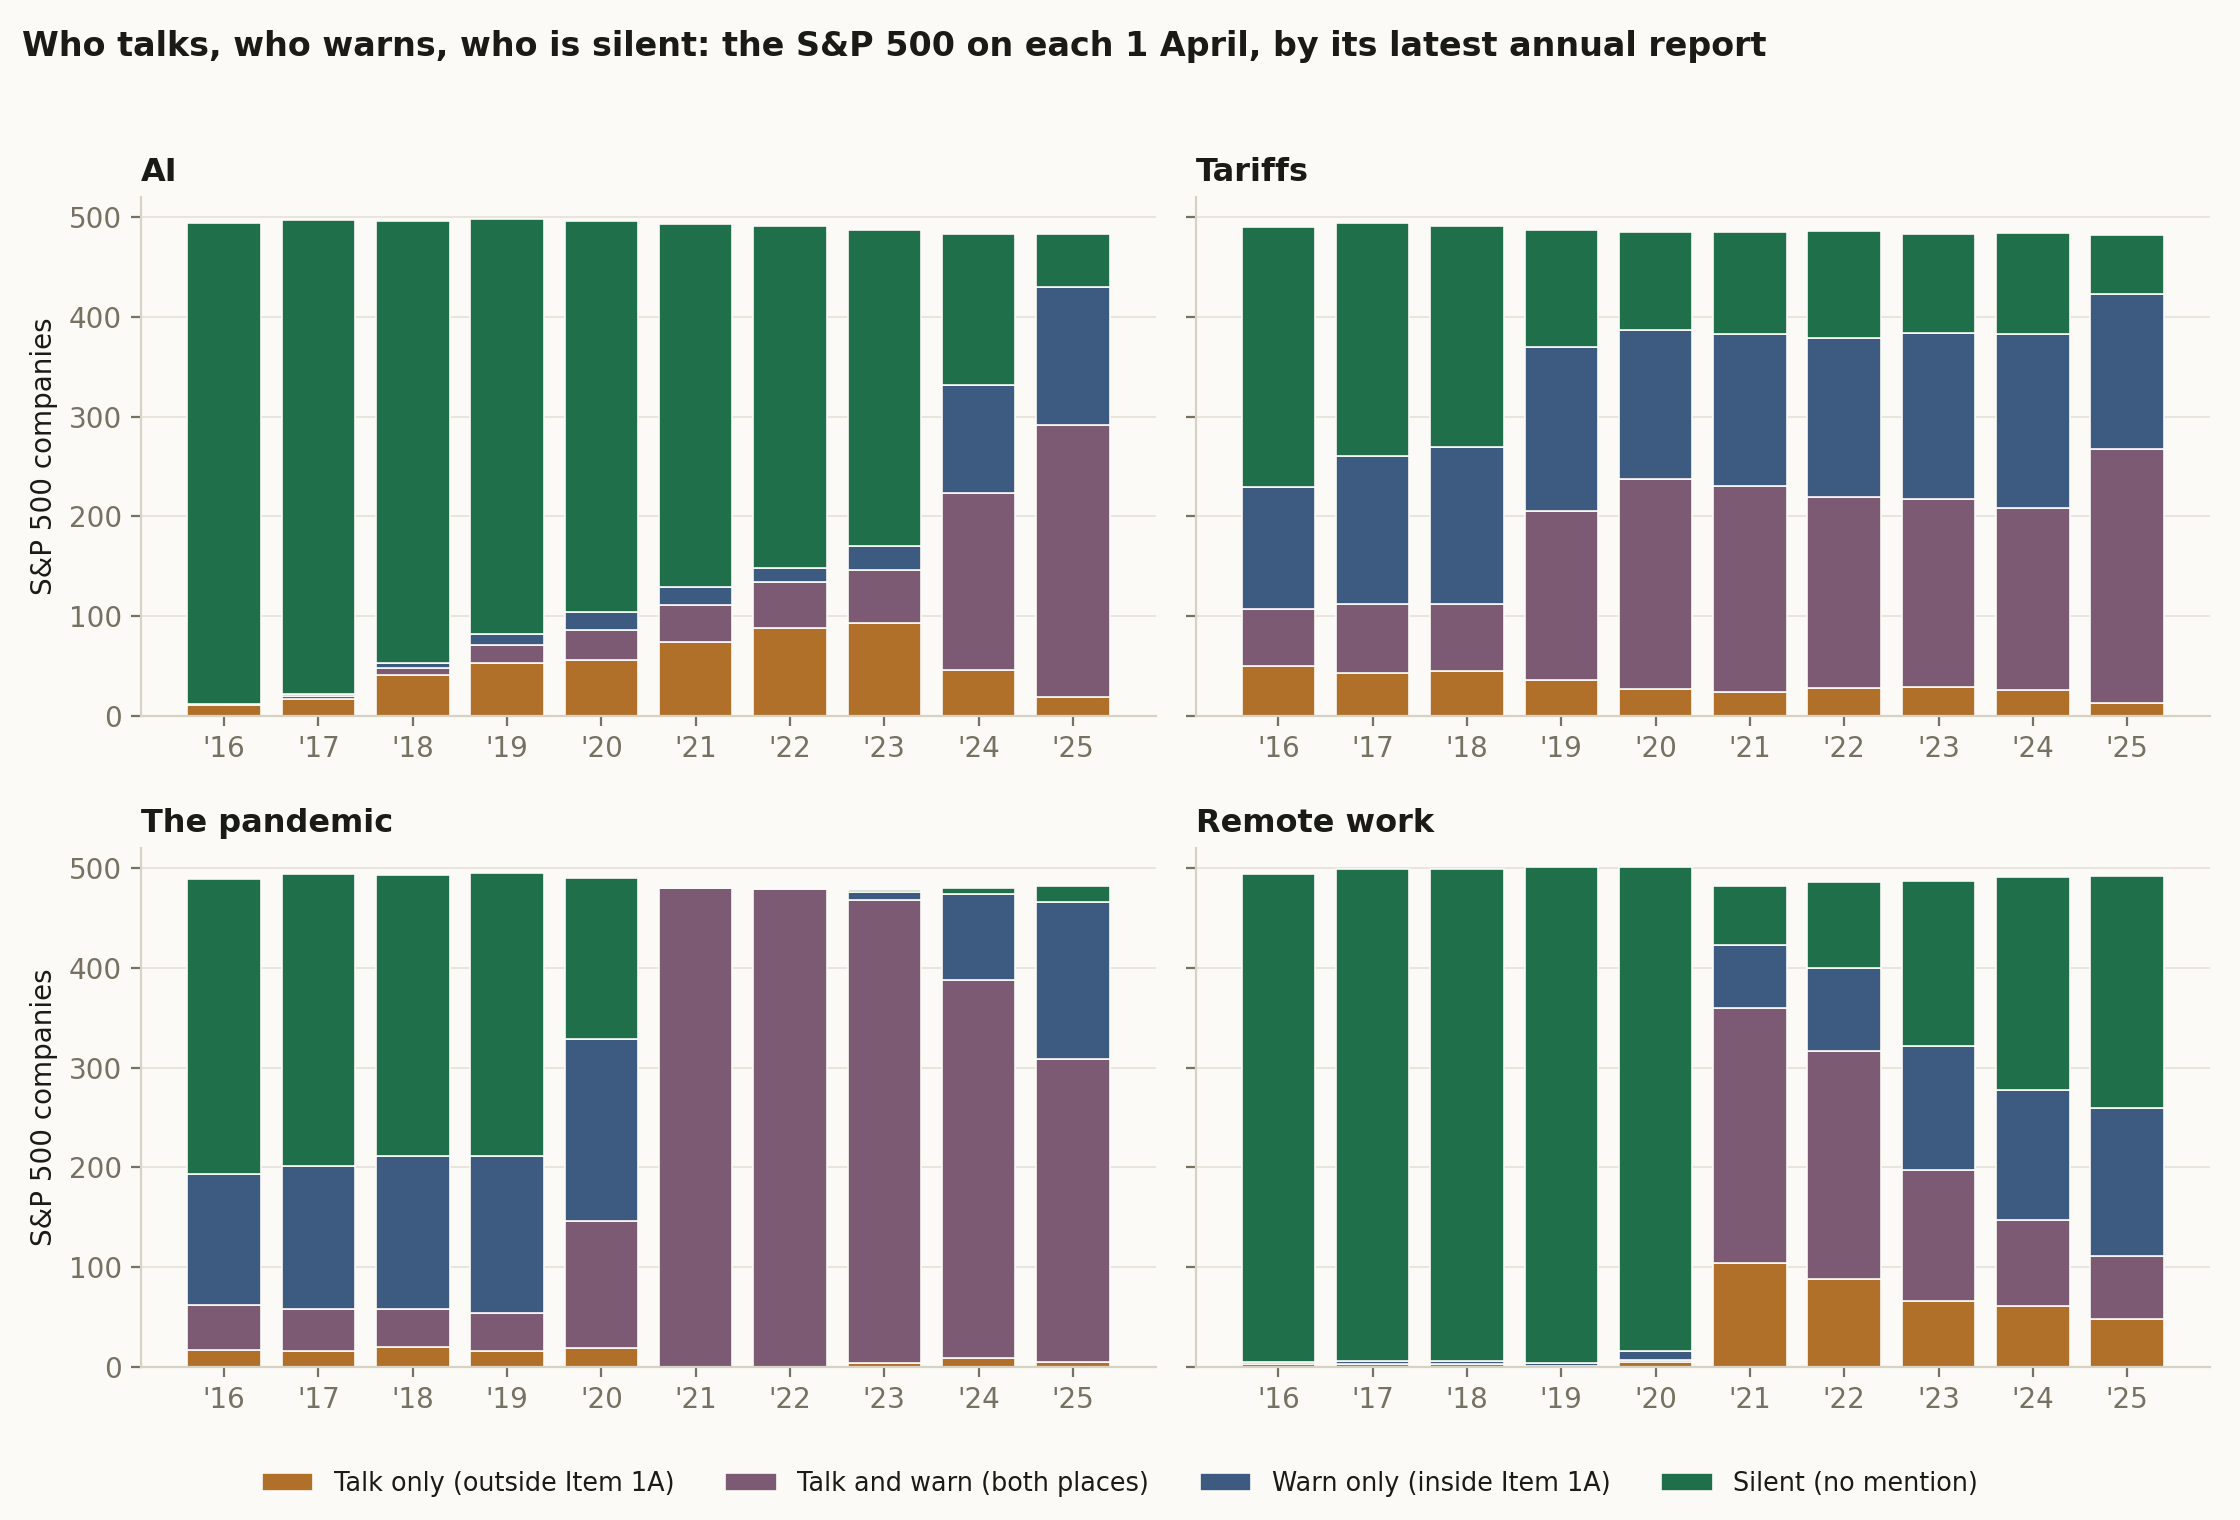
A company that mentions a theme in both places is a talker and a warner at once, and for a theme that matters to a company this is the usual case. In 2025, 273 of the 292 S&P 500 companies that talked about AI also warned about it. NVIDIA wrote about AI more than any other company in nine of the ten years, and in three of them it also had the most AI in its risk factors. So for AI, a warning in the risk factors usually comes from a company that is deep inside the theme.
The overlap is different for each theme (Figure 2). For AI, the companies that both talk and warn grew from one in 2016 to more than half of the index in 2025. For the pandemic, almost every company talked and warned in 2021 and 2022. Remote work went the other way: in 2021 most companies that mentioned it talked about it, and by 2025 most of them only warned, while almost half of the index was silent again. Table 1 names the companies on each list in April 2025.
From a filing to a portfolio
Figure 3 shows how a filing becomes a portfolio. A computer program reads every original annual report that the largest US companies filed from January 2015 to early October 2026: the SEC's large accelerated filers, about 2,000 companies a year with $700 million or more in shares held by outside investors, 24,132 reports in all. The S&P 500 companies are among them; the tests use the S&P 500, and the shares of reports quoted below use all of the large companies. The program finds the sections, and for each of 24 themes it counts the theme's words in the whole report and inside Item 1A. Each theme is a fixed list of words, written before anything was counted. No AI model reads the reports, and the word lists are published with the card. On any date, each S&P 500 company is placed by its latest report filed before that day, so a test only uses what was public at the time.
"The trend is your friend" is an old market rule. Before testing it, a quant has to say what a trend is. With the counts, a theme becomes three numbers for every company and every year: whether the company mentions it, where it mentions it (outside or inside the risk factors), and how often (mentions per 10,000 words). These numbers show that themes rise and fade in different ways. AI spread slowly for eight years, and in 2024 the share of AI-mentioning reports that put it in the risk factors went from about half to 85%. The pandemic was a standard risk line, became universal in 2021, and is now moving back into the risk factors only. Remote work rose and fell within five years. Of the 24 themes, Y2K appears in no report, and regulation was already in almost every risk factors section in 2015. The other 22 all moved toward the risk factors (Figure 4), partly because the risk factors section grew by about 60% in words while the whole report grew by 11%.
A word can also change its meaning. Written in capitals, AI can mean avian influenza in a food company's report, or Autopart International in a car parts company's report; for AI we use a stricter count that checks how each report defines the letters. We added that check after the first counts showed the false hits, before any test ran, and it applies to every year. Tariff means a tax on imported goods, but for a utility, a pipeline or a railroad it is also the price list a regulator approves. Our count includes both meanings: about a quarter of the 2016 tariff talkers were utilities and pipelines, and about one in six in 2025.
We chose AI, tariffs, the pandemic and remote work on purpose. They are the best-known themes of the last decade, and everyone knew they mattered; this paper does not claim to have found them. It shows what the counts can do with words the whole world knows. The full study will not start from famous words: it will use thresholds to find themes as they rise in the reports.
This paper also uses the simplest rules on purpose: one theme, one place in the report, one date a year. The database we are completing goes much further. It covers 20 years of filings, and it will let you build a theme from your own words and groups of words and set your own thresholds: buy a company when its mentions of a theme pass a level, sell it when the theme moves into its risk factors.
The tests here start in April 2016 because the reports in this test start in January 2015: on 1 April 2015, one company in five had not yet filed a report in the data, because its business year does not end in December. Apple, Microsoft and Cisco are examples. Each list is compared with all S&P 500 companies held the same way, with the same amount of money in each company: the equal-weight S&P 500. SPY, which holds the companies by their size, is shown beside it.
AI
A company talks about AI when it sells AI or builds it into its products. In April 2016 only 12 S&P 500 companies mentioned AI outside the risk factors, most of them technology companies: NVIDIA, Microsoft, Meta, Salesforce, Qualcomm and Cisco among them. By 2025 there were 292 talkers, from every industry.
A company warns about AI when a competitor could use it better, when a new law could limit it, or when its own use of AI could go wrong. Until 2023 the warners were a small part of the index, among them Microsoft, Adobe and Mastercard, though already 77 of the 170 S&P 500 companies that mentioned AI at all. In 2024 almost every company that mentioned AI added it to its risk factors, and in 2025 there were 411 warners.
A company stays silent about AI when it has nothing to say about it. In April 2025 only 53 S&P 500 companies did not mention AI in their latest report. Most of them made chemicals, steel or fertilizer, produced oil and gas, ran utilities, owned buildings or ran industrial businesses: ExxonMobil, Nucor, Albemarle, Delta Air Lines and Berkshire Hathaway, for example.
The results (Figure 6, Table 2). $1 put in the talkers on 1 April 2016 became $5.40 by April 2026. In SPY it became $3.99, and in the equal-weight S&P 500 $3.33. The talkers beat the equal-weight S&P 500 in 8 of 10 years, most strongly in the first four years, when few companies used the word. One company carried the first year: in the year from April 2016, NVIDIA gained about 205% and made more than half of the talkers' 31% return, while the other ten talkers gained about 14%, a little less than the equal-weight S&P 500's 16%. In 2017 NVIDIA led again, and the other talkers were ahead too. The warners could be bought from 2018, the first year there were ten of them. From then they beat the equal-weight S&P 500 in 6 of 8 years, and their $1 became $3.50, against $3.01 for SPY. The silent were behind the equal-weight S&P 500 in 9 of 10 years; their $1 became $3.05.
All of the AI lists' lead over SPY came before April 2021. From April 2021 to April 2026, $1 in SPY became $1.75, in the warners $1.70 and in the talkers $1.64.
Tariffs
Tariffs are taxes on imported goods. A company talks about them outside the risk factors when they are part of how it competes. Nucor makes steel, and tariffs protect it from imported steel. Whirlpool asked the US government for tariffs on imported washing machines in 2017. Brown-Forman, the maker of Jack Daniel's, wrote about the tariffs Europe put on American whiskey from 2018. Nike and Harley-Davidson wrote about what tariffs cost them. Utilities, pipelines and railroads use the word's second meaning, their regulated price lists.
A company warns about tariffs when they could raise the cost of what it imports, or close a market where it sells. The warners are importers and exporters: retailers that buy from Asia, such as Gap, Ross Stores, Macy's, Hasbro and Dollar Tree; manufacturers whose parts cross borders, such as Eaton, Amphenol, Dover and Hubbell; chip and solar companies, such as Teradyne, Microchip and First Solar.
A company stays silent about tariffs when it sells services, and services pay no tariffs. The silent are banks, insurers, landlords, cruise lines, casinos, health insurers and software companies. In April 2025 they included Wells Fargo, State Street, Mastercard, Marriott, Carnival, Las Vegas Sands and Palantir.
The results (Table 3). The talkers and the warners did about the same: each was ahead of the equal-weight S&P 500 by a point a year or less, in 6 of 10 years. The silent did worst. They were behind in 6 of 10 years, and their $1 became $2.66, against $3.53 for the talkers and $3.55 for the warners.
Most of that difference came in one year. On 1 April 2025, the day before the US announced its new tariffs, 59 S&P 500 companies had not mentioned tariffs anywhere in their latest annual report. In the next twelve months they gained 0.3%. The equal-weight S&P 500 gained 15.7%, and SPY 18.1%. In the other nine years the silent were behind by less than a point a year on average, and ahead in 4 of them.
The pandemic and remote work
Before 2020, about 30% of the large companies' reports mentioned a pandemic, almost always inside the risk factors, as one disaster among many. The talkers were companies for which disease is part of the business: drug and vaccine makers such as Merck and Gilead, Zoetis, which makes vaccines for animals, the insurer Hartford, and the travel company Booking. Most companies were silent.
In April 2020, the filing date mattered. The biggest talkers were retailers whose business year ends around 1 February. They filed their reports in late March 2020, while their stores were closing: Ross Stores, TJX, Macy's and Home Depot. Carnival, the cruise company, filed its report on 28 January 2020 without one pandemic word. About a week later, one of its ships, the Diamond Princess, was put in quarantine in Yokohama. From 2021 almost every report mentioned the pandemic, so for four years there were too few silent companies to buy.
Results: the pandemic talkers and warners were each about a point a year ahead of the equal-weight S&P 500, in 6 and 7 of 10 years. The silent were behind in 4 of the 6 years they could be bought, mostly in the year from April 2020.
Remote work rose fast and then faded. Before 2020 it was in about 2% of the large companies' reports. In 2021 it was in 87%, and in 2026 in fewer than half. 2021 was also the first year of an SEC rule that asks companies to describe their workforce in Item 1, and many used it to say how their own staff now worked. The biggest talkers included Jack Henry, HP, Cisco and Microsoft. The warners put remote work in their risk factors: the office landlord Vornado already in 2020, the advertising group Omnicom every year from 2021. In 2021, when almost every report mentioned remote work, the silent were mostly companies whose work cannot be done from home, such as the oil producers Occidental and EOG, the supermarket chain Kroger and the grain trader Archer-Daniels-Midland.
Results: the remote-work talkers were ahead of the equal-weight S&P 500 in 3 of their first 4 years. In the year from April 2025, when 111 companies still talked about it, they were 10 points behind. The warners' average lead comes from one year: in 2020, 11 companies that already warned about remote work, mostly retailers and landlords, gained 23 points more than the equal-weight S&P 500. In 4 of the next 5 years they were behind.
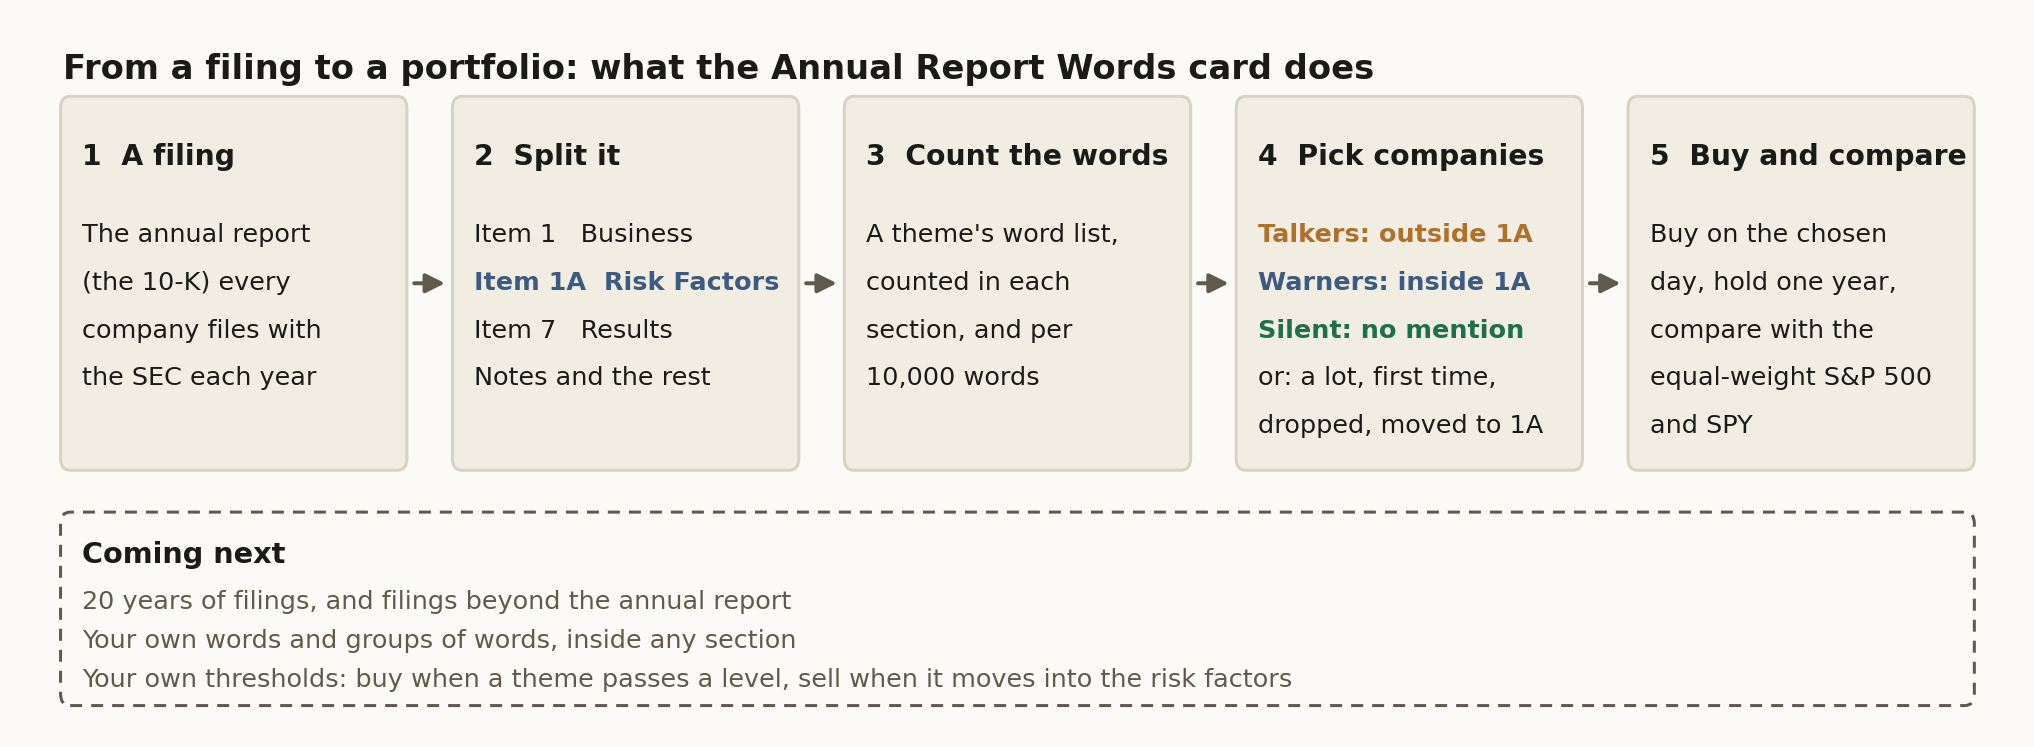
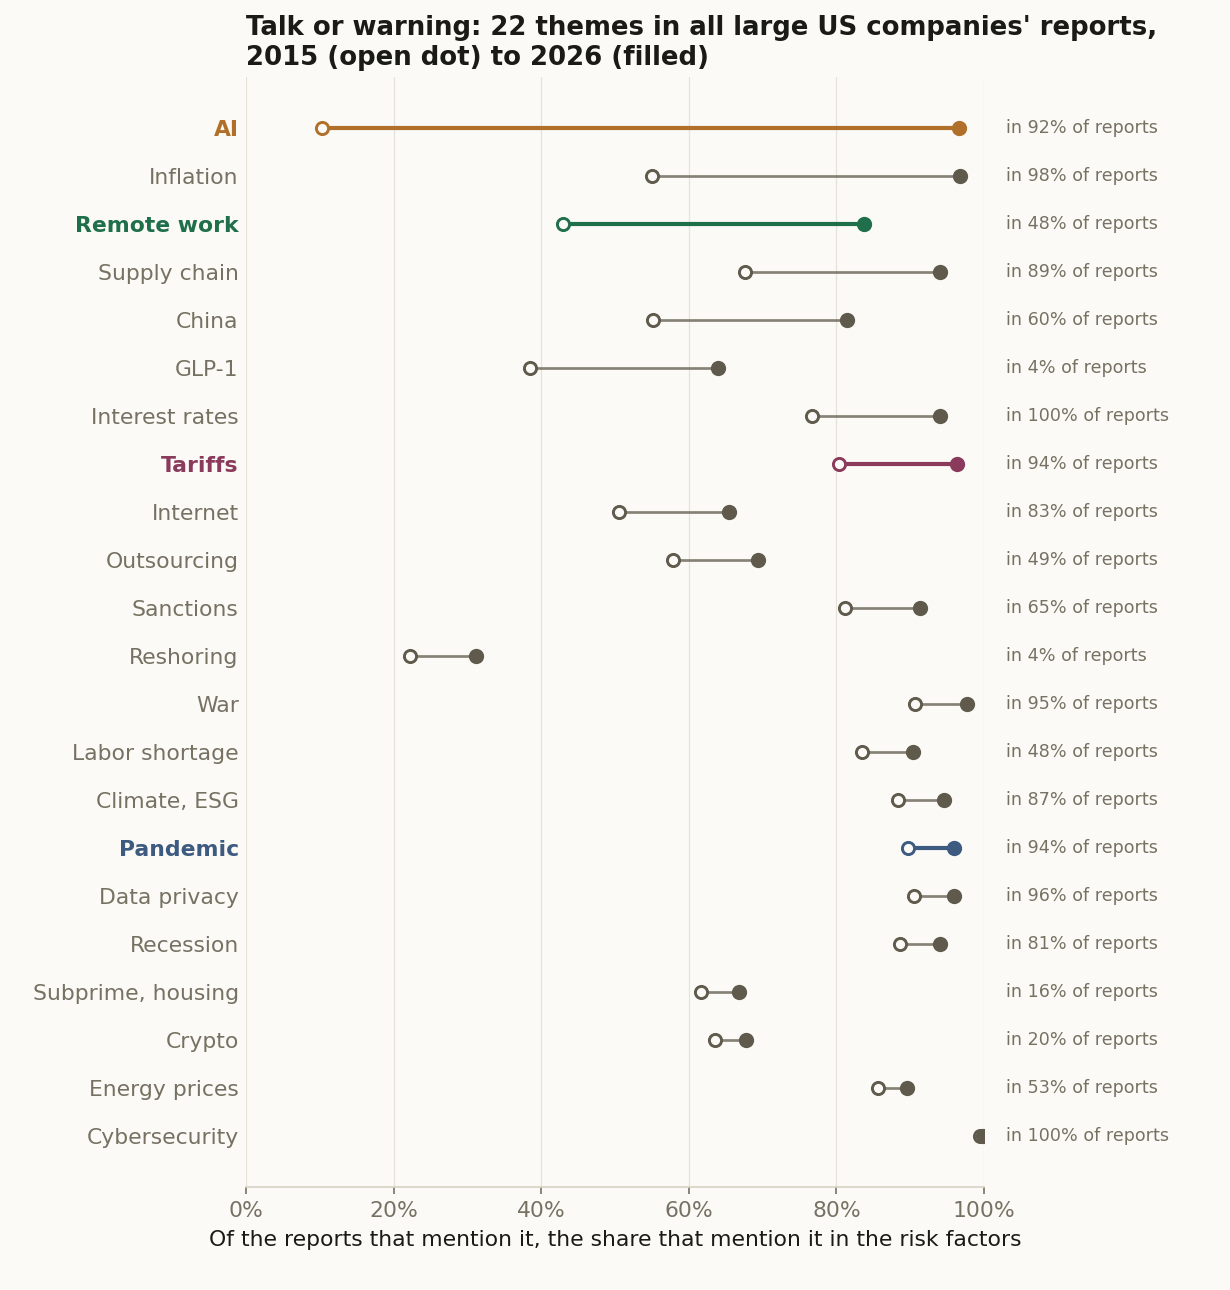
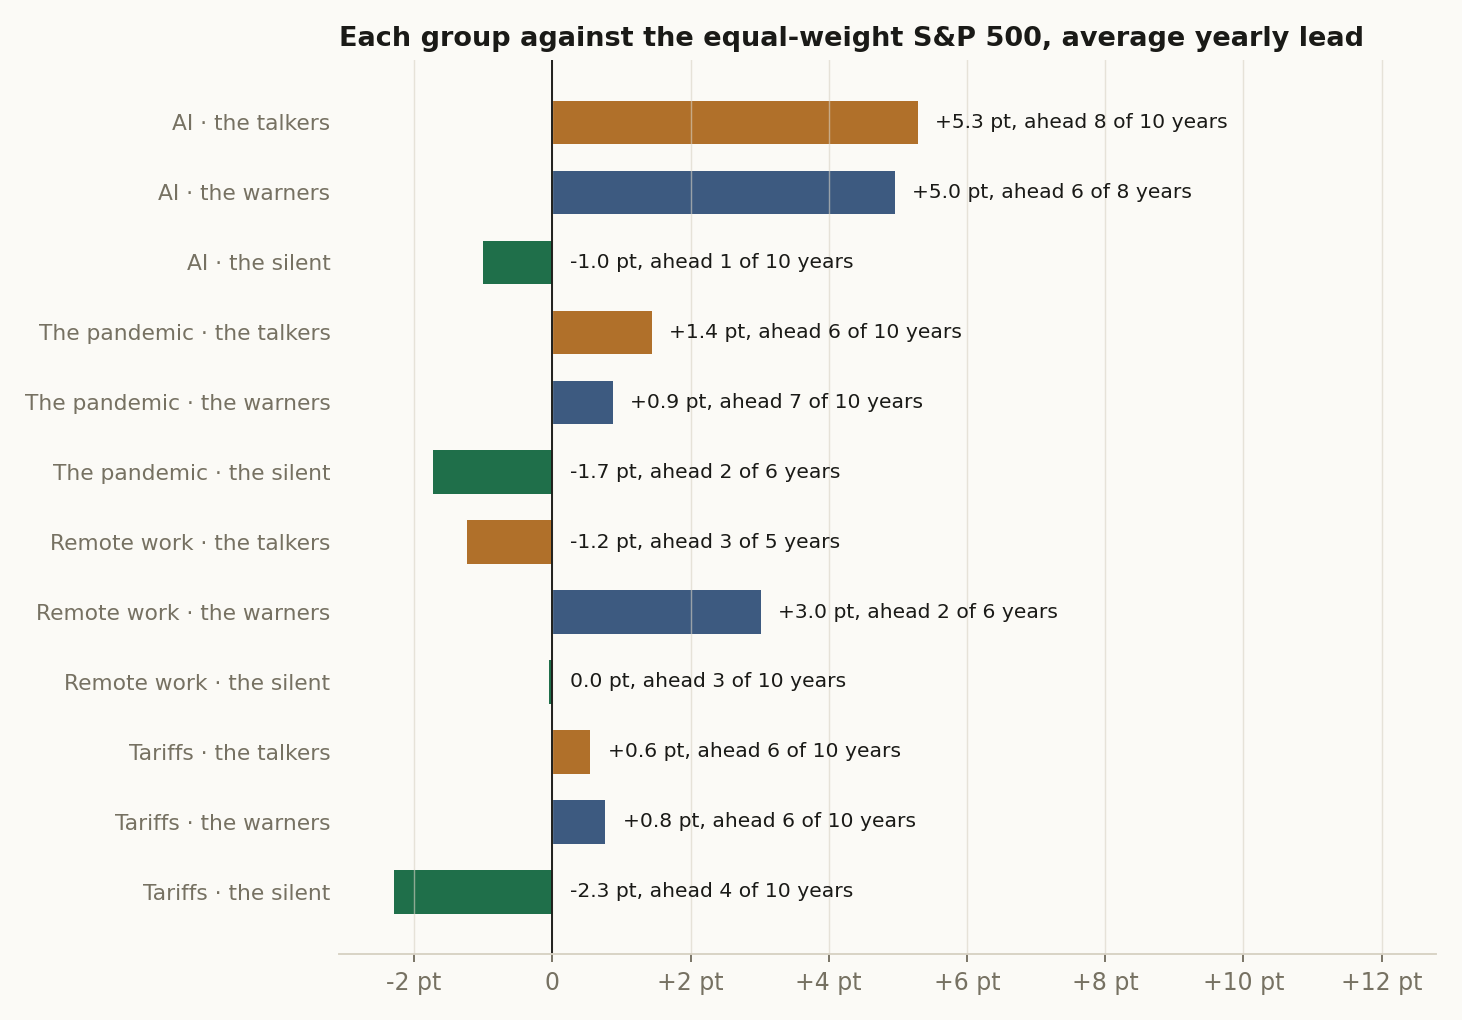
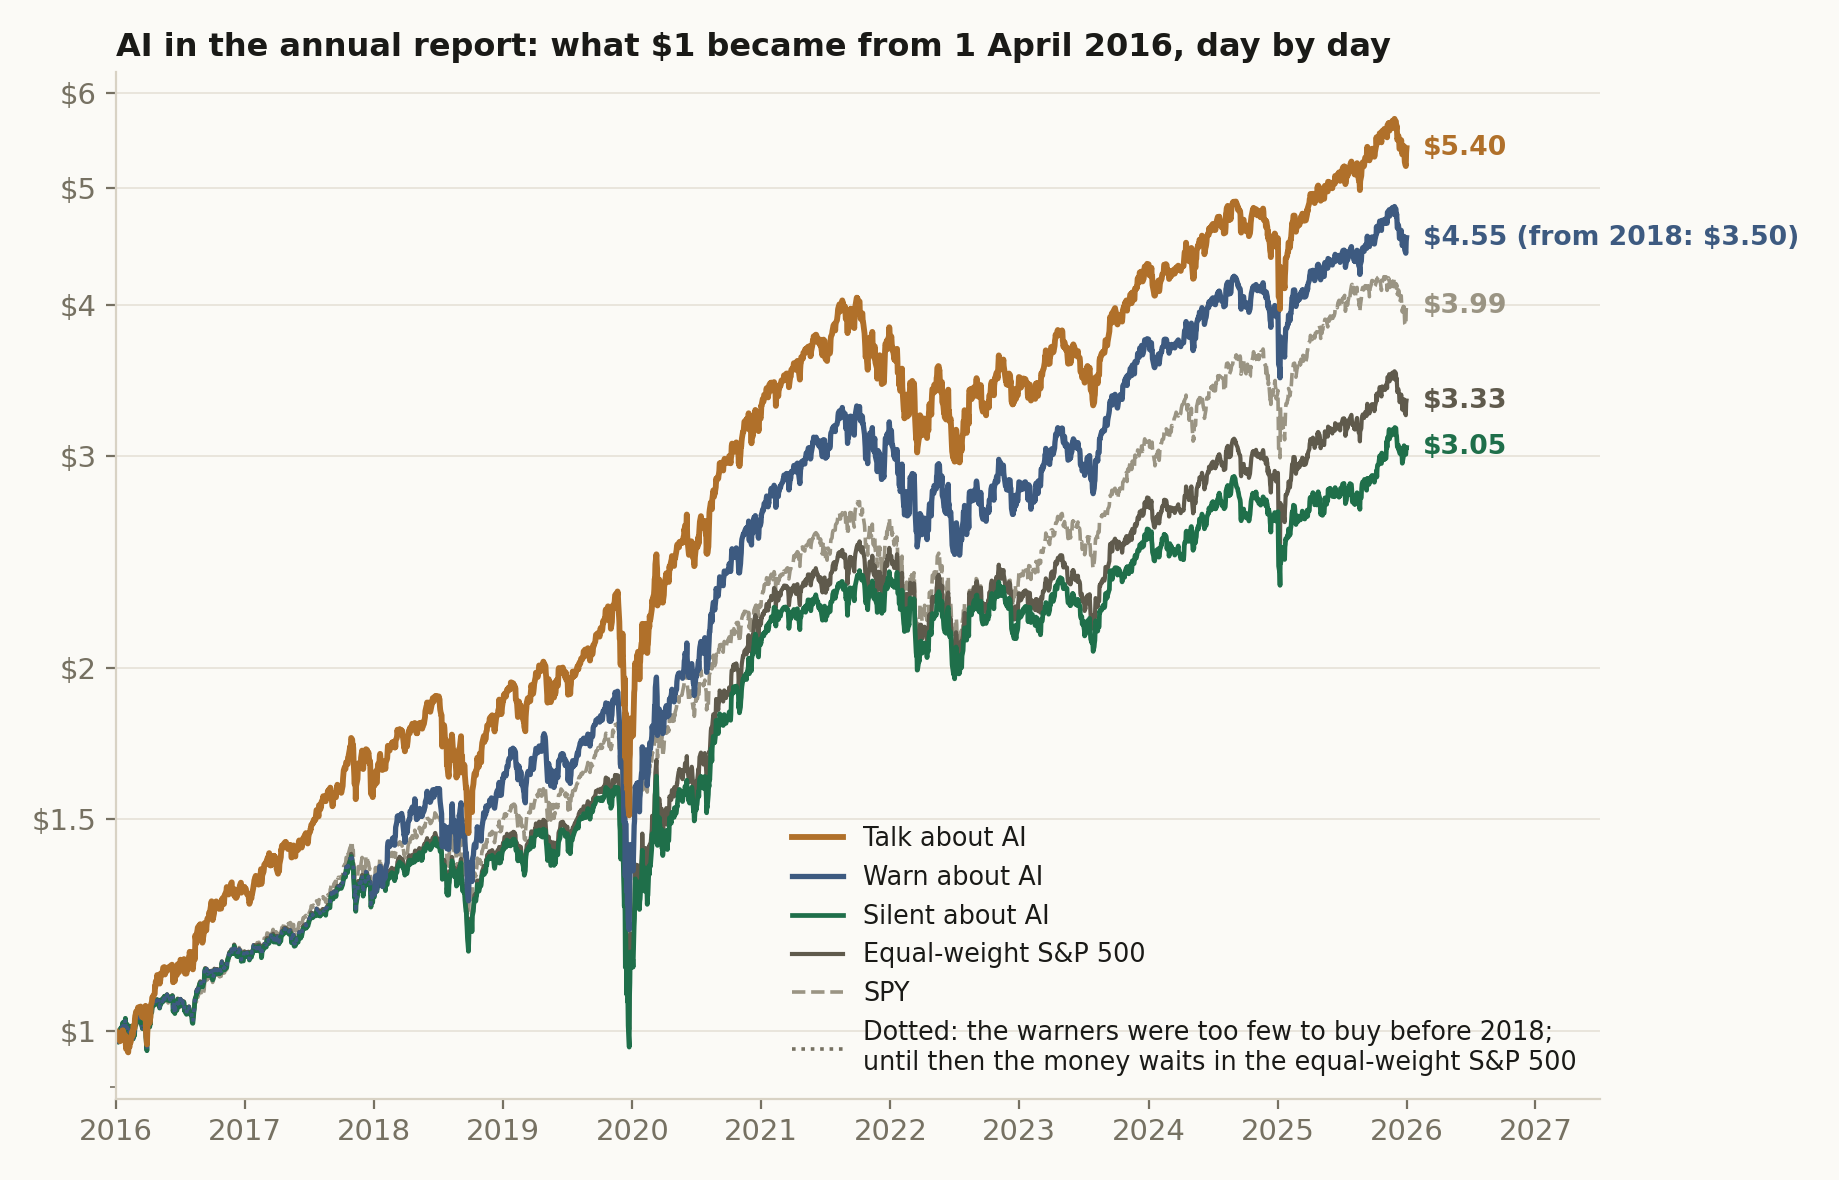
Table 1. Who was on each list on 1 April 2025, from each company's latest annual report filed before that day. For the talkers and the warners, the companies that used the theme's words most often; for the silent, well-known names. Remote work's silent list was half the index again by then.
| Theme | List | Companies | Among them |
|---|---|---|---|
| AI | Talkers | 292 | NVIDIA, AMD, Microsoft, Alphabet |
| AI | Warners | 411 | NVIDIA, Ecolab, Alphabet, AMD |
| AI | Silent | 53 | ExxonMobil, Berkshire Hathaway, Nucor, Delta Air Lines |
| Tariffs | Talkers | 268 | FirstEnergy, Southern Co. (price lists), Expeditors, Nucor |
| Tariffs | Warners | 410 | Hubbell, Nucor, Teradyne, First Solar |
| Tariffs | Silent | 59 | Wells Fargo, Mastercard, Marriott, Carnival |
| The pandemic | Talkers | 309 | Moderna, Pfizer, Hologic, Southwest Airlines |
| The pandemic | Warners | 461 | Quest Diagnostics, Wabtec, Texas Instruments, Dow |
| The pandemic | Silent | 16 | Dell, Royal Caribbean, Wells Fargo, Williams-Sonoma |
| Remote work | Talkers | 111 | Arista Networks, HP, Jack Henry, IBM |
| Remote work | Warners | 211 | Intuit, Ralph Lauren, KeyCorp, CSX |
| Remote work | Silent | 232 | Apple, Amazon, Caterpillar, Applied Materials |
1 Methodology, in detail (click to open)
1 Methodology
Universe. The S&P 500 as its members stood on each 1 April, from 2016 to 2025.
The reports. Every original annual report (the 10-K) filed with the SEC, read once by a program for 24 themes. Each theme is a fixed list of words, written before anything was counted. For each report the program counts the theme in the whole report and inside Item 1A, the risk factors. For AI the count comes from a stricter table that checks how each report defines the letters, for every report it covers (the large accelerated filers from 2015). On each 1 April a company is placed by its latest annual report filed before that day and no more than 460 days old. Each company is matched to the registrant that filed its reports, month by month.
The lists. For each theme, the talkers are the companies whose latest report mentions it outside the risk factors, the warners the ones that mention it inside them, and the silent the ones that do not mention it anywhere. A company can be a talker and a warner in the same year. On the platform's Annual Report Words card these are Where in the report: Outside the risk factors, Inside the risk factors or Anywhere in the report, with Keep the companies that: Uses it, or Does not use it.
The yardstick. The equal-weight S&P 500: every member whose latest report could be read (461 to 498 companies), bought with the same amount of money in each company and held the same way. On the card this is the yardstick rule. SPY is shown beside it.
The portfolios. Each list is bought with the same amount of money in each company at the close on 1 April and held for one year, on the platform's Held Forward Test. Returns include dividends, SPY's too. Every buy and every sell pays 0.1%. A company that stops trading is sold at its last close. A list with fewer than ten companies is not bought that year, and the year is recorded.
The test. Ten one-year holds, from 1 April 2016 to 1 April 2026. Twelve comparisons, each list against the equal-weight S&P 500, all reported as one family. Each comparison had its settings locked before its first year ran and has its own record, listed in the family table; the appendix of this page shows the first one, the AI talkers. The two AI comparisons of talk and warning ran first. We chose the other three themes and added the silent lists the same day, after seeing those two results, and those ten ran after them.
2 Results
2.1 Headline
Table 2. AI, each year from 1 April to the next 1 April: the return of each list, of the equal-weight S&P 500 and of SPY, and how many companies each list held. Dividends included; 0.1% paid on every buy and every sell. The warners had fewer than ten companies in 2016 and 2017, so they were not bought in those years.
| Year | Talk about AI | Warn about AI | Silent about AI | Equal-weight S&P 500 | Holding SPY | Talkers held | Warners held | Silent held |
|---|---|---|---|---|---|---|---|---|
| 2016 | +31.4% | too few | +15.9% | +16.2% | +16.3% | 11 | 1 | 450 |
| 2017 | +21.8% | too few | +11.7% | +11.9% | +13.9% | 19 | 5 | 452 |
| 2018 | +17.6% | +24.9% | +9.5% | +10.2% | +13.2% | 46 | 11 | 430 |
| 2019 | −6.2% | −15.8% | −19.9% | −18.2% | −8.0% | 71 | 28 | 408 |
| 2020 | +87.2% | +96.0% | +86.4% | +87.8% | +65.4% | 86 | 47 | 389 |
| 2021 | +13.4% | +16.3% | +12.1% | +12.5% | +14.6% | 111 | 54 | 361 |
| 2022 | −6.9% | −8.4% | −6.0% | −6.8% | −8.1% | 134 | 60 | 340 |
| 2023 | +24.1% | +31.4% | +17.1% | +20.1% | +29.1% | 146 | 77 | 317 |
| 2024 | +4.1% | +5.2% | +2.5% | +4.0% | +8.8% | 223 | 286 | 151 |
| 2025 | +19.8% | +15.2% | +14.0% | +15.7% | +18.1% | 292 | 411 | 53 |
Table 3. All twelve tests, each list against the equal-weight S&P 500. Years: the years the list had ten companies or more and was bought. Ahead: in how many of those years it beat the equal-weight S&P 500. Lead a year: its average yearly return minus the equal-weight S&P 500's, in percentage points. $1 became: over the list's own years, next to the equal-weight S&P 500 and SPY over the same years. Dividends included; 0.1% paid on every buy and every sell.
| Theme | List | Years | Ahead | Lead a year | $1 became | Equal-weight S&P 500 | Holding SPY |
|---|---|---|---|---|---|---|---|
| AI | Talkers | 2016 to 2025 | 8 of 10 | +5.3 pts | $5.40 | $3.33 | $3.99 |
| AI | Warners | 2018 to 2025 | 6 of 8 | +5.0 pts | $3.50 | $2.56 | $3.01 |
| AI | Silent | 2016 to 2025 | 1 of 10 | −1.0 pts | $3.05 | $3.33 | $3.99 |
| Tariffs | Talkers | 2016 to 2025 | 6 of 10 | +0.6 pts | $3.53 | $3.33 | $3.99 |
| Tariffs | Warners | 2016 to 2025 | 6 of 10 | +0.8 pts | $3.55 | $3.33 | $3.99 |
| Tariffs | Silent | 2016 to 2025 | 4 of 10 | −2.3 pts | $2.66 | $3.33 | $3.99 |
| The pandemic | Talkers | 2016 to 2025 | 6 of 10 | +1.4 pts | $3.64 | $3.33 | $3.99 |
| The pandemic | Warners | 2016 to 2025 | 7 of 10 | +0.9 pts | $3.56 | $3.33 | $3.99 |
| The pandemic | Silent | 2016 to 2020, 2025 | 2 of 6 | −1.7 pts | $2.39 | $2.55 | $2.70 |
| Remote work | Talkers | 2021 to 2025 | 3 of 5 | −1.2 pts | $1.43 | $1.51 | $1.75 |
| Remote work | Warners | 2020 to 2025 | 2 of 6 | +3.0 pts | $3.05 | $2.84 | $2.89 |
| Remote work | Silent | 2016 to 2025 | 3 of 10 | 0.0 pts | $3.35 | $3.33 | $3.99 |
Sections 2.2 to 3, the full record: every year, every test, and how each one was run (click to open)
The registration names the two groups compared Talk about AI and Every company read; this paper calls them Talk about AI and Equal-weight S&P 500.
2.2 Per-step results
| # | Out-of-sample window | Talk about AI SR | Equal-weight S&P 500 SR |
|---|---|---|---|
| 1 | 2016-04-01 → 2017-03-31 | 1.94 | 1.35 |
| 2 | 2017-04-03 → 2018-03-29 | 1.35 | 1.11 |
| 3 | 2018-04-02 → 2019-04-01 | 0.97 | 0.77 |
| 4 | 2019-04-01 → 2020-03-31 | -0.03 | -0.50 |
| 5 | 2020-04-01 → 2021-04-01 | 2.70 | 2.55 |
| 6 | 2021-04-01 → 2022-04-01 | 0.82 | 0.89 |
| 7 | 2022-04-01 → 2023-03-31 | -0.17 | -0.20 |
| 8 | 2023-04-03 → 2024-03-28 | 1.72 | 1.58 |
| 9 | 2024-04-01 → 2025-04-01 | 0.38 | 0.39 |
| 10 | 2025-04-01 → 2026-04-01 | 1.08 | 0.93 |
2.2b Every test, in numbers
Every test this paper registered, two rows each, the paper’s own test first.
| Walk | Windows | Span | Growth | CAGR | Worst drawdown | Pooled Sharpe |
|---|---|---|---|---|---|---|
| talking AI · Talk about AI (this paper, the one the lab opens) | 10 | 2016-04-01 → 2026-04-01 | +439.9% | +18.4% | -34.8% | 0.95 |
| talking AI · Equal-weight S&P 500 (this paper, the one the lab opens) | 10 | 2016-04-01 → 2026-04-01 | +233.4% | +12.8% | -38.5% | 0.76 |
| warning AI · Warn about AI | 8 | 2018-04-02 → 2026-04-01 | +249.9% | +17.0% | -36.6% | 0.84 |
| warning AI · Equal-weight S&P 500 | 10 | 2016-04-01 → 2026-04-01 | +233.4% | +12.8% | -38.5% | 0.76 |
| silent AI · Silent about AI | 10 | 2016-04-01 → 2026-04-01 | +204.9% | +11.8% | -39.1% | 0.71 |
| silent AI · Equal-weight S&P 500 | 10 | 2016-04-01 → 2026-04-01 | +233.4% | +12.8% | -38.5% | 0.76 |
| talking the pandemic · Talk about the pandemic | 10 | 2016-04-01 → 2026-04-01 | +264.0% | +13.8% | -37.8% | 0.79 |
| talking the pandemic · Equal-weight S&P 500 | 10 | 2016-04-01 → 2026-04-01 | +233.4% | +12.8% | -38.5% | 0.76 |
| warning the pandemic · Warn about the pandemic | 10 | 2016-04-01 → 2026-04-01 | +255.6% | +13.5% | -39.1% | 0.78 |
| warning the pandemic · Equal-weight S&P 500 | 10 | 2016-04-01 → 2026-04-01 | +233.4% | +12.8% | -38.5% | 0.76 |
| silent the pandemic · Silent about the pandemic | 6 | 2016-04-01 → 2026-04-01 | +139.0% | +9.1% | -38.7% | 0.84 |
| silent the pandemic · Equal-weight S&P 500 | 10 | 2016-04-01 → 2026-04-01 | +233.4% | +12.8% | -38.5% | 0.76 |
| talking remote work · Talk about remote work | 5 | 2021-04-01 → 2026-04-01 | +42.9% | +7.4% | -20.9% | 0.53 |
| talking remote work · Equal-weight S&P 500 | 10 | 2016-04-01 → 2026-04-01 | +233.4% | +12.8% | -38.5% | 0.76 |
| warning remote work · Warn about remote work | 6 | 2020-04-01 → 2026-04-01 | +204.9% | +20.4% | -22.3% | 0.95 |
| warning remote work · Equal-weight S&P 500 | 10 | 2016-04-01 → 2026-04-01 | +233.4% | +12.8% | -38.5% | 0.76 |
| silent remote work · Silent about remote work | 10 | 2016-04-01 → 2026-04-01 | +234.9% | +12.8% | -38.4% | 0.76 |
| silent remote work · Equal-weight S&P 500 | 10 | 2016-04-01 → 2026-04-01 | +233.4% | +12.8% | -38.5% | 0.76 |
| talking tariffs · Talk about tariffs | 10 | 2016-04-01 → 2026-04-01 | +252.8% | +13.4% | -38.5% | 0.80 |
| talking tariffs · Equal-weight S&P 500 | 10 | 2016-04-01 → 2026-04-01 | +233.4% | +12.8% | -38.5% | 0.76 |
| warning tariffs · Warn about tariffs | 10 | 2016-04-01 → 2026-04-01 | +254.9% | +13.5% | -38.0% | 0.78 |
| warning tariffs · Equal-weight S&P 500 | 10 | 2016-04-01 → 2026-04-01 | +233.4% | +12.8% | -38.5% | 0.76 |
| silent tariffs · Silent about tariffs | 10 | 2016-04-01 → 2026-04-01 | +165.6% | +10.3% | -40.4% | 0.61 |
| silent tariffs · Equal-weight S&P 500 | 10 | 2016-04-01 → 2026-04-01 | +233.4% | +12.8% | -38.5% | 0.76 |
| platform reference (SPY) (benchmark) | 2016-04-01 → 2026-04-01 | +299.0% | +14.8% | -33.7% |
Growth and CAGR above are each walk over its own windows, so they are not comparable across walks with different window counts: a walk that excluded a window did not live through it. The figure rebases every line on the session all of them share.
2.3 Search accounting
This paper's search is a declared family: the paper's 2 walks, counted at N = 12 evaluated books. Every member is either a registered walk with its own hypothesis and frozen record, or a derived average computed from those frozen records; every member is reported, in the family table, and none was selected away. The count is declared by the author rather than derived from one project's ledger, because the members are sibling registered studies; the declaration names them and is frozen in this artifact. What the source strategy's author searched before publishing is not knowable from here and is not counted. The registered per-step record below still guarantees each window's hypothesis was hashed and registered before that window was scored.
2.4 The comparison
Both arms trade the same registered windows, so their returns can be PAIRED: inside each window the two return series are inner-joined date by date and the difference rTalk about AI − rEqual-weight S&P 500 is the object under test. Because this is ONE pre-declared contrast, frozen at registration before any window was scored, the paired statistic needs no multiple-testing deflation; the arm-level records carry the declared family count of §2.3 as their search accounting, and this contrast, registered per window before scoring, is not multiplied by it.
In the table: Arm A = Talk about AI · Arm B = Equal-weight S&P 500.
| # | Window | Paired bars | Arm A | Arm B | Δ | Leader |
|---|---|---|---|---|---|---|
| 1 | 2016-04-04 → 2017-03-31 | 252 | +31.5% | +16.4% | +15.2 pp | Arm A |
| 2 | 2017-04-04 → 2018-03-29 | 249 | +21.9% | +12.0% | +9.9 pp | Arm A |
| 3 | 2018-04-03 → 2019-04-01 | 251 | +17.7% | +10.3% | +7.4 pp | Arm A |
| 4 | 2019-04-02 → 2020-03-31 | 252 | -6.2% | -18.1% | +11.9 pp | Arm A |
| 5 | 2020-04-02 → 2021-04-01 | 252 | +87.4% | +87.9% | -0.6 pp | Arm B |
| 6 | 2021-04-05 → 2022-04-01 | 253 | +13.5% | +12.6% | +0.9 pp | Arm A |
| 7 | 2022-04-04 → 2023-03-31 | 250 | -6.8% | -6.7% | -0.1 pp | Arm B |
| 8 | 2023-04-04 → 2024-03-28 | 248 | +24.3% | +20.2% | +4.1 pp | Arm A |
| 9 | 2024-04-02 → 2025-04-01 | 251 | +4.2% | +4.1% | +0.1 pp | Arm A |
| 10 | 2025-04-02 → 2026-04-01 | 251 | +19.9% | +15.8% | +4.1 pp | Arm A |
Paired Sharpe of the difference track: 0.74 · block bootstrap (2000 paths, block 10, seed 1234): P(Talk about AI beats Equal-weight S&P 500) = 99.5%.
Window win-rate. Talk about AI led 8 of 10 windows (80.0%), Equal-weight S&P 500 led 2, and the mean window gap of +5.30 pp points the same way. Widest single window: 2016 at +15.2 pp.
3 The circuit
The strategy is a circuit of platform primitives, frozen when the study is registered. Below is the circuit as wired on the canvas, the objective it encodes and how the search runs through it, followed by the mathematics each primitive actually computes, the same formulas the execution engine runs. The complete parameterisation is preserved in the study ledger (Appendix A).
The sentence below is the registration record, generated when the circuit was registered and printed verbatim; the authored description of the design is Section 1.
A COMPARATIVE study: Talk about AI vs Every company read, walked on the same registered out-of-sample windows. Talk about AI: S&P 500, annual report words: AI and machine learning, Outside the risk factors, Uses it, bought equal weight at the anchor close and held one year, and run out-of-sample from the anchor: anything the design estimates from history, where it estimates at all, is re-estimated at each anchor from pre-anchor data only, and the walk advances through registered out-of-sample windows; its disposition is the realized forward path versus the benchmark. Every company read: S&P 500, annual report words: AI and machine learning, Anywhere in the report, Every company read (the yardstick), bought equal weight at the anchor close and held one year, and run out-of-sample from the anchor: anything the design estimates from history, where it estimates at all, is re-estimated at each anchor from pre-anchor data only, and the walk advances through registered out-of-sample windows; its disposition is the realized forward path versus the benchmark. The arms differ in: Annual Report Words, Keep the companies that: Uses it → Every company read (the yardstick); Annual Report Words, Where in the report: Outside the risk factors → Anywhere in the report. The contrast under test: whether Talk about AI generates better risk-adjusted returns than Every company read over the identical out-of-sample windows.
Every block in this study is a card from the platform's catalog: the S&P 500 as its members stood at each date, Annual Report Words (Word: AI and machine learning, Tariffs and trade wars, Pandemic and COVID, or Remote work; Where in the report: outside the risk factors, inside them, or anywhere; Keep the companies that: uses it, does not use it, or the yardstick rule) and the Held Forward Test (one year from the close on the chosen date, 0.1% on every buy and every sell, dividends reinvested, SPY beside). A reader can rebuild all twelve tests and change any setting.
Envelopes show counts, ratios, dates, and the parameters the author chose. Full price and per-name data series are not republished: the underlying market data is licensed to QuanterLab. Point figures quoted in the prose, a named holding's return over a stated span, are summary facts derived from public market prices, not redistributed series.
The objective and the search
Talk about AI
| Universe | S&P 500 index constituents. |
|---|---|
| Validation & out-of-sample | held forward test (every wired name bought equal weight at the anchor close and held to the end of the one year window, dividends reinvested on the ex-date, 10 basis points one way at entry and at exit, fewer than 10 names excludes the window, SPY held the same way as the benchmark). |
| Other components | Select: Annual Report Words. |
Every company read
The specification is identical to Talk about AI's table above, row for row; the one registered difference between the arms is itemized below.
What differs between the arms, one manipulated variable, expressed as 2 paired settings on one node:
- paramAnnual Report Words, Keep the companies that: Uses it → Every company read (the yardstick)
- paramAnnual Report Words, Where in the report: Outside the risk factors → Anywhere in the report
Everything else is held identical, so an out-of-sample gap between the arms is attributable to this one change.
Cost elements are wired into the circuit, the realised drag is reported per step in Appendix B.
Show the mathematics, 3 primitives, formulas and parity notes
3.1 Universe
The starting set of tickers, resolved point-in-time from the index change-log, so names delisted or removed later still compete on the dates they traded.
Before any math, you need a list of stocks. An index preset (S&P 500, Nasdaq-100, Dow 30) is reconstructed as it stood ON your anchor date by replaying the historical add/drop change-log backwards, so a 2018 backtest sees the 2018 membership, not today's winners.
Start from today's constituents and un-apply every membership change after the anchor t:
\mathcal{U}(t) = \mathcal{U}_{\text{now}} \;\ominus\; \{\text{adds after } t\} \;\oplus\; \{\text{drops after } t\}3.2 Report Words
Annual Report Words: which companies’ annual reports use a word, and where in the report.
Every company in the S&P 500 files an annual report with the SEC, the 10-K. Its business section says what the company does and plans; its risk factors (Item 1A) list what could go wrong. Every original 10-K filed since 2015 was read once and 24 themes were counted in it, in the whole report and inside the risk factors; only the counts are kept, never the text. At the anchor, each wired company is read from the latest report the SEC had published before that day, filed within the last 15 months, and from the report the year before. Pick a word, where to look, and a rule: uses it, uses it a lot, uses it for the first time, dropped it, moved it into the risk factors, or does not use it. A company that reorganized under a new SEC registrant (Disney in 2019, Cigna in 2018) is followed from the old one to the new one.
This year’s report: the latest the SEC accepted before the anchor day (one accepted on the anchor day waits for the next), and no older than 460 days. Last year’s report: the one before it, filed 180 to 550 days earlier. A company with no report to read is left out and counted as unread.
\text{per 10,000 words} = 10^4 \cdot \frac{\text{mentions in the place read}}{\text{words in the place read}}\begin{array}{ll}\text{uses it} & m_t \ge 1\\[4pt] \text{first time} & m_t \ge 1,\ m_{t-1} = 0\\[4pt] \text{dropped it} & m_{t-1} \ge 1,\ m_t = 0\\[4pt] \text{moved into the risk factors} & m^{\text{all}}_{t-1} \ge 1,\ m^{\text{risk}}_{t-1} = 0,\ m^{\text{risk}}_t \ge 1\\[4pt] \text{does not use it} & m_t = 0\end{array}Each theme is a fixed list of words and phrases matched as whole words; acronyms such as AI, ESG and PRC only in capitals. The list for each theme is under its name in the Word setting.
3.3 Hold Forward
The one hold every paper used: equal weight at the anchor, held to the end.
Buys every selected name in equal parts at the anchor close and holds to the window’s end, reinvesting each dividend into the paying name on its ex-date, paying a cost once at entry and once at exit. No signal, no rebalance, nothing re-estimated: what it measures is the selection itself. A name that stops trading marks flat at its last close and is sold there; fewer names than the floor excludes the window and says so.
u_i=\frac{C/N \cdot (1-f)}{P_{i,0}},\qquad E_t=\sum_i u_{i,t}P_{i,t}u_{i,t}=u_{i,t^-}\left(1+\frac{D_{i,t}}{P_{i,t}}\right)4 Discussion
4.1 Findings
AI: the talkers beat the equal-weight S&P 500 in 8 of 10 years and beat SPY over the ten years; all of the lead over SPY came before April 2021. The warners beat the equal-weight S&P 500 in 6 of 8 years from 2018. The silent were behind in 9 of 10 years.
Tariffs: the talkers and the warners each beat the equal-weight S&P 500 in 6 of 10 years, by a point a year or less. The silent were behind in 6 of 10, most of all in the year from April 2025.
The pandemic: the talkers and the warners were a little ahead, in 6 and 7 of 10 years. The silent were behind in 4 of the 6 years they could be bought.
Remote work: the talkers were ahead in 3 of their first 4 years and 10 points behind in the year from April 2025. The warners' lead comes from 2020 alone.
Only three of the twelve lists beat SPY over their years: the two AI lists, and the remote-work warners because of 2020 (Figure 5, Table 3).
4.2 Interpretation
AI is the one theme where the talkers clearly beat the equal-weight S&P 500, and they did it while the theme was young: their lead was largest from 2016 to 2019, when few companies used the word, in the first year mostly thanks to NVIDIA, and all of the lead over SPY came before April 2021. Remote work shows a theme on its way out: the companies still talking about it after it had faded did worst of the three remote-work lists. For tariffs and the pandemic, the talkers and the warners were a little ahead of the equal-weight S&P 500, and the silent were behind.
Lawyers write the risk factors to protect the company, so a warning could be read as fear. For AI, the warnings came mostly from companies that also talked about AI: in 2025, 273 of the 411 warners were also talkers. That fits a brag better than fear, but this test cannot tell the two apart, because the warners and the talkers are mostly the same companies; the companies that only warn are the test, and the full study will run it. The pattern is familiar outside the stock market too, though our data does not measure it: Anthropic, one of the leading AI developers, is also one of the companies that speaks most about the risks of AI.
The silent lists show which companies a theme does not reach. In 2025 the companies with nothing to say about AI were mostly in materials, energy, utilities, property or industry. The companies with nothing to say about tariffs were mostly banks, insurers and other service companies.
A theme also picks industries. In ten years when technology companies led the market, a theme that picks technology companies looks good, and a theme that leaves them out looks bad. These tests cannot separate a company's words from its industry. The 20-year database allows longer tests, other filings, and themes defined down to single words and sections.
Build your own theme
Everything in this paper is in the lab, on the Annual Report Words card, for the S&P 500 on any day since 2016. Choose a word from 24 themes. Choose where to look: anywhere in the report, inside the risk factors, or outside them. Choose which companies to keep: the ones that use the word, use it a lot, use it for the first time, dropped it, moved it into the risk factors, or do not use it. Connect the card to the Held Forward Test to see what those companies did in the next year, next to SPY.
Some settings to try. Tariffs, anywhere in the report, does not use it, on 1 April 2025: the 59 silent companies of the tariff year. Climate and ESG, outside the risk factors, uses it a lot: the companies that make climate part of their business. The pandemic, inside the risk factors, for the first time, on 1 April 2020: 121 companies added it in the reports they filed in the first three months of that year. Remote work, dropped it, on 1 April 2023: 86 companies.
Twenty years of filings, your own words and your own thresholds come next, on the same card.
4.3 Limitations
We count words; we do not read their meaning. A mention can be one line in a list of a hundred risks, and our tariff count also includes the price lists of utilities and pipelines. The word lists were fixed before counting and are published with the card. The risk factors sections grew by about 60% in these years, which pulls every theme toward them. In the first three years some companies had no prices and were left out: 33 of the 494 companies of the equal-weight S&P 500 in 2016, fewer in 2017 and 2018, and almost none from 2019. The further back, the more are missing, which is what happens when companies that were later bought or delisted have no prices in our data; Yahoo, one of the 12 AI talkers of 2016, is one of them. One company can also carry a small list: NVIDIA made more than half of the AI talkers' return in the year from April 2016. Each list is also a list of industries: the early AI talkers were mostly technology companies, and the silent lists came mostly from a few industries, so these tests cannot separate a company's words from its industry. Ten one-year holds are few, and twelve tests ran on the same ten years. The ten later tests were chosen after the two AI results were known. Some results rest on one year: the year from April 2025 for the tariff silent, the year from April 2020 for the pandemic silent and for the remote-work warners. In April 2020 the pandemic lists also sorted companies by the date they filed. A list with fewer than ten companies in a year was not bought that year, and that year is left out of its comparison: the AI warners before 2018, the remote-work warners before 2020 and talkers before 2021, and the pandemic silent from 2021 to 2024. The counts of reports cover the largest US companies. In each month from 2016, 98 to 100 percent of the S&P 500's members could be matched to the company that filed the reports; the others were spin-offs that had not yet filed an annual report and two banks that file with the FDIC instead of the SEC. 2026 runs to 6 October.
References
- Gelman, A., & Loken, E. (2013). The garden of forking paths: Why multiple comparisons can be a problem, even when there is no “fishing expedition.” Working paper, Columbia University.
- Harvey, C. R., Liu, Y., & Zhu, H. (2016). … and the Cross-Section of Expected Returns. Review of Financial Studies, 29(1), 5–68. doi:10.1093/rfs/hhv059
- Lo, A. W. (2002). The Statistics of Sharpe Ratios. Financial Analysts Journal, 58(4), 36–52. doi:10.2469/faj.v58.n4.2453
- Cohen, Malloy and Nguyen (2020), Lazy Prices, Journal of Finance 75(3): 1371-1415. https://doi.org/10.1111/jofi.12885
- Dyer, Lang and Stice-Lawrence (2017), The Evolution of 10-K Textual Disclosure: Evidence from Latent Dirichlet Allocation, Journal of Accounting and Economics 64(2-3): 221-245. https://doi.org/10.1016/j.jacceco.2017.07.002
- Loughran and McDonald (2011), When Is a Liability Not a Liability? Textual Analysis, Dictionaries, and 10-Ks, Journal of Finance 66(1): 35-65. https://doi.org/10.1111/j.1540-6261.2010.01625.x
- US Securities and Exchange Commission (2020), Modernization of Regulation S-K Items 101, 103, and 105, Release No. 33-10825, 26 August 2020.
- US Securities and Exchange Commission (2024), SEC Charges Two Investment Advisers with Making False and Misleading Statements About Their Use of Artificial Intelligence, press release 2024-36, 18 March 2024.
Appendix A Reproducibility in QuanterLab
Each step is backed by a frozen run report. The study is re-derivable from the ledger below.
| # | Commit | Report | Anchor | OOS window |
|---|---|---|---|---|
| 1 | be2d1cfc4278 | 14574 | 2016-04-01 | 2016-04-01 → 2017-03-31 |
| 2 | 346833cf62b1 | 14576 | 2017-04-01 | 2017-04-03 → 2018-03-29 |
| 3 | 8e1557220b76 | 14577 | 2018-04-01 | 2018-04-02 → 2019-04-01 |
| 4 | 3f94900372b1 | 14579 | 2019-04-01 | 2019-04-01 → 2020-03-31 |
| 5 | f85f726c3dab | 14581 | 2020-04-01 | 2020-04-01 → 2021-04-01 |
| 6 | f0cf9d74e4c3 | 14584 | 2021-04-01 | 2021-04-01 → 2022-04-01 |
| 7 | 1579f221d59c | 14586 | 2022-04-01 | 2022-04-01 → 2023-03-31 |
| 8 | d02d59971fd3 | 14587 | 2023-04-01 | 2023-04-03 → 2024-03-28 |
| 9 | c0d63d56f48f | 14589 | 2024-04-01 | 2024-04-01 → 2025-04-01 |
| 10 | 831ebad420cd | 14592 | 2025-04-01 | 2025-04-01 → 2026-04-01 |
Appendix A2 Registration record
What this record does and does not establish. Every window in this study is historical: the data existed before the study began, so this is sequential registration on past windows, not pre-registration in the clinical-trial sense, and no procedure could make it so. What the platform does enforce is order, each step's specification was frozen and hashed before that step was scored, and the walk cannot advance past a step that was never run or close one with a result registered for a different window. The two timestamp columns below are the evidence: read them together and each registration precedes its own run, and each run precedes the next registration. A study whose registrations all post-date its runs would show it here. Wall-clock spacing between registrations varies with the author's schedule and queue latency; the ordering, not the tempo, is the claim.
“A COMPARATIVE study: Talk about AI vs Every company read, walked on the same registered out-of-sample windows. Talk about AI: S&P 500, annual report words: AI and machine learning, Outside the risk factors, Uses it, bought equal weight at the anchor close and held one year, and run out-of-sample from the anchor: anything the design estimates from history, where it estimates at all, is re-estimated at each anchor from pre-anchor data only, and the walk advances through registered out-of-sample windows; its disposition is the realized forward path versus the benchmark. Every company read: S&P 500, annual report words: AI and machine learning, Anywhere in the report, Every company read (the yardstick), bought equal weight at the anchor close and held one year, and run out-of-sample from the anchor: anything the design estimates from history, where it estimates at all, is re-estimated at each anchor from pre-anchor data only, and the walk advances through registered out-of-sample windows; its disposition is the realized forward path versus the benchmark. The arms differ in: Annual Report Words, Keep the companies that: Uses it → Every company read (the yardstick); Annual Report Words, Where in the report: Outside the risk factors → Anywhere in the report. The contrast under test: whether Talk about AI generates better risk-adjusted returns than Every company read over the identical out-of-sample windows.”
The same hypothesis was registered independently at every step, hashed before each step's out-of-sample window was scored:
| # | Anchor | Registered at (UTC) | Run completed (UTC) |
|---|---|---|---|
| 1 | 2016-04-01 | 2026-10-09 14:52:39 | 2026-10-09 14:54:10 |
| 2 | 2017-04-01 | 2026-10-09 14:54:10 | 2026-10-09 14:54:33 |
| 3 | 2018-04-01 | 2026-10-09 14:54:34 | 2026-10-09 14:55:03 |
| 4 | 2019-04-01 | 2026-10-09 14:55:04 | 2026-10-09 14:55:31 |
| 5 | 2020-04-01 | 2026-10-09 14:55:32 | 2026-10-09 14:55:40 |
| 6 | 2021-04-01 | 2026-10-09 14:55:41 | 2026-10-09 14:56:26 |
| 7 | 2022-04-01 | 2026-10-09 14:56:26 | 2026-10-09 14:56:58 |
| 8 | 2023-04-01 | 2026-10-09 14:56:58 | 2026-10-09 14:57:32 |
| 9 | 2024-04-01 | 2026-10-09 14:57:32 | 2026-10-09 14:58:08 |
| 10 | 2025-04-01 | 2026-10-09 14:58:08 | 2026-10-09 14:58:48 |
Appendix B Per-step diagnostics
Realized in the projection tables below is the risk engine scoring its own forecast: the buy-and-hold return of the segment that followed each rebalance, on the same gross basis the cone was projected on. It is deliberately not the charged, calendar-window total return the study’s tables print, so the two will not reconcile line by line; the cone and its outcome share one basis, which is what a calibration test requires. Each row names its segment’s span so a boundary session is visible.
Names held is the union across the window: the count of distinct instruments the book touched between the window’s first and last session, not the number it held at one time. A book that rotates monthly touches more names than it holds.
What each step's run actually did beyond its return: capital allocation across lanes and regimes, the portfolio book's rebalancing and cost drag, and how positions were sized. Harvested from the frozen run reports, present where the circuit produced them. Cost drag is the gap between the step's return before and after its trading costs, in percentage points of the step's starting capital, so on a book that trades every session and compounds it can exceed the step's own net return.
Open the full per-step grid (10 steps: every rebalance, capital routing and sizing, per window)
Step 1 · 2016-04-01 → 2017-03-31
Talk about AI
Portfolio book, rebalanced hold · 11 names held · selection: anchor · cost drag 0.263% · 1 name dropped at load for want of prices (12 selected, 11 held), weights renormalised onto the rest
Equal-weight S&P 500
Portfolio book, rebalanced hold · 461 names held · selection: anchor · cost drag 0.233% · 33 names dropped at load for want of prices (494 selected, 461 held), weights renormalised onto the rest
Step 2 · 2017-04-03 → 2018-03-29
Talk about AI
Portfolio book, rebalanced hold · 19 names held · selection: anchor · cost drag 0.244% · 1 name dropped at load for want of prices (20 selected, 19 held), weights renormalised onto the rest
Equal-weight S&P 500
Portfolio book, rebalanced hold · 475 names held · selection: anchor · cost drag 0.224% · 23 names dropped at load for want of prices (498 selected, 475 held), weights renormalised onto the rest
Step 3 · 2018-04-02 → 2019-04-01
Talk about AI
Portfolio book, rebalanced hold · 46 names held · selection: anchor · cost drag 0.236% · 2 names dropped at load for want of prices (48 selected, 46 held), weights renormalised onto the rest
Equal-weight S&P 500
Portfolio book, rebalanced hold · 483 names held · selection: anchor · cost drag 0.221% · 14 names dropped at load for want of prices (497 selected, 483 held), weights renormalised onto the rest
Step 4 · 2019-04-01 → 2020-03-31
Talk about AI
Portfolio book, rebalanced hold · 71 names held · selection: anchor · cost drag 0.188%
Equal-weight S&P 500
Portfolio book, rebalanced hold · 492 names held · selection: anchor · cost drag 0.164% · 6 names dropped at load for want of prices (498 selected, 492 held), weights renormalised onto the rest
Step 5 · 2020-04-01 → 2021-04-01
Talk about AI
Portfolio book, rebalanced hold · 86 names held · selection: anchor · cost drag 0.375%
Equal-weight S&P 500
Portfolio book, rebalanced hold · 497 names held · selection: anchor · cost drag 0.376% · 1 name dropped at load for want of prices (498 selected, 497 held), weights renormalised onto the rest
Step 6 · 2021-04-01 → 2022-04-01
Talk about AI
Portfolio book, rebalanced hold · 111 names held · selection: anchor · cost drag 0.227%
Equal-weight S&P 500
Portfolio book, rebalanced hold · 497 names held · selection: anchor · cost drag 0.225% · 1 name dropped at load for want of prices (498 selected, 497 held), weights renormalised onto the rest
Step 7 · 2022-04-01 → 2023-03-31
Talk about AI
Portfolio book, rebalanced hold · 134 names held · selection: anchor · cost drag 0.187%
Equal-weight S&P 500
Portfolio book, rebalanced hold · 497 names held · selection: anchor · cost drag 0.187%
Step 8 · 2023-04-03 → 2024-03-28
Talk about AI
Portfolio book, rebalanced hold · 146 names held · selection: anchor · cost drag 0.249%
Equal-weight S&P 500
Portfolio book, rebalanced hold · 497 names held · selection: anchor · cost drag 0.24%
Step 9 · 2024-04-01 → 2025-04-01
Talk about AI
Portfolio book, rebalanced hold · 223 names held · selection: anchor · cost drag 0.209%
Equal-weight S&P 500
Portfolio book, rebalanced hold · 498 names held · selection: anchor · cost drag 0.208%
Step 10 · 2025-04-01 → 2026-04-01
Talk about AI
Portfolio book, rebalanced hold · 292 names held · selection: anchor · cost drag 0.24%
Equal-weight S&P 500
Portfolio book, rebalanced hold · 498 names held · selection: anchor · cost drag 0.232%