


Insider Buying Strategy Tested Apart - Investment, Manipulation, Protection, Liability
When a company's own directors and top managers buy its shares with their own money, people take it as a sign of confidence. They know the company better than anyone, so the thinking goes, and nobody buys more of something they expect to fall. These purchases are public: the law makes every insider report each trade to the SEC within days.
We used those reports in two ways. First we counted, every quarter, how many companies in the S&P 500 had insiders buying, and how much they bought measured against the size of their own company, so that a purchase in a giant and a purchase in a smaller company count by what they mean to each. Then we built three baskets that follow the insiders and re-picked them every quarter: every company where at least one insider bought, only the companies where three or more insiders bought, and the twenty companies where insiders spent the most money. Each basket gave every company the same amount of money, paid trading costs, kept its dividends, and was held against the equal-weight S&P 500, which also gives every member the same amount. Alongside the test we explain who counts as an insider and the rules they trade under: the protection the law gives other investors, the lines against manipulation, and the liability an insider takes on with every purchase.
The count tells a clear story. In ordinary times insiders buy in a small share of the index's companies. In a sell-off the crowd of buying insiders grows sharply, and the typical company's insiders put in more for its size. The largest crowds came close to the bottoms of the market, but many insiders bought well before the worst of the falls was over. Some of that buying is a message as much as an investment: a purchase in the middle of a fall tells everyone who reads the reports that management still has confidence in the company. Following the insiders company by company did not beat simply holding the equal-weight index in any of the three baskets.
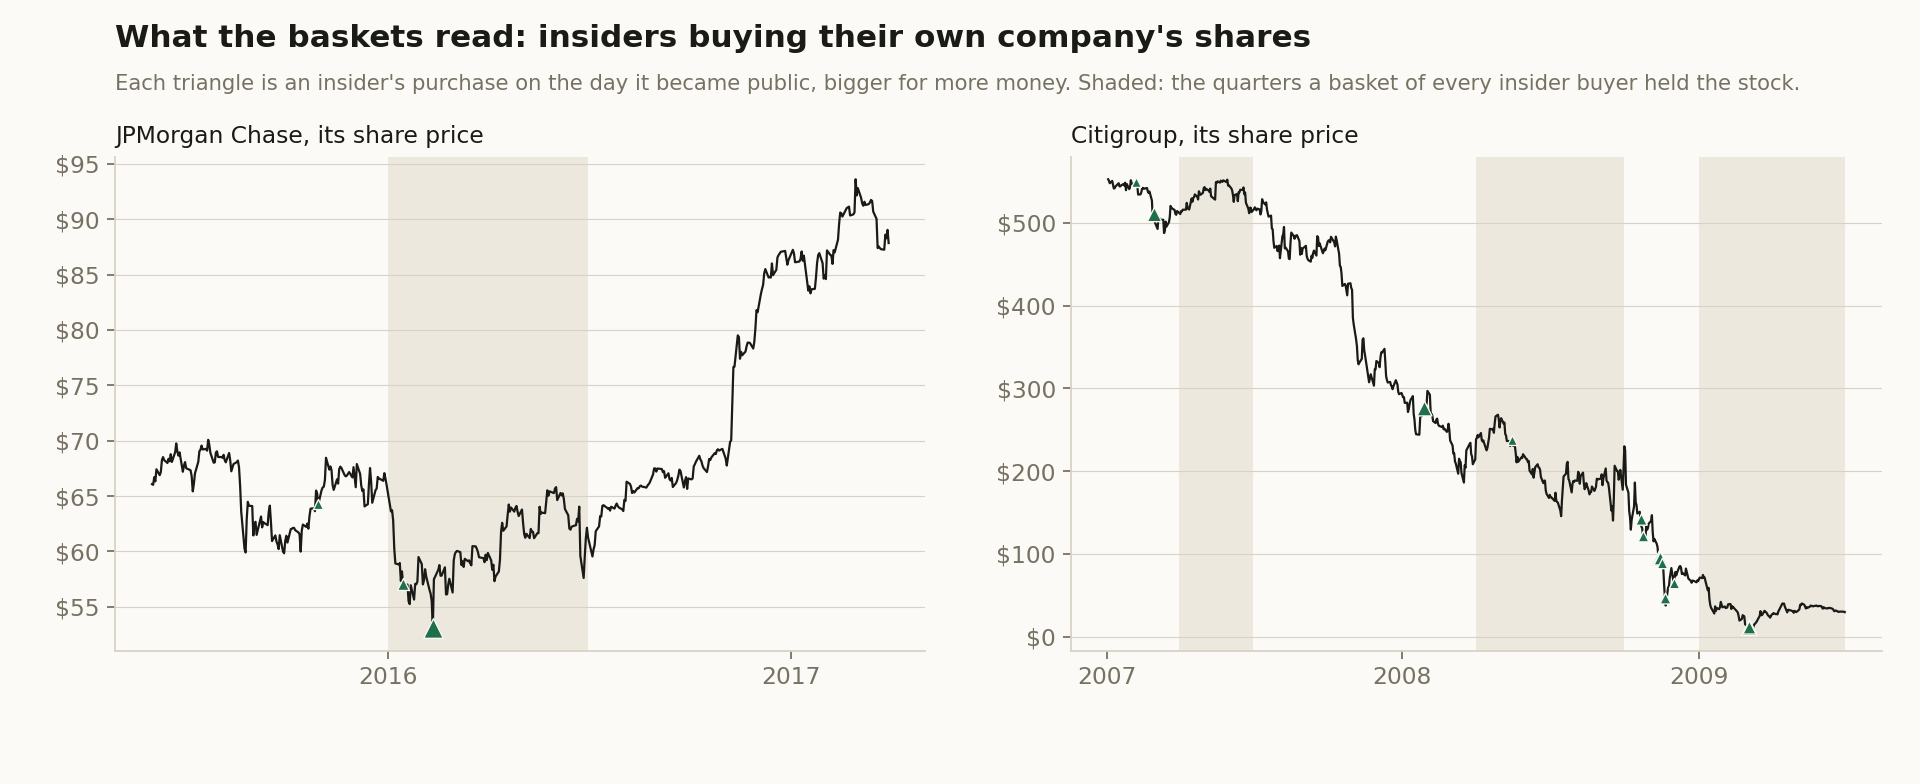
What insider buying looks like
Two companies show what the baskets read. At JPMorgan Chase the chief executive, Jamie Dimon, bought a large block of the bank's shares in February 2016, after a fall in bank shares; a director had bought a few weeks before. The shares went on to rise for the rest of the year. At Citigroup insiders bought on the way down: in 2007, again in January 2008 when the chief executive bought, then in a crowd in the autumn of 2008, and once more in March 2009. Most of those purchases came long before the bottom, and the shares lost most of their value in between.
Both cases are what a basket of every insider buyer would have held. The rule does not ask whether the insider was right, only whether one bought.
Twenty years of insider buying
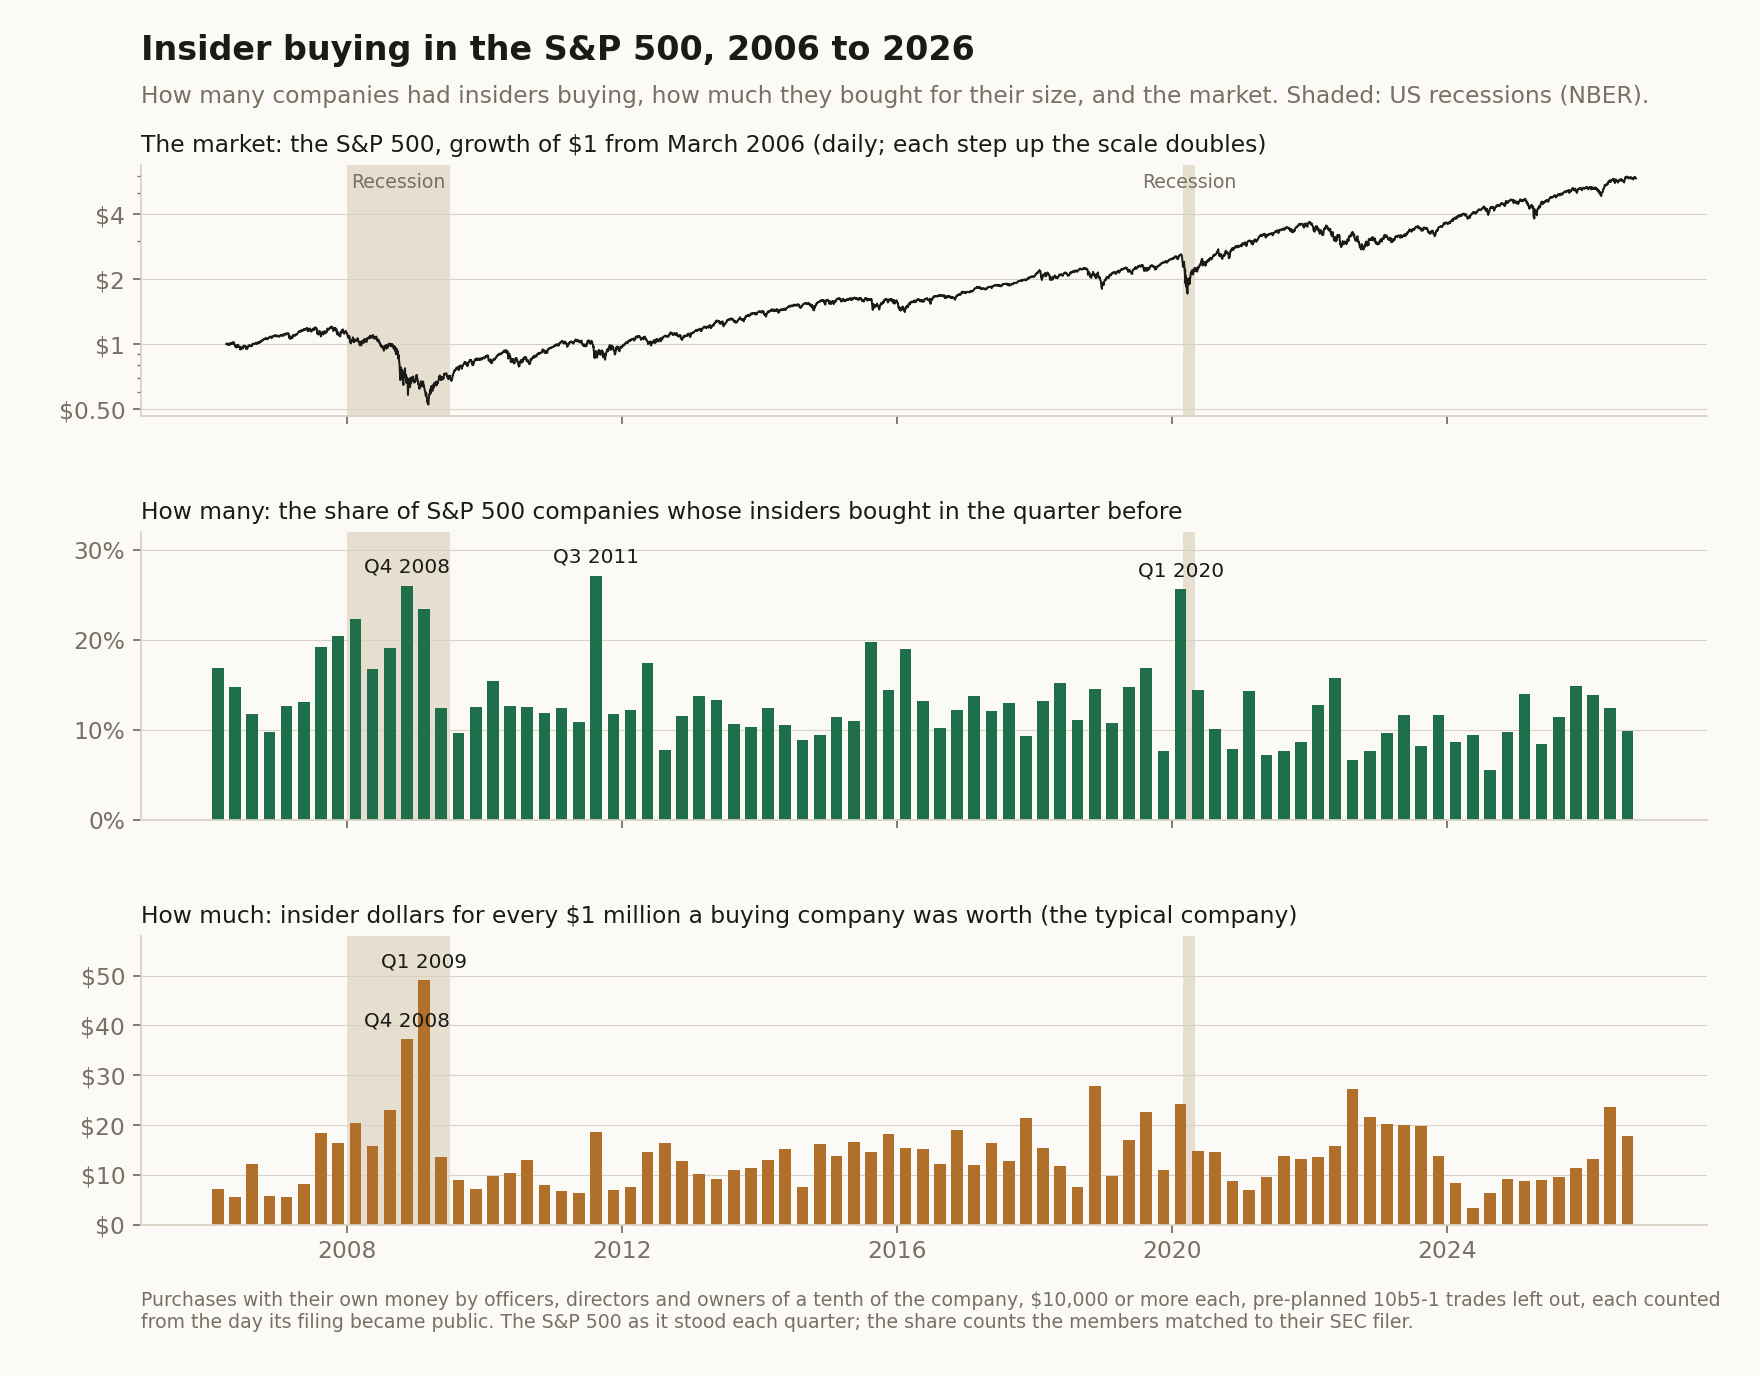
Figure 2 counts the crowd. Each quarter we took the S&P 500 as it stood that day and asked of every member: did any of its insiders buy shares with their own money in the three months before? Then we asked how much they bought, measured against the company's own size. A million dollars is a large purchase for a smaller company and a rounding error for one of the giants, so we put each company's purchases against what the whole company was worth and took the typical company of each quarter.
In ordinary quarters insiders buy in roughly one company in eight. The crowd jumps in a sell-off: in the worst months of the financial crisis, months before the market touched bottom, in the euro debt scare and in the pandemic crash, about one company in four had insiders buying. Smaller jumps came in the sell-offs of the oil slump and in the bear market when interest rates rose. The amount moves the same way. In the typical buying company, insiders put in between ten and twenty dollars for every million dollars the company is worth, and the most came at the deepest point of the financial crisis.
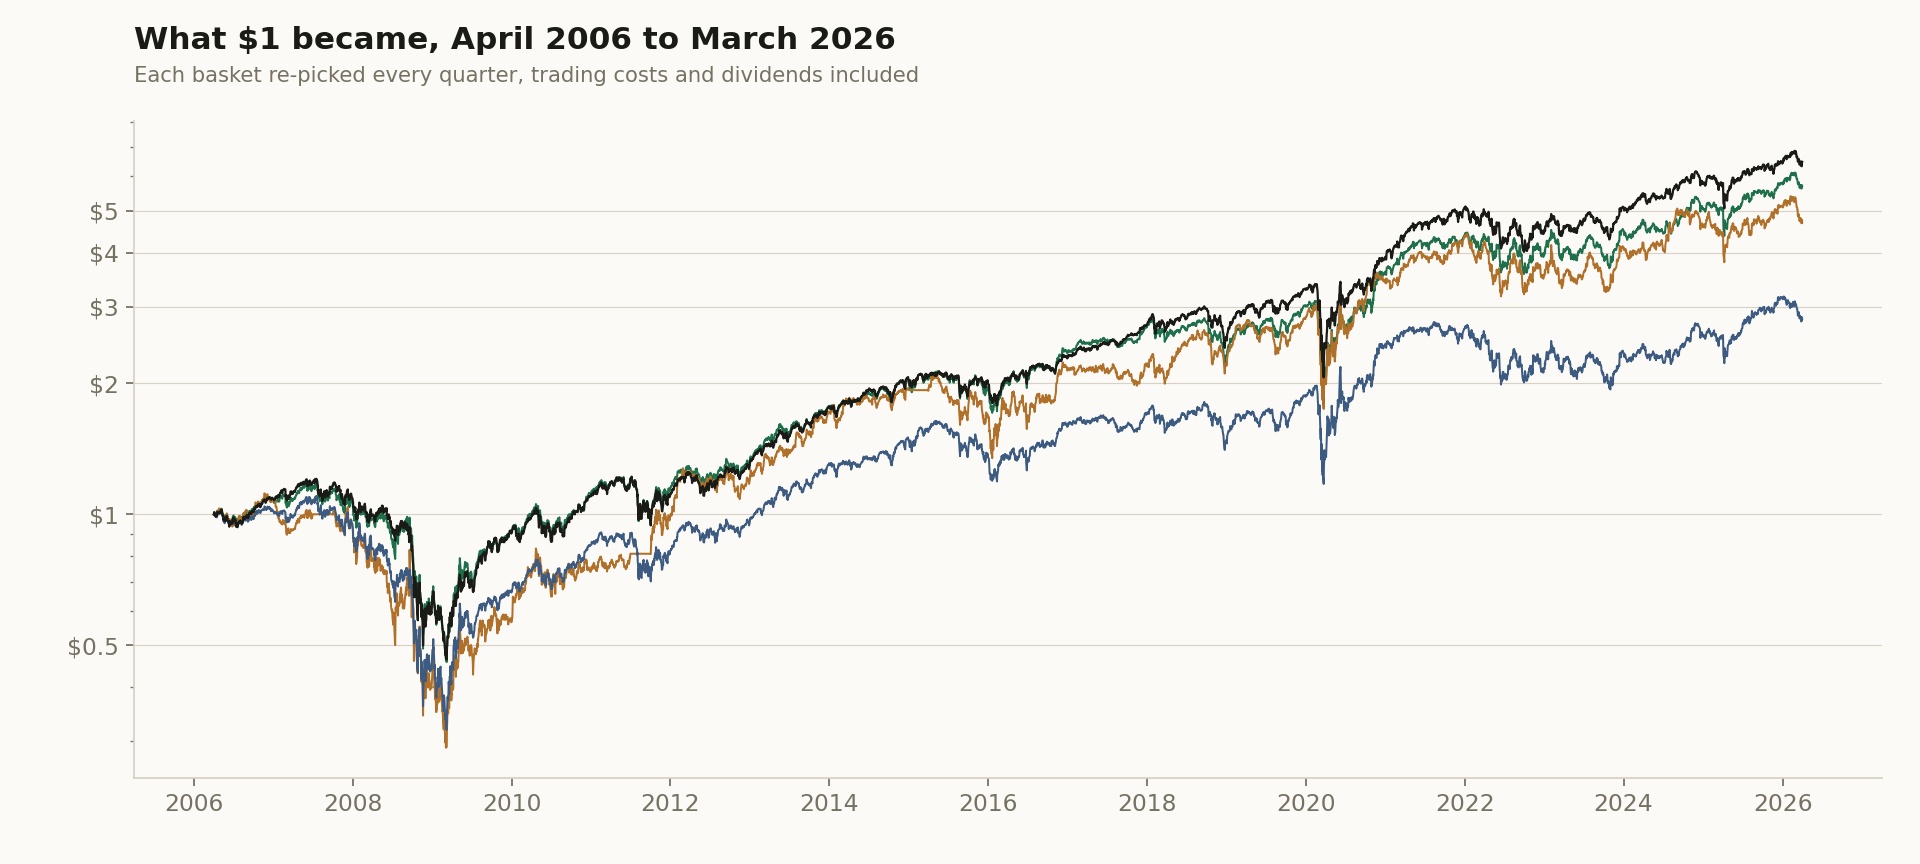
What we found, in short
None of the three baskets kept up with the equal-weight S&P 500 over the twenty years. The basket of every insider buyer came closest and moved much like the index, falling as far in the crisis and rising with it after. Asking for three or more insiders gave a small basket that swung harder in both directions and ended lower, and buying where insiders spent the most ended lowest. All three had their best years right after the two great crashes, when insiders had bought in a crowd, and all three beat the index in those two years. In calmer years they mostly trailed it.
Who counts as an insider
In everyday speech an insider is anyone who knows something the public does not. In the SEC's files the word is narrower and has a legal meaning. A company's insiders are three groups of people. The first is its directors, the members of its board. The second is its officers: the chief executive, the chief financial officer, the chief accountant, the vice presidents who run a main part of the business, and anyone else who sets company policy. The third is anyone who owns more than a tenth of the company's shares, whether a person, a fund or another company.
A manager below that level does not file these reports, however much stock he buys, although the ban on trading on inside news applies to him as much as to anyone. Buying a large amount does not make anyone an insider either. Only owning more than a tenth of the company does, and some investors stop just short of that line on purpose.
Warren Buffett's Berkshire Hathaway is the best known case. When Wells Fargo bought back its own shares, Berkshire's stake grew past a tenth of the bank without Berkshire buying more. Berkshire sold enough shares to get back under the line and said the sales were not made because of what the bank was worth. Asked about the line at Berkshire's annual meeting, Buffett named two burdens that come with it: every purchase must be reported within days, so others copy the trades, and the six-month rule limits how freely the holding can be changed. More recently Berkshire sold Bank of America shares until it held just under a tenth, and from then on its trades no longer had to be reported within days.
The rules they live under
Every insider must report each purchase and each sale to the SEC within two business days of the trade, on a short report called Form 4. Those reports are public, and they are what this study reads. Shares bought by a spouse or a child living in the same household count as the insider's own and go on the same report.
No law caps how much an insider may buy, but the rules limit how and when. An insider may not trade on news the public has not heard yet. Most companies go further and let their insiders trade only in set periods, usually after the company has published its results, and they must now tell their shareholders what those policies are. An insider who buys and then sells within six months, or sells and then buys, must pay any profit from those trades back to the company. An insider may not sell the company's shares short. Very large purchases bring their own reports: past a twentieth of the company for anyone, and past an antitrust threshold a notice to the competition authorities, which Capital One's chief executive was fined for skipping.
Many insiders also set up trading plans in advance, so that the trades happen on dates fixed long before. Since a recent change of the rules, such a plan has to wait a few months before its first trade, and the trades are marked on the report. Before that change the report had no such mark, so for those years the study goes by the insider's own words on the report, the note that says a trade came from a plan; a plan trade without such a note stays in. This study leaves plan trades out, because a trade decided months before says little about today.
The rules also reach the people around the insider. A tip passed to a relative or a friend who then trades on it is a crime for both of them, even when the insider takes nothing for it: the Supreme Court has said that a tip given as a gift counts. A company may not brief chosen investors, such as a fund close to the chief executive, on news before it tells the public. People have gone to prison for this: the head of the Galleon hedge fund was sentenced after trading on tips that included one from a director of Goldman Sachs. The rules are there so that an insider's purchase is a statement of confidence anyone can read, and not an advantage only friends can use.
The three baskets, step by step
Each basket starts on the first of April of a year, holds for one year, and is then started again, twenty times from 2006 to 2025, always on the S&P 500 as it stood on each date, so no company is picked with hindsight. Inside each year the basket is picked again every quarter. At each pick it reads the insider reports made public in the three months before, counts only purchases with the insider's own money of ten thousand dollars or more, and leaves out trades from plans set up in advance.
The first basket holds every company where at least one insider bought. The second holds only the companies where three or more different insiders bought, the idea being that several people agreeing says more than one. The third holds the twenty companies where insiders spent the most money, counted in plain dollars, as the usual lists of the biggest insider purchases rank them. It is the one place where the study does not measure buying against the company's size: it tests the ranking people meet in those lists. Every basket gives each of its companies the same amount of money, pays a small cost on every trade, keeps the dividends its companies pay, and sits in cash in a quarter with nothing to buy. The yardstick is the equal-weight S&P 500, which also gives every member the same amount, so the baskets and the yardstick differ mainly in which companies they hold. A basket also sits in cash in a quarter with nothing to buy, and before 2015 it can pick only among the companies linked to their SEC filings.
1 Methodology, in detail (click to open)
1 Methodology
The study read the insider filings on SEC Forms 4 and 5 for every company in the S&P 500 as the index stood on each date, from January 2006. It counted open-market purchases by directors, officers and owners of more than a tenth of the company, each from the day its filing became public; purchases made under a Rule 10b5-1 plan were left out, found from April 2023 by the form's own box and before that by the filing's footnotes or remarks that say a trade was made under such a plan (a plan trade with no such words counts as a purchase), and a buyer counted when their purchases in the look-back added up to $10,000 or more. The twenty biggest buys ranks the companies by the plain dollars their insiders bought in the 90 days before each pick (the card's Value bought), as the usual lists of the largest insider purchases do; Figure 2's how much divides by the company's value instead.
Each basket was picked again every quarter from the filings of the previous 90 days and held in equal weight, with dividends credited on their ex-dates, a cost of 0.10% spread, 0.05% slippage and 0.02% market impact on every trade, and cash in a quarter with no pick. Twenty one-year periods, each starting on the first of April from 2006 to 2025, were set up and fixed before any of them was run, and each started where the last one ended. The yardstick is RSP, the equal-weight S&P 500, with dividends. The study's record also gives a 39% probability that every insider buyer beats three or more insiders: that figure adds up the daily differences between the two baskets, where the bigger swings of three or more insiders count in full in both directions, while the growth of a dollar compounds them. Compounded, every insider buyer ended ahead by about a point a year. A first run of the same design counted price moves only, although its description said dividends; it was run again with dividends, and both runs are kept in the study's record.
The count in Figure 2 takes, at the end of each quarter from March 2006 to September 2026, the S&P 500 members with at least one such buyer in the 90 days before, among the members linked to their SEC filer. How much is each buying company's purchases divided by its market value that day (its last close times the latest share count known then), the median company of the quarter. The market's line is the S&P 500's daily price, as growth of a dollar. The shaded stretches are the US recessions as the National Bureau of Economic Research dates them, from the month after each peak to the trough: January 2008 to June 2009, and March to April 2020.
2 Results
Findings
Over the twenty years a dollar in the equal-weight S&P 500 grew to $6.47, about 9.8% a year, with dividends. A dollar in every insider buyer grew to $5.69, about 9.1% a year, and was ahead of the index in 9 of the twenty years. Three or more insiders grew to $4.70 and the twenty biggest buys to $2.81. Table 1 has each basket's worst fall and how many companies it held.
2.1 Headline
Table 1. Each basket and the equal-weight S&P 500, April 2006 to March 2026, with dividends and trading costs. The worst fall is the largest drop from a high; companies a year is how many different companies a basket held in a typical year.
| Basket | $1 became | A year | Worst fall | Years ahead of RSP | Companies a year |
|---|---|---|---|---|---|
| Every insider buyer | $5.69 | 9.1% | −61.2% | 9 of 20 | about 181 |
| Three or more insiders | $4.70 | 8.0% | −74.0% | 7 of 20 | about 27 |
| The twenty biggest buys | $2.81 | 5.3% | −71.0% | 5 of 20 | about 67 |
| The equal-weight S&P 500 (RSP) | $6.47 | 9.8% | −61.6% |
Sections 2.2 to 4, the full record: every year, every test, and how each one was run (click to open)
2.2 Per-step results
| # | Out-of-sample window | Every company where an insider bought SR | Three or more different insiders bought SR | The twenty biggest buys SR |
|---|---|---|---|---|
| 1 | 2006-04-03 → 2007-03-30 | 0.73 | -0.50 | -0.07 |
| 2 | 2007-04-02 → 2008-03-31 | -0.30 | -0.37 | -0.47 |
| 3 | 2008-04-01 → 2009-04-01 | -0.70 | -0.57 | -0.80 |
| 4 | 2009-04-01 → 2010-04-01 | 2.09 | 1.72 | 1.84 |
| 5 | 2010-04-01 → 2011-04-01 | 0.99 | 0.41 | 1.05 |
| 6 | 2011-04-01 → 2012-03-30 | 0.42 | 2.15 | 0.41 |
| 7 | 2012-04-02 → 2013-04-01 | 1.17 | 0.38 | 0.81 |
| 8 | 2013-04-01 → 2014-04-01 | 1.73 | 2.08 | 1.71 |
| 9 | 2014-04-01 → 2015-04-01 | 0.91 | 0.48 | 1.22 |
| 10 | 2015-04-01 → 2016-03-31 | 0.07 | -0.18 | -0.50 |
| 11 | 2016-04-01 → 2017-03-31 | 1.57 | 1.13 | 1.27 |
| 12 | 2017-04-03 → 2018-03-29 | 0.31 | -0.21 | -0.28 |
| 13 | 2018-04-02 → 2019-04-01 | 0.46 | 1.75 | 0.56 |
| 14 | 2019-04-01 → 2020-03-31 | -0.61 | -0.78 | -0.50 |
| 15 | 2020-04-01 → 2021-04-01 | 2.30 | 1.93 | 2.09 |
| 16 | 2021-04-01 → 2022-04-01 | 0.66 | 0.84 | -0.07 |
| 17 | 2022-04-01 → 2023-03-31 | -0.13 | -0.44 | -0.28 |
| 18 | 2023-04-03 → 2024-03-28 | 1.10 | 1.06 | 0.53 |
| 19 | 2024-04-01 → 2025-04-01 | 0.47 | 0.34 | 0.34 |
| 20 | 2025-04-01 → 2026-04-01 | 0.77 | 0.40 | 0.57 |
2.3 Search accounting
No search record exists for this design. It was not promoted from a recorded evolving search, so the number of alternatives tried before it, on paper, in another tool, or in the author's head, is unknown. Unknown is a different fact from one: a study with no lineage is not a strategy with one trial, it is a strategy with an unrecorded number of them. Accordingly no count of alternatives tried is claimed, and nothing in this paper is corrected for a search that was never recorded; the number that stands is the raw out-of-sample result plus this disclosure. The registered per-step record below (§4) still guarantees each window's hypothesis was hashed and registered before that window was scored.
2.4 The comparison
Both arms trade the same registered windows, so their returns can be PAIRED: inside each window the two return series are inner-joined date by date and the difference rEvery company where an insider bought − rThree or more different insiders bought is the object under test. Because this is ONE pre-declared contrast, frozen at registration before any window was scored, the paired statistic needs no multiple-testing deflation, and the per-arm pooled numbers above are likewise uncorrected, because this design has no recorded search to correct against (§2.3). The paired contrast carries that gap differently from the arm levels: it was declared before each window ran and it is scored on the difference, so no window could be read first and scored after. What the timestamps cannot speak to is how this contrast came to be the declared one, which is the limit §2.3 states.
In the table: Arm A = Every company where an insider bought · Arm B = Three or more different insiders bought.
| # | Window | Paired bars | Arm A | Arm B | Δ | Leader | The twenty biggest buys |
|---|---|---|---|---|---|---|---|
| 1 | 2006-04-04 → 2007-03-30 | 249 | +7.9% | -7.8% | +15.6 pp | Arm A | -1.6% |
| 2 | 2007-04-03 → 2008-03-31 | 250 | -9.1% | -14.0% | +4.9 pp | Arm A | -15.0% |
| 3 | 2008-04-02 → 2009-04-01 | 253 | -41.8% | -51.1% | +9.4 pp | Arm A | -49.0% |
| 4 | 2009-04-02 → 2010-04-01 | 252 | +76.3% | +86.7% | -10.4 pp | Arm B | +73.3% |
| 5 | 2010-04-05 → 2011-04-01 | 253 | +18.9% | +8.1% | +10.8 pp | Arm A | +20.0% |
| 6 | 2011-04-04 → 2012-03-30 | 251 | +8.1% | +62.0% | -53.9 pp | Arm B | +7.7% |
| 7 | 2012-04-03 → 2013-04-01 | 248 | +16.8% | +5.4% | +11.4 pp | Arm A | +11.7% |
| 8 | 2013-04-02 → 2014-04-01 | 253 | +23.3% | +39.8% | -16.5 pp | Arm B | +24.1% |
| 9 | 2014-04-02 → 2015-04-01 | 252 | +11.4% | +4.8% | +6.6 pp | Arm A | +16.9% |
| 10 | 2015-04-02 → 2016-03-31 | 251 | -0.4% | -9.6% | +9.1 pp | Arm A | -11.8% |
| 11 | 2016-04-04 → 2017-03-31 | 252 | +22.5% | +24.6% | -2.2 pp | Arm B | +20.4% |
| 12 | 2017-04-04 → 2018-03-29 | 249 | +2.9% | -4.5% | +7.4 pp | Arm A | -4.2% |
| 13 | 2018-04-03 → 2019-04-01 | 251 | +5.8% | +34.1% | -28.3 pp | Arm B | +7.8% |
| 14 | 2019-04-02 → 2020-03-31 | 252 | -22.6% | -27.5% | +5.0 pp | Arm A | -20.0% |
| 15 | 2020-04-02 → 2021-04-01 | 252 | +92.5% | +86.1% | +6.4 pp | Arm A | +93.0% |
| 16 | 2021-04-05 → 2022-04-01 | 253 | +8.8% | +12.9% | -4.1 pp | Arm B | -2.3% |
| 17 | 2022-04-04 → 2023-03-31 | 250 | -5.9% | -14.7% | +8.7 pp | Arm A | -11.0% |
| 18 | 2023-04-04 → 2024-03-28 | 248 | +17.0% | +18.6% | -1.6 pp | Arm B | +8.1% |
| 19 | 2024-04-02 → 2025-04-01 | 251 | +5.7% | +4.7% | +1.0 pp | Arm A | +3.9% |
| 20 | 2025-04-02 → 2026-04-01 | 251 | +13.4% | +6.6% | +6.9 pp | Arm A | +9.7% |
Paired Sharpe of the difference track: -0.05 · block bootstrap (2000 paths, block 10, seed 1234): P(Every company where an insider bought beats Three or more different insiders bought) = 39.0%.
Window win-rate. Every company where an insider bought led 13 of 20 windows (65.0%), Three or more different insiders bought led 7, yet the mean window gap runs the other way: -0.70 pp toward Three or more different insiders bought. Every company where an insider bought wins more often and smaller; Three or more different insiders bought wins less often and larger. The count and the mean answer different questions, and neither settles the comparison by itself. Widest single window: 2011 at -53.9 pp.
| Period | Windows | Every company where an insider bought | Three or more different insiders bought | Mean gap | Every company where an insider bought led |
|---|---|---|---|---|---|
| All windows | 20 | +12.57% | +13.26% | -0.70 pp | 13/20 |
| Before 2010 | 4 | +8.32% | +3.43% | +4.88 pp | 3/4 |
| 2010 onward | 16 | +13.63% | +15.72% | -2.09 pp | 10/16 |
The two eras disagree by 6.97 pp. The pooled figure is therefore not a standing property of either method, it is dominated by the later period. Read the two rows, not the average.
3 The circuit
The strategy is a circuit of platform primitives, frozen when the study is registered. Below is the circuit as wired on the canvas, the objective it encodes and how the search runs through it, followed by the mathematics each primitive actually computes, the same formulas the execution engine runs. The complete parameterisation is preserved in the study ledger (Appendix A).
The sentence below is the registration record, generated when the circuit was registered and printed verbatim; the authored description of the design is Section 1.
A COMPARATIVE study: Every company where an insider bought vs Three or more different insiders bought, walked on the same registered out-of-sample windows. Every company where an insider bought: S&P 500, rebalanced quarterly across the selected basket, and run out-of-sample from the anchor: anything the design estimates from history, where it estimates at all, is re-estimated at each anchor from pre-anchor data only, and the walk advances through registered out-of-sample windows; its disposition is the realized forward path versus the benchmark. Three or more different insiders bought: S&P 500, rebalanced quarterly across the selected basket, and run out-of-sample from the anchor: anything the design estimates from history, where it estimates at all, is re-estimated at each anchor from pre-anchor data only, and the walk advances through registered out-of-sample windows; its disposition is the realized forward path versus the benchmark. The arms differ in: Insider buying, At least this many buyers: 1 → 3. The contrast under test: whether Every company where an insider bought generates better risk-adjusted returns than Three or more different insiders bought over the identical out-of-sample windows.
Every block in this study is a card from the platform's catalog: the Universe card's S&P 500 as it stood on each date, the SEC insider buying card, the Portfolio Forward Test re-picking every quarter with its Transaction Cost card.
Envelopes show counts, ratios, dates, and the parameters the author chose. Full price and per-name data series are not republished: the underlying market data is licensed to QuanterLab. Point figures quoted in the prose, a named holding's return over a stated span, are summary facts derived from public market prices, not redistributed series.
The objective and the search
Every company where an insider bought
| Universe | S&P 500 index constituents. |
|---|---|
| Validation & out-of-sample | portfolio forward test (holds the weights it is given, re-set at each rebalance) (1y horizon from the anchor, quarterly rebalance, dividends counted); overlays: Transaction Cost. |
| Other components | Sec: Insider buying. |
Three or more different insiders bought
The specification is identical to Every company where an insider bought's table above, row for row; the one registered difference between the arms is itemized below.
What differs between the arms, one difference; the comparison is clean:
- paramInsider buying, At least this many buyers: 1 → 3
Companion book. The twenty biggest buys comes from a companion run of the identical configuration on its own registered anchor schedule. Its results run through this paper's tables under its own name.
Everything else is held identical, so an out-of-sample gap between the arms is attributable to this one change.
Cost elements are wired into the circuit, the realised drag is reported per step in Appendix B.
Show the mathematics, 4 primitives, formulas and parity notes
3.1 Universe
The starting set of tickers, resolved point-in-time from the index change-log, so names delisted or removed later still compete on the dates they traded.
Before any math, you need a list of stocks. An index preset (S&P 500, Nasdaq-100, Dow 30) is reconstructed as it stood ON your anchor date by replaying the historical add/drop change-log backwards, so a 2018 backtest sees the 2018 membership, not today's winners.
Start from today's constituents and un-apply every membership change after the anchor t:
\mathcal{U}(t) = \mathcal{U}_{\text{now}} \;\ominus\; \{\text{adds after } t\} \;\oplus\; \{\text{drops after } t\}3.2 Sec Insider Buying
The companies whose own insiders bought, counted by the day each filing became public.
For each company in the list, the different insiders (officers, directors, owners of a tenth of the company, or only the CEO or CFO) who bought its shares with their own money in the 30, 60 or 90 days up to the run date, counted by the day each Form 4 or 5 became public. A buyer counts once however many purchases, and only when they put in at least the smallest purchase over the look-back. Purchases under a pre-planned 10b5-1 plan are left out unless you count them. It keeps every company with enough buyers, or ranks them by the number of buyers or by the dollars bought and keeps the top. Each company is matched by its SEC number, and a ticker that belonged to another company then is left out.
n_i(t)=\Big|\Big\{o:\ \textstyle\sum_{k\in P_{i,o}(t)} v_k \ge v_{\min}\Big\}\Big|,\qquad P_{i,o}(t)=\{k:\ t-L< d_k\le t\}V_i(t)=\textstyle\sum_{o:\,n\text{ counts }o}\ \sum_{k\in P_{i,o}(t)} v_k3.3 Portfolio Backtest
Replay the portfolio forward, rebalanced, point-in-time, with costs.
Holds the basket and rebalances on schedule, re-selecting and re-optimizing point-in-time at each rebalance (so it only ever uses information available then), and reports the equity curve, Sharpe, drawdown and trade stats, optionally net of cost and risk overlays.
E_t = E_{t-1}\big(1 + \mathbf w_{t}^{\top}\mathbf r_t - \text{costs}_t\big)\text{DD}_t = \frac{E_t}{\max_{\tau\le t}E_\tau} - 1, \qquad \text{MaxDD} = \min_t \text{DD}_t\text{charge}_t \;=\; \text{loan}_t \cdot \frac{\text{spread}}{252}, \qquad \text{loan}_t = \begin{cases}\max(0,\,-\text{cash}_t) & \text{institutional (netted)}\\ \max(0,\,\text{long MV}_t - E_t) & \text{retail (no netting)}\end{cases}\mathbf w_k = \{\, w_{k,i} : i \in \text{held} \,\}, \qquad \text{cash}_k = 1 - \textstyle\sum_{i \in \text{held}} w_{k,i}3.4 Transaction Cost
Charge for trading, slippage + commission on every turn.
Real trading isn't free. This deducts a cost proportional to how much you trade (turnover), in basis points, so the backtest reflects net, not gross, performance.
\text{cost}_t = \frac{\text{bps}}{10{,}000}\;\times\;\text{turnover}_t, \qquad \text{turnover}_t = \tfrac12\sum_i \lvert w_{i,t}-w_{i,t^-}\rvert4 Projection calibration, pooled across the walk
Every rebalance carried a Monte Carlo cone and a 95% VaR estimated before the segment it is scored against. Two questions, pooled over the whole study: did realized outcomes land inside the band as often as the band claims, and were VaR breaches as frequent as 5%?
This section is produced by the forward tester itself: every portfolio backtest fits the cone and the VaR estimate at each rebalance and scores them against the segment that followed. It does not require, and this circuit does not contain, a Monte Carlo primitive; that primitive is a separate, standalone analysis.
| Arm | Steps | Rebalances | In band | Coverage | Expected | VaR days | Breach rate | Expected |
|---|---|---|---|---|---|---|---|---|
| Every company where an insider bought | 20 | 95 | 74 / 80 | 92.5% ±2.94 | 90.0% | 4826 | 5.82% ±0.337 | 5.0% |
| Three or more different insiders bought | 20 | 95 | 69 / 77 | 89.6% ±3.48 | 90.0% | 4703 | 6.38% ±0.356 | 5.0% |
| The twenty biggest buys (companion run) | 20 | 95 | 70 / 80 | 87.5% ±3.7 | 90.0% | 4888 | 6.08% ±0.342 | 5.0% |
± values are binomial standard errors on the estimate. A coverage figure below the expected band means the projection was over-confident; a breach rate above 5% means the same of the risk model. Both forecasts used only data prior to the segment scored.
5 Discussion
5.1 Interpretation
The picture and the baskets say two different things, and both are useful. Seen as a crowd, insiders behave like careful bargain hunters: they buy more when prices fall, and their biggest crowds came close to the market's lowest points. Seen one company at a time, their purchases did not lead to better returns than holding the whole index.
A few reasons fit what we saw. Insiders often buy long before the bottom. Part of that is judgement: a fall looks like a bargain to people who know the company well. Part of it is communication: a purchase in the middle of a fall is seen by everyone who follows the reports, and it tells shareholders that the people running the company still believe in it. A purchase made to reassure is not a bet on the bottom, so a basket that follows it can carry the rest of the fall. The purchases are also public within days, so whatever they say is no secret by the time anyone else can act on it. And in large companies the amounts are small next to the company's size, often between ten and twenty dollars for every million the company is worth, which reads more like a vote of confidence than a bet on news.
Asking for more insiders to agree, or for the biggest purchases, made the baskets smaller and the swings larger. A short list of companies where insiders crowd in is often a list of companies that have just fallen hard, and some of them keep falling.
This is where the four words of the title meet. An insider's purchase is an investment, and it is also a message to the market, which is why the rules guard against manipulation: a purchase may tell the market something, but it may not be made to mislead it. The protection for everyone else is that the purchase is public within two business days and may not rest on secret news. The liability is the insider's own: any quick profit inside six months goes back to the company, so an insider who wants to send a signal has to put his own money at risk for months. What is left is what the public can see: people who know their company well, putting their own money in when prices are low. That is worth knowing, most of all as a picture of the whole market's mood, but on its own it was not an edge in the large companies of the S&P 500 over these twenty years.
5.2 Limitations
Before 2015 the data links about two in three of the index's companies to their SEC filings, so in those years the count is taken among the linked companies and the baskets can only pick from them. Reading the crowds of Figure 2 against the market's lows describes twenty years of history; it was not a test set up in advance, and a handful of crowds is too few to build a rule on.
References
- Seyhun, H. N. (1988). The information content of aggregate insider trading. Journal of Business, 61(1), 1-24.
- Lakonishok, J., and Lee, I. (2001). Are insider trades informative? Review of Financial Studies, 14(1), 79-111.
- Jeng, L. A., Metrick, A., and Zeckhauser, R. (2003). Estimating the returns to insider trading: a performance-evaluation perspective. Review of Economics and Statistics, 85(2), 453-471.
- Cohen, L., Malloy, C., and Pomorski, L. (2012). Decoding inside information. Journal of Finance, 67(3), 1009-1043.
- Securities Exchange Act of 1934, Section 16 (reports and the six-month rule), 15 U.S.C. 78p, and SEC Rule 16a-1 (who is an officer).
- SEC (2002). Ownership reports and trading by officers, directors and principal security holders: Form 4 within two business days.
- SEC (2022). Rule 10b5-1 and insider trading: the amendments on pre-planned trading plans (press release 2022-222).
- SEC Regulation FD (2000), 17 C.F.R. 243.100: no selective disclosure to chosen investors.
- Dirks v. SEC, 463 U.S. 646 (1983); Salman v. United States, 580 U.S. 39 (2016).
- Berkshire Hathaway (2017). News release on the sale of Wells Fargo shares, 12 April 2017.
- Berkshire Hathaway annual meeting, morning session, 4 May 2019 (CNBC archive).
- Federal Trade Commission (2021). FTC fines Capital One CEO Richard Fairbank for violating antitrust laws.
- National Bureau of Economic Research. US business cycle expansions and contractions (the dates of peaks and troughs).
- SEC (2011). Raj Rajaratnam sentenced; and United States v. Rajaratnam.
Appendix A Reproducibility in QuanterLab
Each step is backed by a frozen run report. The study is re-derivable from the ledger below.
| # | Commit | Report | Anchor | OOS window |
|---|---|---|---|---|
| 1 | 82e8fea4704d | 17073 | 2006-04-01 | 2006-04-03 → 2007-03-30 |
| 2 | 30826f610fa5 | 17074 | 2007-04-01 | 2007-04-02 → 2008-03-31 |
| 3 | c970048d5eca | 17075 | 2008-04-01 | 2008-04-01 → 2009-04-01 |
| 4 | b81050bad46f | 17076 | 2009-04-01 | 2009-04-01 → 2010-04-01 |
| 5 | c173f3299ca3 | 17077 | 2010-04-01 | 2010-04-01 → 2011-04-01 |
| 6 | 4d3ef424d4e8 | 17078 | 2011-04-01 | 2011-04-01 → 2012-03-30 |
| 7 | 102b973fac26 | 17079 | 2012-04-01 | 2012-04-02 → 2013-04-01 |
| 8 | 73c6c6c27aec | 17080 | 2013-04-01 | 2013-04-01 → 2014-04-01 |
| 9 | 5a3ba3d630c2 | 17081 | 2014-04-01 | 2014-04-01 → 2015-04-01 |
| 10 | 4d83caa68131 | 17082 | 2015-04-01 | 2015-04-01 → 2016-03-31 |
| 11 | 01d9986537cc | 17083 | 2016-04-01 | 2016-04-01 → 2017-03-31 |
| 12 | b505b26b0f90 | 17084 | 2017-04-01 | 2017-04-03 → 2018-03-29 |
| 13 | 0872e8f57a64 | 17085 | 2018-04-01 | 2018-04-02 → 2019-04-01 |
| 14 | 42c4be4e1b6d | 17086 | 2019-04-01 | 2019-04-01 → 2020-03-31 |
| 15 | 3dcddc440762 | 17087 | 2020-04-01 | 2020-04-01 → 2021-04-01 |
| 16 | 21767a29d9b7 | 17088 | 2021-04-01 | 2021-04-01 → 2022-04-01 |
| 17 | ff1b2cff8cfe | 17089 | 2022-04-01 | 2022-04-01 → 2023-03-31 |
| 18 | 20d8b115b255 | 17090 | 2023-04-01 | 2023-04-03 → 2024-03-28 |
| 19 | ddb48d6425d8 | 17091 | 2024-04-01 | 2024-04-01 → 2025-04-01 |
| 20 | 9430d2277e66 | 17092 | 2025-04-01 | 2025-04-01 → 2026-04-01 |
The methods the platform implements, for every study made on it, rest on these works.
- Gelman, A., & Loken, E. (2013). The garden of forking paths: Why multiple comparisons can be a problem, even when there is no “fishing expedition.” Working paper, Columbia University.
- Harvey, C. R., Liu, Y., & Zhu, H. (2016). … and the Cross-Section of Expected Returns. Review of Financial Studies, 29(1), 5–68. doi:10.1093/rfs/hhv059
- Lo, A. W. (2002). The Statistics of Sharpe Ratios. Financial Analysts Journal, 58(4), 36–52. doi:10.2469/faj.v58.n4.2453
Appendix A2 Registration record
What this record does and does not establish. Every window in this study is historical: the data existed before the study began, so this is sequential registration on past windows, not pre-registration in the clinical-trial sense, and no procedure could make it so. What the platform does enforce is order, each step's specification was frozen and hashed before that step was scored, and the walk cannot advance past a step that was never run or close one with a result registered for a different window. The two timestamp columns below are the evidence: read them together and each registration precedes its own run, and each run precedes the next registration. A study whose registrations all post-date its runs would show it here. Wall-clock spacing between registrations varies with the author's schedule and queue latency; the ordering, not the tempo, is the claim.
“A COMPARATIVE study: Every company where an insider bought vs Three or more different insiders bought, walked on the same registered out-of-sample windows. Every company where an insider bought: S&P 500, rebalanced quarterly across the selected basket, and run out-of-sample from the anchor: anything the design estimates from history, where it estimates at all, is re-estimated at each anchor from pre-anchor data only, and the walk advances through registered out-of-sample windows; its disposition is the realized forward path versus the benchmark. Three or more different insiders bought: S&P 500, rebalanced quarterly across the selected basket, and run out-of-sample from the anchor: anything the design estimates from history, where it estimates at all, is re-estimated at each anchor from pre-anchor data only, and the walk advances through registered out-of-sample windows; its disposition is the realized forward path versus the benchmark. The arms differ in: Insider buying, At least this many buyers: 1 → 3. The contrast under test: whether Every company where an insider bought generates better risk-adjusted returns than Three or more different insiders bought over the identical out-of-sample windows.”
The same hypothesis was registered independently at every step, hashed before each step's out-of-sample window was scored:
| # | Anchor | Registered at (UTC) | Run completed (UTC) |
|---|---|---|---|
| 1 | 2006-04-01 | 2026-11-10 13:36:00 | 2026-11-10 13:39:13 |
| 2 | 2007-04-01 | 2026-11-10 13:39:13 | 2026-11-10 13:40:25 |
| 3 | 2008-04-01 | 2026-11-10 13:40:25 | 2026-11-10 13:42:02 |
| 4 | 2009-04-01 | 2026-11-10 13:42:02 | 2026-11-10 13:42:26 |
| 5 | 2010-04-01 | 2026-11-10 13:42:26 | 2026-11-10 13:42:50 |
| 6 | 2011-04-01 | 2026-11-10 13:42:51 | 2026-11-10 13:43:27 |
| 7 | 2012-04-01 | 2026-11-10 13:43:27 | 2026-11-10 13:44:03 |
| 8 | 2013-04-01 | 2026-11-10 13:44:03 | 2026-11-10 13:44:27 |
| 9 | 2014-04-01 | 2026-11-10 13:44:28 | 2026-11-10 13:45:04 |
| 10 | 2015-04-01 | 2026-11-10 13:45:04 | 2026-11-10 13:45:52 |
| 11 | 2016-04-01 | 2026-11-10 13:45:52 | 2026-11-10 13:47:17 |
| 12 | 2017-04-01 | 2026-11-10 13:47:17 | 2026-11-10 13:47:53 |
| 13 | 2018-04-01 | 2026-11-10 13:47:53 | 2026-11-10 13:48:30 |
| 14 | 2019-04-01 | 2026-11-10 13:48:30 | 2026-11-10 13:48:54 |
| 15 | 2020-04-01 | 2026-11-10 13:48:54 | 2026-11-10 13:49:30 |
| 16 | 2021-04-01 | 2026-11-10 13:49:30 | 2026-11-10 13:49:55 |
| 17 | 2022-04-01 | 2026-11-10 13:49:55 | 2026-11-10 13:50:31 |
| 18 | 2023-04-01 | 2026-11-10 13:50:31 | 2026-11-10 13:50:55 |
| 19 | 2024-04-01 | 2026-11-10 13:50:55 | 2026-11-10 13:51:20 |
| 20 | 2025-04-01 | 2026-11-10 13:51:20 | 2026-11-10 13:51:44 |
The companion comparison
This paper reads a second registered study beside its own. Its registration is printed here from its own record, in the same form as the table above: the hypothesis as it was registered, the day it was first locked, the time each window was registered and run, and what each window returned.
The twenty biggest buys
Its hypothesis was first locked on 10 November 2026, before its first window was run that day.
The same hypothesis was registered again, unchanged, at each of its 20 windows:
“A COMPARATIVE study: Every company where an insider bought vs The 20 where insiders spent the most, walked on the same registered out-of-sample windows. Every company where an insider bought: S&P 500, rebalanced quarterly across the selected basket, and run out-of-sample from the anchor: anything the design estimates from history, where it estimates at all, is re-estimated at each anchor from pre-anchor data only, and the walk advances through registered out-of-sample windows; its disposition is the realized forward path versus the benchmark. The 20 where insiders spent the most: S&P 500, rebalanced quarterly across the selected basket, and run out-of-sample from the anchor: anything the design estimates from history, where it estimates at all, is re-estimated at each anchor from pre-anchor data only, and the walk advances through registered out-of-sample windows; its disposition is the realized forward path versus the benchmark. The arms differ in: Insider buying, Rank by: Number of buyers → Value bought; Insider buying, Use: Keep every buyer → Rank them. The contrast under test: whether Every company where an insider bought generates better risk-adjusted returns than The 20 where insiders spent the most over the identical out-of-sample windows.”
| # | Anchor | Registered at (UTC) | Run completed (UTC) |
|---|---|---|---|
| 1 | 2006-04-01 | 2026-11-10 13:51:58 | 2026-11-10 13:52:10 |
| 2 | 2007-04-01 | 2026-11-10 13:52:10 | 2026-11-10 13:52:22 |
| 3 | 2008-04-01 | 2026-11-10 13:52:22 | 2026-11-10 13:52:47 |
| 4 | 2009-04-01 | 2026-11-10 13:52:47 | 2026-11-10 13:52:59 |
| 5 | 2010-04-01 | 2026-11-10 13:52:59 | 2026-11-10 13:53:11 |
| 6 | 2011-04-01 | 2026-11-10 13:53:11 | 2026-11-10 13:53:24 |
| 7 | 2012-04-01 | 2026-11-10 13:53:24 | 2026-11-10 13:53:36 |
| 8 | 2013-04-01 | 2026-11-10 13:53:36 | 2026-11-10 13:53:48 |
| 9 | 2014-04-01 | 2026-11-10 13:53:48 | 2026-11-10 13:54:00 |
| 10 | 2015-04-01 | 2026-11-10 13:54:01 | 2026-11-10 13:54:13 |
| 11 | 2016-04-01 | 2026-11-10 13:54:13 | 2026-11-10 13:54:25 |
| 12 | 2017-04-01 | 2026-11-10 13:54:25 | 2026-11-10 13:54:37 |
| 13 | 2018-04-01 | 2026-11-10 13:54:37 | 2026-11-10 13:55:02 |
| 14 | 2019-04-01 | 2026-11-10 13:55:02 | 2026-11-10 13:55:14 |
| 15 | 2020-04-01 | 2026-11-10 13:55:14 | 2026-11-10 13:55:38 |
| 16 | 2021-04-01 | 2026-11-10 13:55:38 | 2026-11-10 13:55:51 |
| 17 | 2022-04-01 | 2026-11-10 13:55:51 | 2026-11-10 13:56:15 |
| 18 | 2023-04-01 | 2026-11-10 13:56:15 | 2026-11-10 13:56:27 |
| 19 | 2024-04-01 | 2026-11-10 13:56:27 | 2026-11-10 13:56:40 |
| 20 | 2025-04-01 | 2026-11-10 13:56:40 | 2026-11-10 13:56:52 |
| # | Anchor | Every company where an insider bought | The 20 where insiders spent the most |
|---|---|---|---|
| 1 | 2006-04-01 | +7.7% | -1.6% |
| 2 | 2007-04-01 | -9.3% | -15.0% |
| 3 | 2008-04-01 | -41.9% | -49.0% |
| 4 | 2009-04-01 | +76.0% | +73.3% |
| 5 | 2010-04-01 | +18.7% | +20.0% |
| 6 | 2011-04-01 | +7.9% | +7.7% |
| 7 | 2012-04-01 | +16.6% | +11.7% |
| 8 | 2013-04-01 | +23.1% | +24.1% |
| 9 | 2014-04-01 | +11.2% | +16.9% |
| 10 | 2015-04-01 | -0.6% | -11.8% |
| 11 | 2016-04-01 | +22.3% | +20.4% |
| 12 | 2017-04-01 | +2.7% | -4.2% |
| 13 | 2018-04-01 | +5.6% | +7.8% |
| 14 | 2019-04-01 | -22.7% | -20.0% |
| 15 | 2020-04-01 | +92.1% | +93.0% |
| 16 | 2021-04-01 | +8.6% | -2.3% |
| 17 | 2022-04-01 | -6.1% | -11.0% |
| 18 | 2023-04-01 | +16.8% | +8.1% |
| 19 | 2024-04-01 | +5.5% | +3.9% |
| 20 | 2025-04-01 | +13.2% | +9.7% |
Appendix B Per-step diagnostics
Realized in the projection tables below is the risk engine scoring its own forecast: the buy-and-hold return of the segment that followed each rebalance, on the same gross basis the cone was projected on. It is deliberately not the charged, calendar-window total return the study’s tables print, so the two will not reconcile line by line; the cone and its outcome share one basis, which is what a calibration test requires. Each row names its segment’s span so a boundary session is visible.
Names held is the union across the window: the count of distinct instruments the book touched between the window’s first and last session, not the number it held at one time. A book that rotates monthly touches more names than it holds.
What each step's run actually did beyond its return: the portfolio book's rebalancing and cost drag. Harvested from the frozen run reports, present where the circuit produced them. Cost drag is the gap between the step's return before and after its trading costs, in percentage points of the step's starting capital, so on a book that trades every session and compounds it can exceed the step's own net return.
Open the full per-step grid (20 steps: every rebalance, per window)
Step 1 · 2006-04-03 → 2007-03-30
Every company where an insider bought
Portfolio book, rebalanced quarterly · 5 constructions · 136 names held · selection: reselect · 0.0% in cash · turnover 5.4× · cost drag 0.92% · 3 names dropped at load (139 selected, 136 held across the window), weights renormalised onto the rest
Projection accuracy, realized outcome fell inside the P5–P95 cone in 100.0% of 4 scored rebalances (a well-calibrated 90% band contains ~90.0%) · 95% VaR breached on 5.69% of 246 days (expected ~5.0%)
| Rebalance | P5 | Median | P95 | Realized | In band | VaR 95 (1d) | Breaches |
|---|---|---|---|---|---|---|---|
| 2006-04-01 → 2006-07-01 | -6.5971% | 2.2873% | 12.0759% | -1.2485% | yes | 1.0982% | 7 / 62 |
| 2006-07-01 → 2006-10-01 | -6.3604% | 2.8472% | 13.0218% | 2.8096% | yes | 1.1198% | 2 / 62 |
| 2006-10-01 → 2007-01-01 | -5.936% | 3.6987% | 14.3851% | 5.2147% | yes | 1.2075% | 1 / 62 |
| 2007-01-01 → 2007-04-01 | -6.9058% | 2.7013% | 12.2865% | 0.2102% | yes | 1.1074% | 4 / 60 |
| 2007-04-01 | no segment follows this rebalance, not scored | ||||||
Three or more different insiders bought
Portfolio book, rebalanced quarterly · 5 constructions · 15 names held · selection: reselect · 0.0% in cash · turnover 6.4× · cost drag 1.09%
Projection accuracy, realized outcome fell inside the P5–P95 cone in 100.0% of 4 scored rebalances (a well-calibrated 90% band contains ~90.0%) · 95% VaR breached on 4.07% of 246 days (expected ~5.0%)
| Rebalance | P5 | Median | P95 | Realized | In band | VaR 95 (1d) | Breaches |
|---|---|---|---|---|---|---|---|
| 2006-04-01 → 2006-07-01 | -9.2304% | 0.2523% | 10.7896% | -5.3052% | yes | 1.2355% | 3 / 62 |
| 2006-07-01 → 2006-10-01 | -11.0159% | -1.511% | 9.0735% | 3.0694% | yes | 1.2274% | 2 / 62 |
| 2006-10-01 → 2007-01-01 | -9.4713% | 2.124% | 15.2853% | 8.4012% | yes | 1.3164% | 1 / 62 |
| 2007-01-01 → 2007-04-01 | -15.1603% | 2.726% | 22.2255% | -14.9802% | yes | 2.0998% | 4 / 60 |
| 2007-04-01 | no segment follows this rebalance, not scored | ||||||
Step 2 · 2007-04-02 → 2008-03-31
Every company where an insider bought
Portfolio book, rebalanced quarterly · 4 constructions · 147 names held · selection: reselect · 0.0% in cash · turnover 5.0× · cost drag 0.86% · 4 names dropped at load (151 selected, 147 held across the window), weights renormalised onto the rest
Projection accuracy, realized outcome fell inside the P5–P95 cone in 100.0% of 4 scored rebalances (a well-calibrated 90% band contains ~90.0%) · 95% VaR breached on 17.41% of 247 days (expected ~5.0%)
| Rebalance | P5 | Median | P95 | Realized | In band | VaR 95 (1d) | Breaches |
|---|---|---|---|---|---|---|---|
| 2007-04-01 → 2007-07-01 | -6.3937% | 2.849% | 13.0662% | 5.7401% | yes | 1.1556% | 5 / 62 |
| 2007-07-01 → 2007-10-01 | -5.6479% | 3.5734% | 13.7575% | -3.4593% | yes | 1.1163% | 14 / 62 |
| 2007-10-01 → 2008-01-01 | -9.6349% | 1.536% | 12.925% | -6.944% | yes | 1.3476% | 10 / 63 |
| 2008-01-01 → window end | -12.3585% | 0.0628% | 12.8678% | -5.9263% | yes | 1.5983% | 14 / 60 |
Three or more different insiders bought
Portfolio book, rebalanced quarterly · 4 constructions · 25 names held · selection: reselect · 25.1% in cash · turnover 4.9× · cost drag 0.83%
Projection accuracy, realized outcome fell inside the P5–P95 cone in 100.0% of 3 scored rebalances (a well-calibrated 90% band contains ~90.0%) · 95% VaR breached on 19.46% of 185 days (expected ~5.0%)
| Rebalance | P5 | Median | P95 | Realized | In band | VaR 95 (1d) | Breaches |
|---|---|---|---|---|---|---|---|
| 2007-04-01 → 2007-07-01 | -8.5008% | 4.5741% | 19.6101% | 6.0206% | yes | 1.5729% | 4 / 62 |
| 2007-07-01 | no segment follows this rebalance, not scored | ||||||
| 2007-10-01 → 2008-01-01 | -12.1257% | 0.0214% | 12.5594% | -7.7063% | yes | 1.4331% | 13 / 63 |
| 2008-01-01 → window end | -18.0951% | -2.5519% | 14.1127% | -12.8919% | yes | 1.9954% | 19 / 60 |
Step 3 · 2008-04-01 → 2009-04-01
Every company where an insider bought
Portfolio book, rebalanced quarterly · 5 constructions · 221 names held · selection: reselect · 0.0% in cash · turnover 5.2× · cost drag 0.88% · 4 names dropped at load (225 selected, 221 held across the window), weights renormalised onto the rest
Projection accuracy, realized outcome fell inside the P5–P95 cone in 75.0% of 4 scored rebalances (a well-calibrated 90% band contains ~90.0%) · 95% VaR breached on 22.89% of 249 days (expected ~5.0%)
| Rebalance | P5 | Median | P95 | Realized | In band | VaR 95 (1d) | Breaches |
|---|---|---|---|---|---|---|---|
| 2008-04-01 → 2008-07-01 | -13.8236% | 0.081% | 14.711% | -11.8833% | yes | 1.8276% | 7 / 63 |
| 2008-07-01 → 2008-10-01 | -18.7884% | -3.3125% | 13.3613% | 1.2778% | yes | 2.1678% | 17 / 63 |
| 2008-10-01 → 2009-01-01 | -20.4695% | -0.818% | 21.3117% | -25.3881% | no | 2.5109% | 22 / 63 |
| 2009-01-01 → 2009-04-01 | -29.3533% | -4.4838% | 25.6261% | -14.7741% | yes | 3.3849% | 11 / 60 |
| 2009-04-01 | no segment follows this rebalance, not scored | ||||||
Three or more different insiders bought
Portfolio book, rebalanced quarterly · 5 constructions · 61 names held · selection: reselect · 0.0% in cash · turnover 5.5× · cost drag 0.93% · 1 name dropped at load (62 selected, 61 held across the window), weights renormalised onto the rest
Projection accuracy, realized outcome fell inside the P5–P95 cone in 50.0% of 4 scored rebalances (a well-calibrated 90% band contains ~90.0%) · 95% VaR breached on 23.69% of 249 days (expected ~5.0%)
| Rebalance | P5 | Median | P95 | Realized | In band | VaR 95 (1d) | Breaches |
|---|---|---|---|---|---|---|---|
| 2008-04-01 → 2008-07-01 | -24.4487% | -4.5994% | 18.02% | -26.2636% | no | 2.9339% | 7 / 63 |
| 2008-07-01 → 2008-10-01 | -26.1909% | -8.0139% | 12.4426% | 10.4035% | yes | 2.7274% | 19 / 63 |
| 2008-10-01 → 2009-01-01 | -33.0645% | -5.4096% | 29.6691% | -34.4843% | no | 3.5714% | 21 / 63 |
| 2009-01-01 → 2009-04-01 | -36.66% | -6.8287% | 32.2985% | -12.5549% | yes | 4.2757% | 12 / 60 |
| 2009-04-01 | no segment follows this rebalance, not scored | ||||||
Step 4 · 2009-04-01 → 2010-04-01
Every company where an insider bought
Portfolio book, rebalanced quarterly · 5 constructions · 156 names held · selection: reselect · 0.0% in cash · turnover 9.4× · cost drag 1.59% · 2 names dropped at load (158 selected, 156 held across the window), weights renormalised onto the rest
Projection accuracy, realized outcome fell inside the P5–P95 cone in 100.0% of 4 scored rebalances (a well-calibrated 90% band contains ~90.0%) · 95% VaR breached on 1.21% of 248 days (expected ~5.0%)
| Rebalance | P5 | Median | P95 | Realized | In band | VaR 95 (1d) | Breaches |
|---|---|---|---|---|---|---|---|
| 2009-04-01 → 2009-07-01 | -35.1728% | -8.3012% | 29.9706% | 28.7974% | yes | 4.1664% | 3 / 62 |
| 2009-07-01 → 2009-10-01 | -30.2749% | -3.0766% | 30.8868% | 15.5609% | yes | 3.6327% | 0 / 63 |
| 2009-10-01 → 2010-01-01 | -30.7071% | -1.8508% | 34.8329% | 8.9515% | yes | 3.7988% | 0 / 63 |
| 2010-01-01 → 2010-04-01 | -30.1717% | -1.3714% | 34.9759% | 8.2709% | yes | 3.7862% | 0 / 60 |
| 2010-04-01 | no segment follows this rebalance, not scored | ||||||
Three or more different insiders bought
Portfolio book, rebalanced quarterly · 5 constructions · 24 names held · selection: reselect · 0.0% in cash · turnover 9.8× · cost drag 1.67% · 1 name dropped at load (25 selected, 24 held across the window), weights renormalised onto the rest
Projection accuracy, realized outcome fell inside the P5–P95 cone in 100.0% of 4 scored rebalances (a well-calibrated 90% band contains ~90.0%) · 95% VaR breached on 1.21% of 248 days (expected ~5.0%)
| Rebalance | P5 | Median | P95 | Realized | In band | VaR 95 (1d) | Breaches |
|---|---|---|---|---|---|---|---|
| 2009-04-01 → 2009-07-01 | -41.0288% | -10.3427% | 36.6434% | 31.0037% | yes | 5.1621% | 3 / 62 |
| 2009-07-01 → 2009-10-01 | -53.1929% | -6.0537% | 77.3596% | 18.8686% | yes | 7.8694% | 0 / 63 |
| 2009-10-01 → 2010-01-01 | -49.555% | -7.3603% | 61.2777% | -0.756% | yes | 6.7961% | 0 / 63 |
| 2010-01-01 → 2010-04-01 | -48.4968% | -4.1379% | 68.5695% | 20.9911% | yes | 7.1283% | 0 / 60 |
| 2010-04-01 | no segment follows this rebalance, not scored | ||||||
Step 5 · 2010-04-01 → 2011-04-01
Every company where an insider bought
Portfolio book, rebalanced quarterly · 5 constructions · 148 names held · selection: reselect · 0.0% in cash · turnover 6.6× · cost drag 1.13% · 1 name dropped at load (149 selected, 148 held across the window), weights renormalised onto the rest
Projection accuracy, realized outcome fell inside the P5–P95 cone in 100.0% of 4 scored rebalances (a well-calibrated 90% band contains ~90.0%) · 95% VaR breached on 0.4% of 249 days (expected ~5.0%)
| Rebalance | P5 | Median | P95 | Realized | In band | VaR 95 (1d) | Breaches |
|---|---|---|---|---|---|---|---|
| 2010-04-01 → 2010-07-01 | -28.5663% | -0.3048% | 39.4077% | -10.8599% | yes | 4.0169% | 1 / 62 |
| 2010-07-01 → 2010-10-01 | -28.932% | -0.337% | 35.6705% | 11.9162% | yes | 3.7802% | 0 / 63 |
| 2010-10-01 → 2011-01-01 | -27.0579% | 1.4622% | 37.0986% | 11.4348% | yes | 3.6572% | 0 / 63 |
| 2011-01-01 → 2011-04-01 | -19.2755% | 3.8671% | 36.7634% | 4.0691% | yes | 3.155% | 0 / 61 |
| 2011-04-01 | no segment follows this rebalance, not scored | ||||||
Three or more different insiders bought
Portfolio book, rebalanced quarterly · 5 constructions · 18 names held · selection: reselect · 0.0% in cash · turnover 8.8× · cost drag 1.5%
Projection accuracy, realized outcome fell inside the P5–P95 cone in 100.0% of 4 scored rebalances (a well-calibrated 90% band contains ~90.0%) · 95% VaR breached on 0.0% of 249 days (expected ~5.0%)
| Rebalance | P5 | Median | P95 | Realized | In band | VaR 95 (1d) | Breaches |
|---|---|---|---|---|---|---|---|
| 2010-04-01 → 2010-07-01 | -49.4076% | -2.105% | 90.1525% | -7.6386% | yes | 8.3888% | 0 / 62 |
| 2010-07-01 → 2010-10-01 | -48.1826% | -1.9075% | 75.564% | 13.4007% | yes | 7.1625% | 0 / 63 |
| 2010-10-01 → 2011-01-01 | -35.3494% | 0.803% | 51.1541% | 0.0416% | yes | 5.1757% | 0 / 63 |
| 2011-01-01 → 2011-04-01 | -34.4135% | 3.1383% | 69.052% | 1.7417% | yes | 5.1744% | 0 / 61 |
| 2011-04-01 | no segment follows this rebalance, not scored | ||||||
Step 6 · 2011-04-01 → 2012-03-30
Every company where an insider bought
Portfolio book, rebalanced quarterly · 4 constructions · 154 names held · selection: reselect · 0.0% in cash · turnover 4.9× · cost drag 0.84%
Projection accuracy, realized outcome fell inside the P5–P95 cone in 75.0% of 4 scored rebalances (a well-calibrated 90% band contains ~90.0%) · 95% VaR breached on 8.47% of 248 days (expected ~5.0%)
| Rebalance | P5 | Median | P95 | Realized | In band | VaR 95 (1d) | Breaches |
|---|---|---|---|---|---|---|---|
| 2011-04-01 → 2011-07-01 | -13.8691% | 8.0228% | 35.6576% | 0.291% | yes | 2.5828% | 1 / 62 |
| 2011-07-01 → 2011-10-01 | -11.998% | 6.3981% | 26.5112% | -19.8965% | no | 2.0808% | 13 / 63 |
| 2011-10-01 → 2012-01-01 | -16.5861% | 0.7797% | 21.8947% | 20.0872% | yes | 2.5154% | 7 / 62 |
| 2012-01-01 → window end | -14.9837% | 2.4142% | 25.4926% | 10.0416% | yes | 2.597% | 0 / 61 |
Three or more different insiders bought
Portfolio book, rebalanced quarterly · 4 constructions · 28 names held · selection: reselect · 25.4% in cash · turnover 5.6× · cost drag 0.95%
Projection accuracy, realized outcome fell inside the P5–P95 cone in 100.0% of 3 scored rebalances (a well-calibrated 90% band contains ~90.0%) · 95% VaR breached on 3.78% of 185 days (expected ~5.0%)
| Rebalance | P5 | Median | P95 | Realized | In band | VaR 95 (1d) | Breaches |
|---|---|---|---|---|---|---|---|
| 2011-04-01 → 2011-07-01 | -12.5373% | 4.8941% | 25.9324% | 2.0119% | yes | 2.3995% | 0 / 62 |
| 2011-07-01 | no segment follows this rebalance, not scored | ||||||
| 2011-10-01 → 2012-01-01 | -18.9733% | -0.3288% | 22.7536% | 21.1339% | yes | 2.7831% | 7 / 62 |
| 2012-01-01 → window end | -24.0232% | -2.5133% | 27.9729% | 23.3247% | yes | 3.0979% | 0 / 61 |
Step 7 · 2012-04-02 → 2013-04-01
Every company where an insider bought
Portfolio book, rebalanced quarterly · 5 constructions · 172 names held · selection: reselect · 0.0% in cash · turnover 7.0× · cost drag 1.19% · 1 name dropped at load (173 selected, 172 held across the window), weights renormalised onto the rest
Projection accuracy, realized outcome fell inside the P5–P95 cone in 100.0% of 4 scored rebalances (a well-calibrated 90% band contains ~90.0%) · 95% VaR breached on 1.23% of 244 days (expected ~5.0%)
| Rebalance | P5 | Median | P95 | Realized | In band | VaR 95 (1d) | Breaches |
|---|---|---|---|---|---|---|---|
| 2012-04-01 → 2012-07-01 | -15.0704% | 2.7769% | 24.5125% | -4.2077% | yes | 2.4747% | 2 / 62 |
| 2012-07-01 → 2012-10-01 | -18.4573% | 0.1564% | 23.1661% | 4.0097% | yes | 2.6618% | 0 / 62 |
| 2012-10-01 → 2013-01-01 | -12.3094% | 2.78% | 22.2292% | 1.3226% | yes | 1.8769% | 1 / 61 |
| 2013-01-01 → 2013-04-01 | -16.6594% | 0.5337% | 18.0793% | 11.3239% | yes | 2.0866% | 0 / 59 |
| 2013-04-01 | no segment follows this rebalance, not scored | ||||||
Three or more different insiders bought
Portfolio book, rebalanced quarterly · 5 constructions · 23 names held · selection: reselect · 0.0% in cash · turnover 8.5× · cost drag 1.45%
Projection accuracy, realized outcome fell inside the P5–P95 cone in 100.0% of 4 scored rebalances (a well-calibrated 90% band contains ~90.0%) · 95% VaR breached on 1.23% of 244 days (expected ~5.0%)
| Rebalance | P5 | Median | P95 | Realized | In band | VaR 95 (1d) | Breaches |
|---|---|---|---|---|---|---|---|
| 2012-04-01 → 2012-07-01 | -15.7848% | 1.9826% | 23.6361% | -4.455% | yes | 2.3678% | 1 / 62 |
| 2012-07-01 → 2012-10-01 | -21.9261% | 0.2055% | 28.7974% | -0.3423% | yes | 3.0697% | 0 / 62 |
| 2012-10-01 → 2013-01-01 | -19.8572% | -0.2377% | 26.6988% | -1.4161% | yes | 2.7949% | 2 / 61 |
| 2013-01-01 → 2013-04-01 | -25.2992% | 0.7878% | 30.3097% | 9.7694% | yes | 3.4991% | 0 / 59 |
| 2013-04-01 | no segment follows this rebalance, not scored | ||||||
Step 8 · 2013-04-01 → 2014-04-01
Every company where an insider bought
Portfolio book, rebalanced quarterly · 5 constructions · 164 names held · selection: reselect · 0.0% in cash · turnover 7.3× · cost drag 1.24% · 2 names dropped at load (166 selected, 164 held across the window), weights renormalised onto the rest
Projection accuracy, realized outcome fell inside the P5–P95 cone in 100.0% of 4 scored rebalances (a well-calibrated 90% band contains ~90.0%) · 95% VaR breached on 2.01% of 249 days (expected ~5.0%)
| Rebalance | P5 | Median | P95 | Realized | In band | VaR 95 (1d) | Breaches |
|---|---|---|---|---|---|---|---|
| 2013-04-01 → 2013-07-01 | -13.457% | 3.2645% | 21.3185% | 2.7943% | yes | 1.9278% | 2 / 63 |
| 2013-07-01 → 2013-10-01 | -14.2768% | 2.4475% | 20.5315% | 3.856% | yes | 2.0376% | 0 / 63 |
| 2013-10-01 → 2014-01-01 | -12.4495% | 4.9564% | 23.8333% | 9.2198% | yes | 1.9539% | 0 / 63 |
| 2014-01-01 → 2014-04-01 | -8.2128% | 4.2526% | 17.0396% | 3.4073% | yes | 1.4702% | 3 / 60 |
| 2014-04-01 | no segment follows this rebalance, not scored | ||||||
Three or more different insiders bought
Portfolio book, rebalanced quarterly · 5 constructions · 20 names held · selection: reselect · 0.0% in cash · turnover 9.7× · cost drag 1.65% · 1 name dropped at load (21 selected, 20 held across the window), weights renormalised onto the rest
Projection accuracy, realized outcome fell inside the P5–P95 cone in 100.0% of 4 scored rebalances (a well-calibrated 90% band contains ~90.0%) · 95% VaR breached on 1.2% of 249 days (expected ~5.0%)
| Rebalance | P5 | Median | P95 | Realized | In band | VaR 95 (1d) | Breaches |
|---|---|---|---|---|---|---|---|
| 2013-04-01 → 2013-07-01 | -16.0509% | 3.0325% | 24.1978% | 5.2984% | yes | 2.4196% | 1 / 63 |
| 2013-07-01 → 2013-10-01 | -21.5535% | -1.1833% | 21.9762% | 8.5302% | yes | 2.6287% | 0 / 63 |
| 2013-10-01 → 2014-01-01 | -15.5865% | 6.4802% | 31.6015% | 11.1233% | yes | 2.6621% | 0 / 63 |
| 2014-01-01 → 2014-04-01 | -12.8628% | 4.4452% | 23.1332% | 6.5625% | yes | 2.1403% | 2 / 60 |
| 2014-04-01 | no segment follows this rebalance, not scored | ||||||
Step 9 · 2014-04-01 → 2015-04-01
Every company where an insider bought
Portfolio book, rebalanced quarterly · 5 constructions · 150 names held · selection: reselect · 0.0% in cash · turnover 7.3× · cost drag 1.25% · 10 names dropped at load (160 selected, 150 held across the window), weights renormalised onto the rest
Projection accuracy, realized outcome fell inside the P5–P95 cone in 100.0% of 4 scored rebalances (a well-calibrated 90% band contains ~90.0%) · 95% VaR breached on 5.65% of 248 days (expected ~5.0%)
| Rebalance | P5 | Median | P95 | Realized | In band | VaR 95 (1d) | Breaches |
|---|---|---|---|---|---|---|---|
| 2014-04-01 → 2014-07-01 | -6.4059% | 4.9362% | 17.7311% | 2.7595% | yes | 1.4546% | 1 / 62 |
| 2014-07-01 → 2014-10-01 | -6.0219% | 4.9855% | 16.146% | -0.7944% | yes | 1.3067% | 3 / 63 |
| 2014-10-01 → 2015-01-01 | -5.4769% | 4.6788% | 14.8904% | 6.7534% | yes | 1.1829% | 6 / 63 |
| 2015-01-01 → 2015-04-01 | -7.2889% | 3.7483% | 14.911% | 1.5935% | yes | 1.3902% | 4 / 60 |
| 2015-04-01 | no segment follows this rebalance, not scored | ||||||
Three or more different insiders bought
Portfolio book, rebalanced quarterly · 5 constructions · 15 names held · selection: reselect · 24.1% in cash · turnover 6.8× · cost drag 1.16% · 2 names dropped at load (17 selected, 15 held across the window), weights renormalised onto the rest
Projection accuracy, realized outcome fell inside the P5–P95 cone in 100.0% of 3 scored rebalances (a well-calibrated 90% band contains ~90.0%) · 95% VaR breached on 5.32% of 188 days (expected ~5.0%)
| Rebalance | P5 | Median | P95 | Realized | In band | VaR 95 (1d) | Breaches |
|---|---|---|---|---|---|---|---|
| 2014-04-01 → 2014-07-01 | -9.1816% | 2.3843% | 15.5037% | -0.2919% | yes | 1.4736% | 2 / 62 |
| 2014-07-01 → 2014-10-01 | -8.3864% | 4.3132% | 17.4256% | -0.8517% | yes | 1.453% | 2 / 63 |
| 2014-10-01 → 2015-01-01 | -7.6366% | 3.8255% | 15.5162% | 5.3911% | yes | 1.3559% | 6 / 63 |
| 2015-01-01 | no segment follows this rebalance, not scored | ||||||
| 2015-04-01 | no segment follows this rebalance, not scored | ||||||
Step 10 · 2015-04-01 → 2016-03-31
Every company where an insider bought
Portfolio book, rebalanced quarterly · 4 constructions · 192 names held · selection: reselect · 0.0% in cash · turnover 5.1× · cost drag 0.87% · 17 names dropped at load (209 selected, 192 held across the window), weights renormalised onto the rest
Projection accuracy, realized outcome fell inside the P5–P95 cone in 75.0% of 4 scored rebalances (a well-calibrated 90% band contains ~90.0%) · 95% VaR breached on 9.68% of 248 days (expected ~5.0%)
| Rebalance | P5 | Median | P95 | Realized | In band | VaR 95 (1d) | Breaches |
|---|---|---|---|---|---|---|---|
| 2015-04-01 → 2015-07-01 | -7.0618% | 3.4982% | 15.33% | -0.1939% | yes | 1.3738% | 1 / 62 |
| 2015-07-01 → 2015-10-01 | -7.6279% | 3.2006% | 14.1806% | -9.4179% | no | 1.3393% | 9 / 63 |
| 2015-10-01 → 2016-01-01 | -13.1424% | -0.8637% | 11.8433% | 2.9292% | yes | 1.6751% | 5 / 63 |
| 2016-01-01 → window end | -12.0749% | -0.6359% | 11.0419% | 6.2825% | yes | 1.5216% | 9 / 60 |
Three or more different insiders bought
Portfolio book, rebalanced quarterly · 4 constructions · 30 names held · selection: reselect · 0.0% in cash · turnover 6.2× · cost drag 1.06% · 3 names dropped at load (33 selected, 30 held across the window), weights renormalised onto the rest
Projection accuracy, realized outcome fell inside the P5–P95 cone in 100.0% of 4 scored rebalances (a well-calibrated 90% band contains ~90.0%) · 95% VaR breached on 13.31% of 248 days (expected ~5.0%)
| Rebalance | P5 | Median | P95 | Realized | In band | VaR 95 (1d) | Breaches |
|---|---|---|---|---|---|---|---|
| 2015-04-01 → 2015-07-01 | -13.2199% | -0.6736% | 13.776% | -1.6526% | yes | 1.7696% | 2 / 62 |
| 2015-07-01 → 2015-10-01 | -9.7258% | 2.5761% | 15.2531% | -8.8915% | yes | 1.4455% | 10 / 63 |
| 2015-10-01 → 2016-01-01 | -18.0875% | -4.809% | 9.1708% | -3.0628% | yes | 1.8529% | 9 / 63 |
| 2016-01-01 → window end | -21.5573% | -5.8215% | 11.1958% | 2.8735% | yes | 2.4954% | 12 / 60 |
Step 11 · 2016-04-01 → 2017-03-31
Every company where an insider bought
Portfolio book, rebalanced quarterly · 5 constructions · 200 names held · selection: reselect · 0.0% in cash · turnover 5.9× · cost drag 1.0% · 13 names dropped at load (213 selected, 200 held across the window), weights renormalised onto the rest
Projection accuracy, realized outcome fell inside the P5–P95 cone in 100.0% of 4 scored rebalances (a well-calibrated 90% band contains ~90.0%) · 95% VaR breached on 1.2% of 249 days (expected ~5.0%)
| Rebalance | P5 | Median | P95 | Realized | In band | VaR 95 (1d) | Breaches |
|---|---|---|---|---|---|---|---|
| 2016-04-01 → 2016-07-01 | -13.5939% | 0.015% | 14.2887% | 1.7668% | yes | 1.8559% | 2 / 63 |
| 2016-07-01 → 2016-10-01 | -12.2433% | 1.4302% | 15.7517% | 5.1518% | yes | 1.7322% | 1 / 63 |
| 2016-10-01 → 2017-01-01 | -12.7897% | 0.0889% | 14.9614% | 7.289% | yes | 1.6435% | 0 / 62 |
| 2017-01-01 → 2017-04-01 | -10.5878% | 0.5938% | 14.4008% | 4.6417% | yes | 1.6099% | 0 / 61 |
| 2017-04-01 | no segment follows this rebalance, not scored | ||||||
Three or more different insiders bought
Portfolio book, rebalanced quarterly · 5 constructions · 28 names held · selection: reselect · 0.0% in cash · turnover 6.6× · cost drag 1.13% · 3 names dropped at load (31 selected, 28 held across the window), weights renormalised onto the rest
Projection accuracy, realized outcome fell inside the P5–P95 cone in 100.0% of 4 scored rebalances (a well-calibrated 90% band contains ~90.0%) · 95% VaR breached on 3.61% of 249 days (expected ~5.0%)
| Rebalance | P5 | Median | P95 | Realized | In band | VaR 95 (1d) | Breaches |
|---|---|---|---|---|---|---|---|
| 2016-04-01 → 2016-07-01 | -19.2348% | -2.6102% | 15.5201% | -2.8822% | yes | 2.418% | 4 / 63 |
| 2016-07-01 → 2016-10-01 | -19.5388% | -1.5429% | 18.3593% | 8.5754% | yes | 2.4779% | 3 / 63 |
| 2016-10-01 → 2017-01-01 | -16.2564% | -0.8349% | 17.5419% | 16.6745% | yes | 2.0984% | 1 / 62 |
| 2017-01-01 → 2017-04-01 | -10.9461% | -0.4798% | 12.3532% | -0.609% | yes | 1.5364% | 1 / 61 |
| 2017-04-01 | no segment follows this rebalance, not scored | ||||||
Step 12 · 2017-04-03 → 2018-03-29
Every company where an insider bought
Portfolio book, rebalanced quarterly · 5 constructions · 176 names held · selection: reselect · 0.0% in cash · turnover 5.2× · cost drag 0.89% · 8 names dropped at load (184 selected, 176 held across the window), weights renormalised onto the rest
Projection accuracy, realized outcome fell inside the P5–P95 cone in 100.0% of 4 scored rebalances (a well-calibrated 90% band contains ~90.0%) · 95% VaR breached on 4.47% of 246 days (expected ~5.0%)
| Rebalance | P5 | Median | P95 | Realized | In band | VaR 95 (1d) | Breaches |
|---|---|---|---|---|---|---|---|
| 2017-04-01 → 2017-07-01 | -10.3693% | 1.2154% | 14.3783% | 1.0664% | yes | 1.5858% | 1 / 62 |
| 2017-07-01 → 2017-10-01 | -11.4342% | 0.0923% | 13.1993% | -0.8328% | yes | 1.5542% | 2 / 62 |
| 2017-10-01 → 2018-01-01 | -10.7036% | 1.0761% | 14.4922% | 6.1926% | yes | 1.577% | 0 / 62 |
| 2018-01-01 → 2018-04-01 | -9.874% | 1.2143% | 12.4668% | -6.7301% | yes | 1.404% | 8 / 60 |
| 2018-04-01 | no segment follows this rebalance, not scored | ||||||
Three or more different insiders bought
Portfolio book, rebalanced quarterly · 5 constructions · 27 names held · selection: reselect · 0.0% in cash · turnover 5.4× · cost drag 0.92% · 2 names dropped at load (29 selected, 27 held across the window), weights renormalised onto the rest
Projection accuracy, realized outcome fell inside the P5–P95 cone in 100.0% of 4 scored rebalances (a well-calibrated 90% band contains ~90.0%) · 95% VaR breached on 5.69% of 246 days (expected ~5.0%)
| Rebalance | P5 | Median | P95 | Realized | In band | VaR 95 (1d) | Breaches |
|---|---|---|---|---|---|---|---|
| 2017-04-01 → 2017-07-01 | -15.1694% | -0.4327% | 16.9731% | -0.6782% | yes | 1.9827% | 0 / 62 |
| 2017-07-01 → 2017-10-01 | -15.2902% | -1.6173% | 14.362% | -2.3874% | yes | 1.8091% | 2 / 62 |
| 2017-10-01 → 2018-01-01 | -14.7067% | -0.1479% | 17.0031% | 2.5312% | yes | 1.8831% | 4 / 62 |
| 2018-01-01 → 2018-04-01 | -14.469% | -2.6961% | 9.3991% | -7.7071% | yes | 1.6005% | 8 / 60 |
| 2018-04-01 | no segment follows this rebalance, not scored | ||||||
Step 13 · 2018-04-02 → 2019-04-01
Every company where an insider bought
Portfolio book, rebalanced quarterly · 5 constructions · 233 names held · selection: reselect · 0.0% in cash · turnover 7.2× · cost drag 1.23% · 3 names dropped at load (236 selected, 233 held across the window), weights renormalised onto the rest
Projection accuracy, realized outcome fell inside the P5–P95 cone in 75.0% of 4 scored rebalances (a well-calibrated 90% band contains ~90.0%) · 95% VaR breached on 3.24% of 185 days (expected ~5.0%)
| Rebalance | P5 | Median | P95 | Realized | In band | VaR 95 (1d) | Breaches |
|---|---|---|---|---|---|---|---|
| 2018-04-01 → 2018-07-01 | -7.7626% | 2.7333% | 13.3448% | 3.9494% | yes | 1.1618% | 2 / 63 |
| 2018-07-01 → 2018-10-01 | -7.8904% | 1.4315% | 11.7595% | 4.4764% | yes | 1.1475% | 1 / 62 |
| 2018-10-01 → 2019-01-01 | -7.0404% | 1.506% | 10.8948% | 0.0% | yes | 1.0021% | |
| 2019-01-01 → 2019-04-01 | -10.4961% | 0.3693% | 11.3802% | 13.5215% | no | 1.2737% | 3 / 60 |
| 2019-04-01 | no segment follows this rebalance, not scored | ||||||
Three or more different insiders bought
Portfolio book, rebalanced quarterly · 5 constructions · 39 names held · selection: reselect · 0.0% in cash · turnover 10.2× · cost drag 1.73%
Projection accuracy, realized outcome fell inside the P5–P95 cone in 25.0% of 4 scored rebalances (a well-calibrated 90% band contains ~90.0%) · 95% VaR breached on 8.91% of 247 days (expected ~5.0%)
| Rebalance | P5 | Median | P95 | Realized | In band | VaR 95 (1d) | Breaches |
|---|---|---|---|---|---|---|---|
| 2018-04-01 → 2018-07-01 | -11.6202% | 0.4512% | 12.8938% | 19.1321% | no | 1.4132% | 3 / 63 |
| 2018-07-01 → 2018-10-01 | -10.6901% | -0.0969% | 11.8256% | 6.0878% | yes | 1.4882% | 3 / 62 |
| 2018-10-01 → 2019-01-01 | -12.9902% | -2.7901% | 8.6757% | -15.575% | no | 1.3212% | 14 / 62 |
| 2019-01-01 → 2019-04-01 | -13.3392% | -2.3745% | 8.7854% | 22.6398% | no | 1.433% | 2 / 60 |
| 2019-04-01 | no segment follows this rebalance, not scored | ||||||
Step 14 · 2019-04-01 → 2020-03-31
Every company where an insider bought
Portfolio book, rebalanced quarterly · 4 constructions · 181 names held · selection: reselect · 0.0% in cash · turnover 5.7× · cost drag 0.97% · 2 names dropped at load (183 selected, 181 held across the window), weights renormalised onto the rest
Projection accuracy, realized outcome fell inside the P5–P95 cone in 75.0% of 4 scored rebalances (a well-calibrated 90% band contains ~90.0%) · 95% VaR breached on 9.64% of 249 days (expected ~5.0%)
| Rebalance | P5 | Median | P95 | Realized | In band | VaR 95 (1d) | Breaches |
|---|---|---|---|---|---|---|---|
| 2019-04-01 → 2019-07-01 | -9.0586% | 1.2848% | 12.8752% | 3.6045% | yes | 1.3472% | 3 / 62 |
| 2019-07-01 → 2019-10-01 | -10.4804% | 0.6949% | 12.1001% | -1.8049% | yes | 1.4118% | 4 / 63 |
| 2019-10-01 → 2020-01-01 | -11.648% | 0.3743% | 12.761% | 11.3056% | yes | 1.6384% | 2 / 63 |
| 2020-01-01 → window end | -8.2678% | 2.2468% | 15.1041% | -32.1378% | no | 1.5621% | 15 / 61 |
Three or more different insiders bought
Portfolio book, rebalanced quarterly · 4 constructions · 35 names held · selection: reselect · 0.0% in cash · turnover 5.9× · cost drag 1.01%
Projection accuracy, realized outcome fell inside the P5–P95 cone in 75.0% of 4 scored rebalances (a well-calibrated 90% band contains ~90.0%) · 95% VaR breached on 9.64% of 249 days (expected ~5.0%)
| Rebalance | P5 | Median | P95 | Realized | In band | VaR 95 (1d) | Breaches |
|---|---|---|---|---|---|---|---|
| 2019-04-01 → 2019-07-01 | -15.2502% | -2.1367% | 13.1006% | -2.4178% | yes | 1.8101% | 3 / 62 |
| 2019-07-01 → 2019-10-01 | -13.2616% | -0.9223% | 11.8571% | -5.4252% | yes | 1.6862% | 4 / 63 |
| 2019-10-01 → 2020-01-01 | -15.1974% | -1.5728% | 12.7544% | 11.415% | yes | 1.9193% | 2 / 63 |
| 2020-01-01 → window end | -11.054% | 0.1774% | 14.0617% | -33.2466% | no | 1.6401% | 15 / 61 |
Step 15 · 2020-04-01 → 2021-04-01
Every company where an insider bought
Portfolio book, rebalanced quarterly · 5 constructions · 260 names held · selection: reselect · 0.0% in cash · turnover 10.5× · cost drag 1.79% · 1 name dropped at load (261 selected, 260 held across the window), weights renormalised onto the rest
Projection accuracy, realized outcome fell inside the P5–P95 cone in 100.0% of 4 scored rebalances (a well-calibrated 90% band contains ~90.0%) · 95% VaR breached on 1.61% of 186 days (expected ~5.0%)
| Rebalance | P5 | Median | P95 | Realized | In band | VaR 95 (1d) | Breaches |
|---|---|---|---|---|---|---|---|
| 2020-04-01 → 2020-07-01 | -24.6564% | -5.5497% | 18.558% | 0.0% | yes | 2.2678% | |
| 2020-07-01 → 2020-10-01 | -25.7558% | -1.0142% | 28.6782% | 8.4062% | yes | 2.8122% | 2 / 63 |
| 2020-10-01 → 2021-01-01 | -23.8575% | -0.4723% | 27.0683% | 22.2652% | yes | 2.6948% | 1 / 63 |
| 2021-01-01 → 2021-04-01 | -20.8688% | 1.6707% | 27.6693% | 12.1831% | yes | 2.6086% | 0 / 60 |
| 2021-04-01 | no segment follows this rebalance, not scored | ||||||
Three or more different insiders bought
Portfolio book, rebalanced quarterly · 5 constructions · 38 names held · selection: reselect · 0.0% in cash · turnover 11.0× · cost drag 1.87%
Projection accuracy, realized outcome fell inside the P5–P95 cone in 100.0% of 4 scored rebalances (a well-calibrated 90% band contains ~90.0%) · 95% VaR breached on 2.15% of 186 days (expected ~5.0%)
| Rebalance | P5 | Median | P95 | Realized | In band | VaR 95 (1d) | Breaches |
|---|---|---|---|---|---|---|---|
| 2020-04-01 → 2020-07-01 | -30.0886% | -8.4917% | 19.9643% | 0.0% | yes | 2.448% | |
| 2020-07-01 → 2020-10-01 | -30.6757% | -0.723% | 37.7538% | 14.8576% | yes | 3.0623% | 1 / 63 |
| 2020-10-01 → 2021-01-01 | -21.8171% | 0.6725% | 26.7824% | 10.0341% | yes | 2.2816% | 2 / 63 |
| 2021-01-01 → 2021-04-01 | -22.0328% | 0.0851% | 25.5759% | 9.2811% | yes | 2.8507% | 1 / 60 |
| 2021-04-01 | no segment follows this rebalance, not scored | ||||||
Step 16 · 2021-04-01 → 2022-04-01
Every company where an insider bought
Portfolio book, rebalanced quarterly · 5 constructions · 193 names held · selection: reselect · 0.0% in cash · turnover 7.6× · cost drag 1.3%
Projection accuracy, realized outcome fell inside the P5–P95 cone in 100.0% of 4 scored rebalances (a well-calibrated 90% band contains ~90.0%) · 95% VaR breached on 1.2% of 249 days (expected ~5.0%)
| Rebalance | P5 | Median | P95 | Realized | In band | VaR 95 (1d) | Breaches |
|---|---|---|---|---|---|---|---|
| 2021-04-01 → 2021-07-01 | -17.6881% | 4.5201% | 32.9047% | 4.417% | yes | 2.5205% | 0 / 62 |
| 2021-07-01 → 2021-10-01 | -17.4161% | 5.8057% | 32.6368% | -3.0123% | yes | 2.3849% | 0 / 63 |
| 2021-10-01 → 2022-01-01 | -19.2027% | 4.1425% | 31.2717% | 5.7033% | yes | 2.4591% | 2 / 63 |
| 2022-01-01 → 2022-04-01 | -17.5133% | 3.1047% | 31.535% | -2.1271% | yes | 2.3221% | 1 / 61 |
| 2022-04-01 | no segment follows this rebalance, not scored | ||||||
Three or more different insiders bought
Portfolio book, rebalanced quarterly · 5 constructions · 16 names held · selection: reselect · 0.0% in cash · turnover 6.6× · cost drag 1.13%
Projection accuracy, realized outcome fell inside the P5–P95 cone in 100.0% of 4 scored rebalances (a well-calibrated 90% band contains ~90.0%) · 95% VaR breached on 2.41% of 249 days (expected ~5.0%)
| Rebalance | P5 | Median | P95 | Realized | In band | VaR 95 (1d) | Breaches |
|---|---|---|---|---|---|---|---|
| 2021-04-01 → 2021-07-01 | -18.7222% | 3.2438% | 31.3288% | 4.8347% | yes | 2.1897% | 1 / 62 |
| 2021-07-01 → 2021-10-01 | -23.0206% | -0.2085% | 26.446% | -2.5538% | yes | 2.3655% | 3 / 63 |
| 2021-10-01 → 2022-01-01 | -20.9993% | 2.496% | 29.9703% | 12.0519% | yes | 2.239% | 1 / 63 |
| 2022-01-01 → 2022-04-01 | -19.9748% | 1.0285% | 30.2942% | -6.0037% | yes | 2.2885% | 1 / 61 |
| 2022-04-01 | no segment follows this rebalance, not scored | ||||||
Step 17 · 2022-04-01 → 2023-03-31
Every company where an insider bought
Portfolio book, rebalanced quarterly · 5 constructions · 178 names held · selection: reselect · 0.0% in cash · turnover 4.6× · cost drag 0.79%
Projection accuracy, realized outcome fell inside the P5–P95 cone in 100.0% of 4 scored rebalances (a well-calibrated 90% band contains ~90.0%) · 95% VaR breached on 8.1% of 247 days (expected ~5.0%)
| Rebalance | P5 | Median | P95 | Realized | In band | VaR 95 (1d) | Breaches |
|---|---|---|---|---|---|---|---|
| 2022-04-01 → 2022-07-01 | -17.4085% | 4.3391% | 34.6635% | -14.8485% | yes | 2.4045% | 9 / 61 |
| 2022-07-01 → 2022-10-01 | -13.731% | 5.631% | 27.0571% | -4.7637% | yes | 2.1415% | 3 / 63 |
| 2022-10-01 → 2023-01-01 | -13.3488% | 1.3768% | 18.7132% | 8.334% | yes | 1.9347% | 4 / 62 |
| 2023-01-01 → 2023-04-01 | -13.9239% | 1.0671% | 20.4255% | 2.1185% | yes | 2.0779% | 4 / 61 |
| 2023-04-01 | no segment follows this rebalance, not scored | ||||||
Three or more different insiders bought
Portfolio book, rebalanced quarterly · 5 constructions · 20 names held · selection: reselect · 0.0% in cash · turnover 4.2× · cost drag 0.72%
Projection accuracy, realized outcome fell inside the P5–P95 cone in 75.0% of 4 scored rebalances (a well-calibrated 90% band contains ~90.0%) · 95% VaR breached on 10.12% of 247 days (expected ~5.0%)
| Rebalance | P5 | Median | P95 | Realized | In band | VaR 95 (1d) | Breaches |
|---|---|---|---|---|---|---|---|
| 2022-04-01 → 2022-07-01 | -18.9708% | 1.898% | 30.8575% | -20.9239% | no | 2.3547% | 10 / 61 |
| 2022-07-01 → 2022-10-01 | -16.3443% | 5.8073% | 31.0896% | -6.1253% | yes | 2.6022% | 4 / 63 |
| 2022-10-01 → 2023-01-01 | -15.6527% | 1.0204% | 21.1161% | 6.0381% | yes | 2.1905% | 3 / 62 |
| 2023-01-01 → 2023-04-01 | -17.0891% | -1.0602% | 19.9928% | -3.3782% | yes | 2.3113% | 8 / 61 |
| 2023-04-01 | no segment follows this rebalance, not scored | ||||||
Step 18 · 2023-04-03 → 2024-03-28
Every company where an insider bought
Portfolio book, rebalanced quarterly · 4 constructions · 161 names held · selection: reselect · 0.0% in cash · turnover 5.4× · cost drag 0.92%
Projection accuracy, realized outcome fell inside the P5–P95 cone in 75.0% of 4 scored rebalances (a well-calibrated 90% band contains ~90.0%) · 95% VaR breached on 1.63% of 245 days (expected ~5.0%)
| Rebalance | P5 | Median | P95 | Realized | In band | VaR 95 (1d) | Breaches |
|---|---|---|---|---|---|---|---|
| 2023-04-01 → 2023-07-01 | -13.7981% | 0.4986% | 18.8236% | 1.2737% | yes | 2.0446% | 2 / 61 |
| 2023-07-01 → 2023-10-01 | -16.6526% | -1.2599% | 17.0909% | -5.6252% | yes | 2.1636% | 0 / 62 |
| 2023-10-01 → 2024-01-01 | -16.6139% | -1.9982% | 15.2874% | 15.7494% | no | 1.9778% | 1 / 62 |
| 2024-01-01 → window end | -17.543% | -1.1446% | 16.565% | 5.8242% | yes | 2.1233% | 1 / 60 |
Three or more different insiders bought
Portfolio book, rebalanced quarterly · 4 constructions · 25 names held · selection: reselect · 0.0% in cash · turnover 5.7× · cost drag 0.98%
Projection accuracy, realized outcome fell inside the P5–P95 cone in 75.0% of 4 scored rebalances (a well-calibrated 90% band contains ~90.0%) · 95% VaR breached on 1.63% of 245 days (expected ~5.0%)
| Rebalance | P5 | Median | P95 | Realized | In band | VaR 95 (1d) | Breaches |
|---|---|---|---|---|---|---|---|
| 2023-04-01 → 2023-07-01 | -12.1209% | 1.9483% | 19.8883% | 0.0519% | yes | 1.9567% | 2 / 61 |
| 2023-07-01 → 2023-10-01 | -18.8281% | -3.2667% | 15.3956% | -6.41% | yes | 2.2289% | 1 / 62 |
| 2023-10-01 → 2024-01-01 | -19.2546% | -3.4065% | 15.6725% | 22.1554% | no | 2.3938% | 0 / 62 |
| 2024-01-01 → window end | -15.3891% | -0.8822% | 14.4433% | 2.0533% | yes | 1.9578% | 1 / 60 |
Step 19 · 2024-04-01 → 2025-04-01
Every company where an insider bought
Portfolio book, rebalanced quarterly · 5 constructions · 180 names held · selection: reselect · 0.0% in cash · turnover 7.3× · cost drag 1.23%
Projection accuracy, realized outcome fell inside the P5–P95 cone in 100.0% of 4 scored rebalances (a well-calibrated 90% band contains ~90.0%) · 95% VaR breached on 3.64% of 247 days (expected ~5.0%)
| Rebalance | P5 | Median | P95 | Realized | In band | VaR 95 (1d) | Breaches |
|---|---|---|---|---|---|---|---|
| 2024-04-01 → 2024-07-01 | -14.2459% | 0.5353% | 17.9732% | -6.206% | yes | 1.8666% | 2 / 62 |
| 2024-07-01 → 2024-10-01 | -14.8608% | 0.786% | 17.5522% | 10.8264% | yes | 1.8848% | 3 / 63 |
| 2024-10-01 → 2025-01-01 | -12.4456% | 2.2324% | 17.7559% | 3.2966% | yes | 1.7631% | 1 / 63 |
| 2025-01-01 → 2025-04-01 | -9.6853% | 1.8527% | 12.916% | 0.2653% | yes | 1.5033% | 3 / 59 |
| 2025-04-01 | no segment follows this rebalance, not scored | ||||||
Three or more different insiders bought
Portfolio book, rebalanced quarterly · 5 constructions · 17 names held · selection: reselect · 0.0% in cash · turnover 9.5× · cost drag 1.62%
Projection accuracy, realized outcome fell inside the P5–P95 cone in 100.0% of 4 scored rebalances (a well-calibrated 90% band contains ~90.0%) · 95% VaR breached on 3.24% of 247 days (expected ~5.0%)
| Rebalance | P5 | Median | P95 | Realized | In band | VaR 95 (1d) | Breaches |
|---|---|---|---|---|---|---|---|
| 2024-04-01 → 2024-07-01 | -17.5134% | -3.0824% | 13.9801% | -2.2367% | yes | 2.161% | 3 / 62 |
| 2024-07-01 → 2024-10-01 | -22.473% | -0.5352% | 24.846% | 22.1922% | yes | 2.0223% | 0 / 63 |
| 2024-10-01 → 2025-01-01 | -17.0943% | 1.732% | 22.6083% | -5.3323% | yes | 2.4735% | 2 / 63 |
| 2025-01-01 → 2025-04-01 | -14.6861% | -0.8724% | 12.7441% | -3.1598% | yes | 1.7577% | 3 / 59 |
| 2025-04-01 | no segment follows this rebalance, not scored | ||||||
Step 20 · 2025-04-01 → 2026-04-01
Every company where an insider bought
Portfolio book, rebalanced quarterly · 5 constructions · 224 names held · selection: reselect · 0.0% in cash · turnover 7.3× · cost drag 1.24%
Projection accuracy, realized outcome fell inside the P5–P95 cone in 100.0% of 4 scored rebalances (a well-calibrated 90% band contains ~90.0%) · 95% VaR breached on 5.26% of 247 days (expected ~5.0%)
| Rebalance | P5 | Median | P95 | Realized | In band | VaR 95 (1d) | Breaches |
|---|---|---|---|---|---|---|---|
| 2025-04-01 → 2025-07-01 | -9.7266% | 0.2647% | 12.4368% | 3.5318% | yes | 1.4969% | 7 / 61 |
| 2025-07-01 → 2025-10-01 | -11.1117% | 2.7837% | 17.3436% | 3.2995% | yes | 1.4893% | 1 / 63 |
| 2025-10-01 → 2026-01-01 | -10.4831% | 1.8292% | 14.5303% | 3.6947% | yes | 1.3551% | 1 / 63 |
| 2026-01-01 → 2026-04-01 | -10.1806% | 2.1976% | 14.9165% | -1.3152% | yes | 1.3296% | 4 / 60 |
| 2026-04-01 | no segment follows this rebalance, not scored | ||||||
Three or more different insiders bought
Portfolio book, rebalanced quarterly · 5 constructions · 37 names held · selection: reselect · 0.0% in cash · turnover 8.5× · cost drag 1.44%
Projection accuracy, realized outcome fell inside the P5–P95 cone in 100.0% of 4 scored rebalances (a well-calibrated 90% band contains ~90.0%) · 95% VaR breached on 8.1% of 247 days (expected ~5.0%)
| Rebalance | P5 | Median | P95 | Realized | In band | VaR 95 (1d) | Breaches |
|---|---|---|---|---|---|---|---|
| 2025-04-01 → 2025-07-01 | -11.8413% | -0.2863% | 14.0617% | 1.7619% | yes | 1.8074% | 6 / 61 |
| 2025-07-01 → 2025-10-01 | -14.2867% | 1.2384% | 17.8387% | 1.4597% | yes | 1.7584% | 3 / 63 |
| 2025-10-01 → 2026-01-01 | -14.2889% | -0.2715% | 14.5036% | 7.3575% | yes | 1.6409% | 3 / 63 |
| 2026-01-01 → 2026-04-01 | -11.868% | 1.51% | 15.417% | -6.355% | yes | 1.4969% | 8 / 60 |
| 2026-04-01 | no segment follows this rebalance, not scored | ||||||